IDENTIFICATION OF NOVEL APOPTOTIC MARKERS BASED ON HYBRIDOMA TECHNOLOGY
A THESIS SUBMITTED TO
THE DEPARTMENT OF MOLECULAR BIOLOGY AND GENETICS AND THE INSTITUTE OF ENGINEERING AND SCIENCE OF
BILKENT UNIVERSITY
IN PARTIAL FULLFILMENT OF THE REQUIREMENTS FOR THE DEGREE OF MASTER OF SCIENCE
By
CEREN ÇIRACI July, 2004
I
I certify that I have read this thesis and in my opinion it is fully adequate, in scope and in quality, as a thesis for the degree of Master of Science.
Assist. Prof. Tamer Yağcı
I certify that I have read this thesis and in my opinion it is fully adequate, in scope and in quality, as a thesis for the degree of Master of Science.
Assist. Prof. Kamil Can Akçalı
I certify that I have read this thesis and in my opinion it is fully adequate, in scope and in quality, as a thesis for the degree of Master of Science.
Assoc. Prof. Ayhan Kubar
Approved for the Institute of Engineering and Science.
Prof. Dr. Mehmet Baray
II ABSTRACT
IDENTIFICATION OF NOVEL APOPTOTIC MARKERS BASED ON HYBRIDOMA TECHNOLOGY
Ceren Çıracı
M.S. in Molecular Biology and Genetics Supervisor: Assis. Prof. Tamer Yağcı
July 2004, 64 Pages
Apoptosis is a physiological cell death program that is characterized by morphological changes such as nuclear condensation, membrane blebbing, cell shrinkage, DNA cleavage and formation of apoptotic bodies. It is required for normal development and maintenance of cellular homeostasis and dysregulation of apoptosis leads to several developmental abnormalities, progression of degenerative diseases and cancer development. Elucidating the mechanisms underlying this form of cell death and development of molecular markers for its identification are of great importance to understand tumorigenesis.
One way to generate molecular markers is based on monoclonal antibody-production. Utilization of such antibodies as apoptotic markers is strictly dependent on their molecular specificity and selectivity in terms of recognizing targeted proteins.
We produced monoclonal antibodies by using apoptotic Huh-7 hepatocellular carcinoma cells as immunogen, and chose two of them, namely 9C11 and 6D5 for further characterization in the context of apoptosis.
III ÖZET
HİBRİDOMA TEKNOLOJİSİ KULLANILARAK YENİ APOPTOTİK BELİRTEÇLERİN TANIMLANMASI
Apoptoz hücre büzüşmesi, çekirdek yoğunlaşması, hücre zarı tomurcuklanması, DNA kırpılması ve apoptoz cisimciklerinin oluşması ile tanımlanan fizyolojik bir hücre ölüm programıdır. Bu program normal gelişimin ve hücresel homeostazinin sürekliliği için gerekli olup, bozukluğu koşullarında gelişimsel anomalilere, dejeneratif hastalıklara ve kanser gelişimine neden olmaktadır. Bu hücre ölüm biçiminin altında yatan mekanizmaları aydınlatmak ve tanımlanması için gerekli moleküler belirteçleri geliştirmek tümör oluşunu anlamak açısından çok büyük öneme sahiptir.
Moleküler belirteçleri geliştirmenin bir yolu monoklonal antikorların üretilmesidir. Bu tür antikorların apoptoz belirteci olarak kulanılması, hedeflenen proteinleri seçici ve özgül olarak tanımalarına bağlıdır.
Apoptoz tetiklenmiş, hepatoselüler karsinom hücre dizisi, Huh7 hücrelerini immünojen olarak kullanıp monoklonal antikorlar geliştirdik ve bunlardan 9C11 ve 6D5 antikorlarını, apoptoz kapsamında daha ileri tanımlanmaları için seçtik.
IV
ACKNOWLEDGEMENT
It is my pleasure to express my deepest gratitude to my advisor Assist.Prof.Tamer Yağcı for his guidance, endless patience, laboratory discipline and efforts throughout my thesis work.
I would like to thank Prof. Mehmet Öztürk for his support and suggestions.
I wish to express my thanks to Hilal Çelikkaya for helping me with the experiments and for her friendship.
Thanks to Cemaliye Akyerli Boylu for helping me any time I needed especially when I was hungry.
Special Thanks to especially Elif Uz, Sevgi Bağışlar and Bâlâ Gür for mentally supporting me all the time and providing me a shoulder to cry any time I needed and laughing at even my worst jokes.
I should also thank to all friends in laboratory for their warm friendships and helps. Thank you very much my dearest family for their invaluable supports, trust and being with me all the time.
V TABLE OF CONTENTS page SIGNATURE PAGE I ABSTRACT II ÖZET III ACKNOWLEDGEMENTS IV TABLE OF CONTENTS V
LIST OF TABLES VIII
LIST OF FIGURES IX
ABBREVIATIONS XI
1. INTRODUCTION
1.1. Apoptosis 1
1.2. Apoptotic pathways 2
1.3. Endogenous inhibitors of apoptosis 11
1.4. Oxidative stress 12
1.5. Apoptosis detection methods 12
1.6. Hybridoma technology and monoclonal antibodies 14 1.7. Aim and strategy 15
2. MATERIALS AND METHODS
2.1. Production and screening of hybridomas 16 2.2 Culture and maintenance of hybridomas. 17
2.3.Purification of the antibodies 18
2.4.Subculturing of HUH-7 Cells 19
VI
2.6.Immunoperoxidase 20 2.7.Protein extraction from cells (preparing cell lysates) 21
2.8.Western Blotting 22
2.9.Immunoprecipitation (IP) with 9C11 and 6D5 28 2.10.Induction of apoptosis by UV-C 28 2.11.Induction of apoptosis by activation of death-receptor mediated
apoptosis 29
2.12.Induction of apoptosis by serum starvation 29 2.13.Induction of apoptosis by oxidative stress 29
2.14.Kinetic assays 30
3. RESULTS
3.1. Production of monoclonal antibodies. 31 3.2. Comparison assay for 11G8, 6D5, 6E10 and 9C11 32
3.3.Biochemical characterization 33
3.4. Kinetic Assays in different apoptosis induction methods 36
3.4.1. UV induction 36
3.4.2. Starvation 38 3.4.3. H2O2 treatment 41 3.4.4. Starvation and H2O2 treatment 42 3.5 Immunofluorescense and Immunoperoxidase with 9C11 44 and 6D5
3.5.1. Kinetic assay in UV-induced apoptosis 44
3.5.2. Kinetic assay in starvation 46
3.5.3. Kinetic assay in oxidative stress. 50 3.5.4. Kinetic assay in starvation and oxidative stress. 52
4. DISCUSSION 54
VII
VIII
LIST OF TABLES
page
IX
LIST OF FIGURES
page
Figure 1.Death receptor structure 6
Figure 2. Intrinsic pathway 9
Figure 3. Caspase proenzyme organization 10 Figure 4. Two principal pathways of apoptosis signal transduction 12 Figure 5. Antibody presence in the supernatants of four hybridomas 32 Figure 6. Immunoprecipitated HUH7 cell lysates 32 Figure 7. Western Blotting with 9C11 and 6D5 monoclonal antibodies 33 Figure 8. Different protein concentrations with 9C11. 34 Figure 9. Different protein concentrations with 6D5. 35 Figure 10. Kinetic assay in UV-induced apoptosis. 36 Figure 11. Kinetic assay in UV-induced apoptosis. 37
Figure 12. Annexin V Assay 38
Figure 13. Kinetic assay in Starvation with 9C11 39 Figure 14. Kinetic assay in Starvation with 6D5 40 Figure 15. Kinetic assay in oxidative stress with 9C11 41 Figure 16. Kinetic assay in oxidative stress with 6D5 42 Figure 17. Kinetic assay in starvation and oxidative stress with 9C11 43 Figure 18. Kinetic assay in starvation and oxidative stress with 6D5 43 Figure 19. Immunofluorescence with 9C11 in UV induction. 45 Figure 20. Immunofluorescence with 6D5 in UV induction. 46 Figure 21. Immunofluorescence with 9C11 in starvation. 48 Figure 22. Immunofluorescence with 6D5 in starvation. 49 Figure 23. Immunoperoxidase assay in oxidative stress with 9C11. 50 Figure 24. Immunoperoxidase assay in oxidative stress with 6D5 51 Figure 25. Immunoperoxidase assay with 9C11 in starvation and 52
X
page Figure 26. Immunoperoxidase assay in starvation and 53
XI
ABBREVIATIONS
APS Ammonium persulfate
Bisacrylamide N, N, methylene bis-acrylamide BSA Bovine serum albumin
ddH2O double distilled water EtOH ethanol
EDTA Ethylenediaminetetra-acetic acid FITC Fluoresceinisothiocyanate FCS Fetal calf serum
g gram
H2O2 hydrogen peroxide HRP horseradish peraxidase KDa kilodalton Lt liter ng nanogram M molar min minute ml mililiter mM milimola µl microliter µg microgram
NaCl sodium cloride NaOH sodium hydroxide rpm revolution per minute SDS sodium dodecyl sulphate
PAGE Polyacrylamide gel electrophoresis
TEMED N, N, N, N-tetramethyl-1-2, diaminoethane
UV ultraviolet
v volt
XII PEG Polyethilen Glycol
AP Alkaline Phoshatase O/N overnight
1
1. INTRODUCTION
1.1 Apoptosis
Apoptosis is a physiological cell death program that was first described in modern scientific world by the article of Kerr, Wyllie and Currie (1972). Apparently, apoptosis was chosen for its meaning of falling of leaves in ancient Greek (Kerr et al, 1972).
Apoptosis is a programmed cell death process that is necessary for eliminating cells which are no longer needed and a fundamental biological process required for normal development and homeostasis in multicellular organisms (Wyllie, 1980). Dysregulation of apoptosis causes some developmental abnormalities and diseases. Morphologically, apoptosis is defined by cell shrinkage, membrane blebbing, DNA cleavage and the formation of apoptotic bodies (Miller et al., 2001). Apoptosis is distinguished from necrosis by these features. Transition from normal to shrunken form and blebbing are rapid, typically take 10-30 minutes, and at that point apoptotic cells are phagocytosed either by their nearest neighbors or by professional macrophages (Zörnig et al., 2001).
In contrast, necrotic cells initially increase their cellular water content and by this way they also increase their volume. The nuclei lose the typical chromatin structure, which is seen as irregular clumping or dissolution and cell membrane ruptures, secretes the cellular contents into the environment. There are some criteria for distinguishing apoptosis from necrosis.
Table 1: Comparison of apoptotic and necrotic cells (Richter, 1993; Studzinski, 1999).
2
Apoptosis Necrosis
Nuclei Dense condensation of
chromatin
Karyolysis is preceded by
irregular chromatin clumping
Cytoplasmic organelles Morphologically intact Disrupted
Cell membrane Apoptotic bodies, blebbing Blebbing and loss of integrity
Cell volume Cells shrinks Cells swell
In tissues Single cell affected Groups of cells affected
Tissue response None Inflammation
1.2 Apoptotic pathways
Apoptosis takes place in two ways: i) The death receptor (DR) or extrinsic pathway ii) The mitochondrial or intrinsic pathway.
External signals or internal signals come and activate a initiator proteases, which subsequently activate the amplifier caspases, causing the activation of effective proteases. Sequential activation of succesive proteases (caspases) provides a fail-safe mechanism that makes possible to abort a premature apoptotic signal and it also serves to amplify the signal to lead rapid finalization of an irrevocable decision to self destruct ( Studzinski, 1999).
3
Death receptor pathway involves oligomerization of cell surface receptors to
trigger the apoptotic pathway. Liver cells generally express DRs perhaps due to evolutionary pressure to omit hepatotropic viruses.
Mitochondrial pathway is mediated by DNA damage, changes of intracellular
Ca+2, and endoplasmic stress response (Yoon et al., 2002). Many types of cellular stress, including starvation, oxidative damage cause initiation of intrinsic pathway where caspase activation follows signals transduced at the level of the mitochondria. (Özören et al., 2002).
Activated molecular pathways differ according to DNA damage type, meaning that the nature of DNA structure recognized by the sensors defines the steps to follow. Depending on their functions within the signaling cascade, there are three types of proteins called sensors, transducers and effectors. Sensors are involved in DNA damage response and detect the damage, transducers transmit the signal where damage is present and effectors elicit the various specific biological responses (Stergiou et al., 2004).
Extrinsic pathway (apoptosis via death receptor)
DRs are cell surface receptors belonging to the tumor necrosis factor (TNF) receptor superfamily and trigger apoptosis after binding to their ligands or in experimental conditions, agonistic antibodies (Ashkenazi, 2002). TNF was isolated more than 15 years ago and reported to have the ability to kill tumor cells in vitro (Schulze-Osthoff et al,1998). TNF is a pleitropic cytokine that is predominantly produced by macrophages and T cells. It induces proliferation, displays cytolytic activity against tumor cells and also induces inflammatory responses and regulates immun responses. TNF mediates its biological effect through TNFR-I and TNFR-II (Gupta, 2001). DRs share a significant homology. They all have an extracellular
4
ligand-binding domain, and 60-80 amino acid cytoplasmic sequence known as the death domain. They differ in their cytoplasmic domains. TNFR-I contains DD (Death Domain), whilst TNFR-II does not. TNFRs do not display enzymatic activity, and thus they have to depend on recruitment of other adapter molecules for signaling (Gupta, 2001).
Figure 1: Death receptor structure (Yoon et al., 2002).
There are six known DRs that are reported. Fas (CD95), Tumor necrosis factor receptor 1(TNF-R1), Tumor necrosis factor related apoptosis inducing ligand (TRAIL) receptor 1 (DR4), TRAIL2 (DR5), DR3 (APO3) and DR6. Among these six death receptors, apoptosis signaling pathways mediated by Fas, TNF-R1 and TRAIL receptors have roles in the apoptosis that occurs in the liver. Pro-apoptotic signaling
5
is similar in all known death receptors. As mentioned above, after the binding of the ligand or specific agonistic antibody, DRs are oligomerized which leads to the recruitment of the cytoplasmic adapter protein. There are two major classes of adaptor molecules: 1) TRAFs and 2) FADD molecules. They both contain a death effector domain (DED) causing the recruitment of caspases via the association with a corresponding death effector domain in the prodomain of the inactive initiator caspases, caspase 8 and 10. The selective recruitment of adapter molecules is determined according to whether they contain a DD or TRAF binding motif (Kasibhatla et al., 2003).
The final complex is called death-inducing signaling complex (DISC). TNF-R1 and TRAIL R1-R2 receptors are activated as defined above. Death receptor mediated apoptosis can be regulated at the level of DISC formation.(Yoon et al., 2002)
Intrinsic pathway (apoptosis via mitochondria)
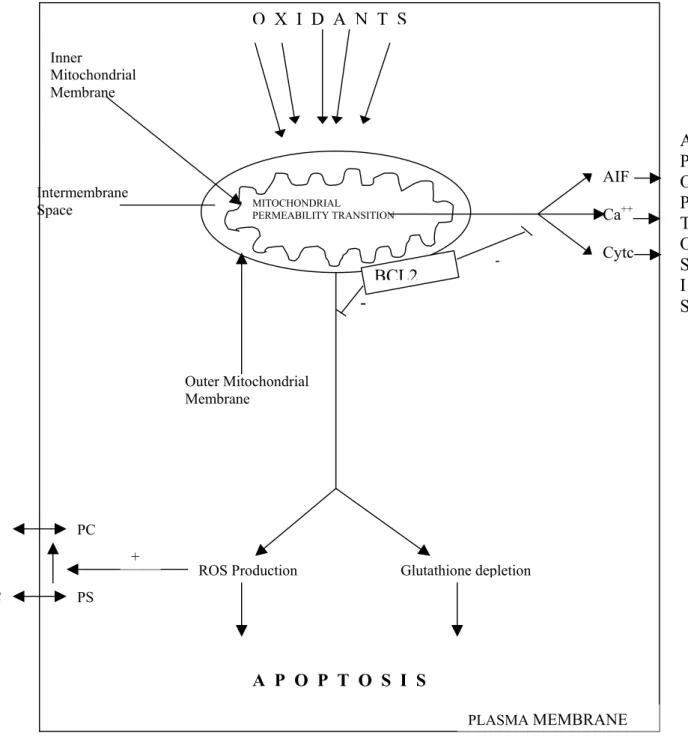
Mitochondria are composed of two well-defined compartments: the matrix, surrounded by the inner membrane and the intermembrane space, surrounded by the outer membrane. The inner membrane contains various molecules such as ATP synthase, electron transport chain proteins etc. Under normal conditions, these molecules provide an electrochemical gradients (membrane potential). The outer membrane contains a voltage- dependent anion channel. The intermembrane space contains cytochrome-c, procaspases, apoptosis-inducing factor (AIF). Permeabilization of the outer membrane during apoptosis results in the releases of cytochrome-c (Figure 2) (Gupta, 2001).
6
Figure 2: Intrinsic pathway (Goel and Khanduja, 1998) AIF: apoptosis inducing factor; Cyt C: cytochrome C; Ca++: calcium; ROS: reactive oxygen species; PS: phoshatidylserin; PC: phoshatidylcholine). PC Glutathione depletion ROS Production A P O P T O S I S PLASMA MEMBRANE PS PC PS + -- Intermembrane Space Inner Mitochondrial Membrane AIF Ca++ Cytc MITOCHONDRIAL PERMEABILITY TRANSITION O X I D A N T S BCL2 Outer Mitochondrial Membrane A P O P T O S I S
7
The primary event is the initiation of cytochrome c release from the intermembrane space of mitochondria into the cytoplasm where it makes a complex with Apaf 1 and procaspase 9, called “apoptosome”. Initiator procaspase 9 becomes active and then activates other downstream effector caspases (Özören et al., 2002).
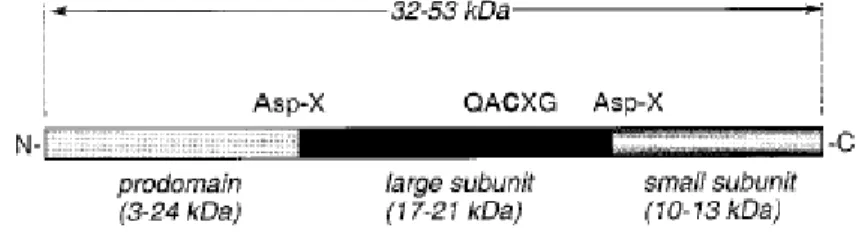
Caspases have primary roles in apoptotic pathways. In this respect, caspases certainly constitute the key effector molecules that are required for in most apoptotic pathways. They are cysteine proteases, which cleave their subsrates after an Asp residue. All caspases are synthesized as zymogens that need to be proteolytically cleaved. Active enzyme is composed of a heterotetrameric complex of two large subunits of approaximately 20 kDa containing the active center and two small subunits of 10 kDa (Figure 3) (Schulze-Osthoff et al.,1998).
Figure 3: Caspase proenzyme organization (Nicholson, 1999).
There are 11 caspases in the human genome. Eight of the human caspases (caspases 2, 3, 6, 7, 8, 9, 10, and 14) function in apoptosis. Two processes lead to the conversion of a latent apoptotic caspase to the enzymatically active form: 1) binding to a caspase activator protein (e.g. Apaf-1) and 2) proteolytic cleavage by another active caspase. Caspases function in cells in a hierarchical order involving “upstream” activator caspases (e.g. caspases 8, and 9) that cleave and activate “downstream” effector caspases (e.g. caspases 3 and 7). In addition, the caspases are divided between two different apoptosis pathways: 1) the death receptor or “extrinsic” pathway in which caspase 8 is the upstream activator caspase; and 2) the mitochondrial or “intrinsic” pathway in which caspase 9 is the upstream activator
8
caspase. The death receptor and mitochondrial pathways converge at the level of the downstream effector caspases. It has been reported that both pathways are capable of operating in most cell types (Degterev et al., 2003).
Subgroups of Caspases
ICE-subfamily Caspase-1, 4,5,11,12,13,14 Ced3/CPP32 subfamily Caspase-3,6,7
ICH-1/Nedd2 subfamily Caspase –2,8,9,10
One of the primary regulators of intrinsic way of apoptosis is the family of Bcl-2 proteins. Bcl-2 family proteins play critical roles in the regulation of programmed cell death. Changes in the level or bioactivities of these proteins are associated with a variety of physiological processes where cell death occurs, including fetal development, normal cell turn over in epidermis and immune cell differentions etc (Reed, 1998;Adam and Corry, 1998). These proteins are classified into proapoptotic members that include Bax, Bak, Bik, Bad, Bid and anti-apoptotic proteins such as Bcl-2 and Bcl-xL based on their ability to suppress or induce the release of cytochrome c.
Although they have opposing activities, all members of the Bcl-2 family proteins contain at least one of the four so-called BH domain (BH1-BH4). Proapoptotic members contains BH3 domain. For example, Bid is a proapoptotic protein that functions to facilitate the activity of other members of the proapoptotic family such as Bax and Bak. The BH3 domain of Bid mediates interaction between various members of the Bcl-2 family to generate a number of heterodimers and homodimers (Kasibhatla et al., 2003).
9
Figure 4: Two principal pathways of apoptosis signal transduction (Schulze-Osthoff et al.,1998)
There is a considerable cross talk between extrinsic and intrinsic pathways. For example, caspase 8 can proteolytically activate Bid, which can then lead to release of cytochrome c (Green, 2000). This apparently increases the apoptotic signal following death receptor activation (Fulda et al., 2001).
1.3 Endogenous inhibitors of apoptosis
As mentioned above Bcl-2 family members have proapoptotic and anti-apoptotic roles during apoptosis. It has been reported that Bcl-2 and Bcl-xL inhibit cytochrome-c release. In addition to anti-apoptotic Bcl-2 family members, there are some other inhibitors of apoptosis (Gupta, 2001). The inhibitors of apoptosis protein family (IAP) consist of Neural Inhibitor of Apoptosis Protein (NIAP), X-linked
10
Inhibitor of Apoptosis Protein (X-IAP), survivin, c-IAP1, c-IAP2 (Deveraux and Reed, 1999). IAPs contain 70 amino-acid motifs termed the BIR (Baculovirus IAP Repeats) domain. IAPs inhibit apoptosis by inhibiting caspase activity through the interaction with caspase 3, 7, 9 but not caspase 1, 6, 8 or 10. XIAP contains the second BIR domain (BIR2), which inhibits caspase 3 and 7 (Gupta 2001). Recently heat shock protein 70 has been reported to have an inhibitory effect on apoptosis (Jaattela et al., 1998). Survivin is another apoptosis inhibitory protein that has structural similarity to IAPs and the only apoptosis inhibitor protein expressed selectively in most human cancers but lacking from normal adult tissue.
1.4 Oxidative stress
Recent studies indicate that apoptosis can be induced by exogenous oxidants (Hockenbery et al.,1993). Several lines of evidence support a role for oxidative stress as a mediator of apoptosis. Both ionizing radiation, which generates reactive oxigen species (ROS) and H2O2 treatment can cause apoptosis.
H2O2 causes dose and time dependent reduction of survival of hepatoma cells and also resulted in an increase in the number of detaching cells from the surface of the culture dish. Loss of adhesion is the feature of apoptotic cells and results in a morphological changes. H2O2 may destroy Ca2+ homeostasis, damage membrane receptors and activate signal transduction system and lead to the apoptosis. Exposure to H2O2 causes a decrease in levels of Bcl-2 protein in some hepatoma cells (Li et
al.,2000).
1.5 Apoptosis detection methods
Apoptosis is distinguished morphologically from necrotic, non-apoptotic cells by some features as mentioned above. Detection of apoptosis in cells and tissues is
11
an important issue both to study the molecular mechanism of apoptosis and roles of apoptosis in diseases. To detect apoptosis, apoptotic features such as activation of death receptors, formation of cytochrome c/Apaf-1 complex, caspase activation, phosphotidylserine exposure, DNA laddering, morphological changes are considered
Analysis of morphological changes of apoptosis
Since the discovery of apoptosis, the morphological changes associated with apoptosis have been widely used to detect apoptotic cell death.These morphological changes include,membrane blebbing,shrinking of cytoplasm, condensation of nucleus and formation of apoptotic bodies.
Although useful in later stages of apoptosis, it is not possible to detect apoptosis in early stages and measure the total amount of the apoptotic cells.
DNA fragmentation assays
DNA laddering takes place during apoptosis, because of the presence of caspase dependent endonucleases. Agarose gel electrophoresis is a commonly used method to detect the ladder pattern of DNA, but it is not possible to quantify the result.
TUNEL Assay (TdT-mediated conjugated dUTP nick end-labeling)
During apoptosis, after cleavage of DNA, single strand breaks in high molecular weight and double stranded DNA in low molecular weight are formed. These fragments can be detected by TUNEL assay. This can be achieved by enzymatic labeling of 3’-OH ends of fragmented DNA. For incorporation of labeled nucleotides into DNA strand breaks, terminal deoxynucleotidyl transferase (TdT) can
12
be used. This method is known as TUNEL assay (Gavrieli et al., 1992). The disadvantage of this method is that late necrotic cells, showing DNA degradation, is also labeled.
Annexin V
Annexin V is a method, which is generally used to detect apoptosis. Annexin V belongs to calcium- dependent phospholipid-binding protein family; therefore it binds phosphotidylserine (PS) in the presence of calcium ions. PS in cell membrane is externalized to the surface in very early stages of apoptosis by the action of flippases. Annexin V is used to detect PS in the outer membrane that has occurred after any kind of cell membrane injury.
1.6 Hybridoma technology and monoclonal antibodies
Monoclonal antibodies (mAb) are essential reagents that are used in several fields such as diagnosis of diseases, treatment of diseases such as infections and cancer. The first and now generally used method for producing homogeneous or monoclonal antibodies of known specificity was described by George Köhler and Cesar Milstein in 1975. This technique is based on the fact that each B lymphocyte produces antibody of a single specificity. Since normal B-lymphocytes cannot grow indefinitely, it is necessary to immortalize B cells that produce a specific antibody. This is achieved by cell fusion between a normal antibody producing B cell and a myeloma cell, followed by selection of fused cells that secrete antibody of the desired specificity derived from the normal B cell. Such fusion-derived immortalized antibody-producing cell lines are called hybridomas, and the antibodies they produce are monoclonal antibodies (Abbas and Lichtman, 2003). Cell lines or clones taken from animals that have been immunized with the substance that is the subject of study produce these antibodies (Nelson et al., 2000).
The therapeutic potential of monoclonal antibodies (mAb) was realized after the hybridoma technique gave rise their development in the mid 1970s as mentioned
13
above. Since then many therapeutic strategies have been developed particularly in the treatment of cancer. (Breedveld, 2000). “Rituximab” was the first produced antibody that is directed against CD20. It is a transmembrane protein on pre- and mature B-lymphocytes. Growth factors are also used as targets for the generation of monoclonal antibodies. For example, antibodies directed to epidermal-growth-factor receptors inhibited the growth of some tumors. Trastuzumab (Herceptin), which is a humanized IgG1 mAb, have been used successfully in the treatment of breast cancer (Breedveld, 2000).
1.7 Aim and Strategy
This project aims to produce mAbs against proteins that are differentially expressed in apoptotic cells and to investigate these Abs as novel apoptotic markers. In our study, UV induced apoptotic HUH-7 cells were injected into mice to obtain mAbs. Cell ELISA assays were performed in order to screen hybridoma clones reacting with apoptosis induced HUH-7 cells. The next step was to explore the differential expressions of antigens recognized by these monoclonal antibodies in apoptotic and non-apoptotic cells. For this purpose, immunofluorescence, immunoprecipitation, and western blotting assays were performed.
16 2.MATERIALS AND METHODS
2.1. Production and screening of hybridomas
9C11, 6D5 and other monoclonal antibodies were previously produced by Tamer Yağcı. One to five millions of apoptotic Huh-7 cells were injected four times into the peritoneal cavity of Balb/c mice at 3 weeks intervals. After the last injection splenic cells of immunized mice were fused with SP2/0 mouse myeloma cells by using polyethylene glycol (PEG), and antibody producing hybridomas were screened by cell-ELISA. Positive clones were further subcloned to ensure the monoclonality and 6D5 and 9C11 antibodies were chosen for further characterization studies.
Cell ELISA (Enzyme-Linked Immunosorbent Assay)
The Cell-ELISA assay was performed to screen the hybridomas in order to identify positive clones, which secrete antibodies recognizing apoptotic Huh-7 cells. To do this Huh-7 cells were cultured in 96 well plates in Dulbecco’s Modified Eagle’s Medium (DMEM) containing % 10 FCS, 1% penicillin/streptomycin and 1% non-essential amino acid (DMEM-10 thereafter). Plates were incubated overnight in CO2 incubator at 37o C and the next day wells were washed two times with PBS.
Cells were fixed with 125 µl. of 4% formalin / well (formalin was prepared freshly in
PBS) for 15 minutes. After one wash with PBS, cell permeabilization was performed by using 125 µl. of 0.2% Triton X-100 / well for 5 minutes (Triton X-100 was prepared in PBS), and then wells were washed twice with ddH2O.
For Blocking, 250 µl. of 2% BSA in PBS was added to the wells and incubated at
37oC for 1 hour. After discarding the blocking solution, previously collected supernatants were added to the wells (50 µl.), incubated 2 hours at 37oC (Primary
17
Antibody) and washed with twice ddH2O. DMEM-10 medium was used as a negative control.
Alkaline phosphatase (AP) conjugated secondary antibody was prepared in 1% BSA-
PBS from a stock solution (Rabbit anti-mouse AP Sigma) in 1:1000 dilution, added to each well and incubated at 37oC for 1 hour. Meanwhile, substrate and buffer tablets (Sigma Fast p-Nitrophenylphosphate Tablet sets p(NPP) Alkaline Phosphatase Substrate) were dissolved in ddH2O and kept in the dark. Wells were washed 4 times with distilled water and previously prepared substrate mixture was added to the wells and left 45-60 minutes at room temperature. When color change was observed in the wells, plates were read at A405 in ELISA reader (Beckman Biomek 2000).
2.2 Culture and maintenance of hybridomas.
The frozen 9C11 and 6D5 antibody producing hybridoma stocks were cultured in high glucose DMEM supplemented with 10% fetal calf serum. FCS, 1% penicillin/streptomycin, 1% nonessential aminoacids and %1 L glutamine. Cells were grown at 37oC and 5% CO2 and hybridoma supernatants were collected by centrifugation of the culture medium at 1500 rpm for 5 minutes at 4oC. This collected supernatants were buffered with 1 M of Tris-HCl pH. 8 to reach a final concentration of 20 mM Tris-HCl; Na Azide was added at a final concentration of 0.02%. Stocks of hybridomas were frozen in freezing medium containing 90% FCS and 10% dimethylsulfoxide (DMSO) and kept in liquid nitrogen tank.
To thaw frozen cells, one vial of hybridomas was taken from nitrogen tank and transferred into the ice immediately. Then, vial was placed into 37oC water bath until complete dissolvation. Cells then were transferred into the centrifuge tubes and washed once with complete DMEM. After centrifugation at 1500 rpm at 4o C for 5 minutes, supernatant was discarded and the resuspended pellet was poured in 10 ml of warm culture medium into 25 cm2 flasks. The viability of cells was checked in the following days.
18
Growing hybridomas were split twice a week in 1:4 to 1:5 ratio. Each time supernatants were collected by centrifuging the culture medium at 1500 rpm for 5 minutes and stored at 4o C.
PBS solution (10X) NaCl 80 g KCl 2 g Na2HPO42H2O 7.64 g KH2PO4 2 g
Complete to 1L with distilled water (pH:7.4).
2.3.Purification of the antibodies
Protein G coated agarose beads were washed three times with PBS, each for 15 minutes. 6D5 and 9C11 supernatants, each 100 ml, were completed to 200 ml. with PBS and incubated with washed beads at room temperature for 2 hours by rotating continuously. Supernatants were centrifuged at 2500 rpm for 2 minutes and the protein G pellets were washed three times with PBS. Antibodies were eluted in elution buffer at pH 2.6. And neutralized immediately with Tris-HCl pH 8.8.
Protein concentration was determined by measuring the OD values of eluates at A280. Eluates were also run in Sodium Dodecyl Sulfate-Polyacrylamide Gel Electrophoresis (SDS-PAGE) and protein bands visualization was accomplished by coommassie staining. Antibody purification experiment was also performed with ascite fluids generated in nude mice. 9C11 and 6D5 eluates were dialyzed against PBS.
19 Elution buffer
0,1 M glycinehydrochloride, pH 2.6
For 1 lt: To 900 ml deionized water, add 7.51 g of glycine. Adjust pH to 2.6 with 5N hydrochloric acid. (HCI). Add deionized water to a final volume of 1000 ml.
2.4.Subculturing of HUH-7 Cells
Cells were splitted once a week and renewal of culture medium was done every 3 days. For splitting, medium was aspirated and the cells were washed twice with PBS. Trypsin (BIOCHROM AG) was added to the plates and plates were incubated in the incubator for 3-5 minutes until the cells are detached. Detached cells were transferred to the centrifuge tubes, centrifuged at 1500 rpm for 5 minutes. Cell pellets were resuspended in fresh DMEM-10 and plated in the desired dilution into new plates.
2.5.Immunoflouresence with 6D5 and 9C11
Huh-7 cells were grown on sterile cover slips in 6 well plates and incubated overnight to allow cells attach the cover slips. Cells were washed twice with PBS and fixed with ice-cold methanol for 10 minutes at –20oC. Since methanol was used, permeabilization step was skipped and after two wash steps with PBS, cells were incubated with 9C11 and 6D5 supernatants at room temperature for 1 hour. After washing three times with PBS, Fluoresceinisothiocyanate FITC-conjugated goat-anti-mouse antibody (DAKO) was used as the secondary antibody and diluted at a ratio of 1:200 in 20 mM Tris HCl pH 8. An incubation of 1 hour at room temperature in the dark was followed with 4 PBS washes. In each immunoflourescence experiment, cells were counterstained with Hoechst 33258 (Sigma). Cells were incubated for 10 minutes in the dark, with the dye at a dilution of 1:700. Cover slips were washed with distilled water for 10 minutes and each cover slip was placed on a microscope slide
20
by using mounting solution. Slides were examined under fluorescent microscope (Zeiss).
Hoechst solution
Hoechst 33258 dye stock solution: 400 µg/ml in water Hoechst 33258 dye final solution: 3 µg/ml
Mounting Solution: 50% glycerol
50% ddH2O
2.6.Immunoperoxidase
Huh-7 cells were grown on sterile cover slips in 6 well plates and incubated overnight to allow cells attach the cover slips. The next day, medium was aspirated and the cells were washed three times with PBS and fixed with ice-cold methanol for 5 minutes at –20o C. After fixation methanol was aspirated, wells are washed with PBS and left at room temperature for the evaporation of remaining methanol. To prevent nonspecific binding, cover slips were blocked with PBS containing 10% FCS and the blocking step lasted 30 minutes at room temperature. At the end of this incubation, blocking solution was aspirated and wells were rinsed once with PBS. Then, fixed cells were incubated with primary antibody for 1 hour at room temperature. Wells were washed three times with PBS and each cover slip was covered with 2 drops of Biotinylated secondary Ab for ten minutes. After another washing with PBS, cover slips were treated with 2 drops of strepto avidin-horse radish peroxide for ten minutes and washed again with PBS. Then, DAP was prepared very quickly as recommended by the manufacturer, added to the each well, and color development was observed (1 to 5 min.). Reaction was stopped by rinsing the cover slips with distilled water and hematoxylene counterstaining was performed for the visualization of nuclei. To get rid of hematoxylene background, cover slips were washed thoroughly with distilled water. Finally, each cover slip was mounted onto glass slides by using mounting solution.
21
2.7.Protein extraction from cells (preparing cell lysates)
When cells grown to 70-80% confluency, they were washed twice with ice cold PBS, scraped in a small volume of the same buffer and centrifuged at 1500 rpm for 5 minutes at 4oC. Pellets were either kept at –80oC or lysed immediately in NP-40 lyses buffer.
NP-40 lyses buffer: 150 mM NaCl
1% NP-40 (Igepal-Sigma) 50mM Tris (pH 8.0)
For lysis, the pellets were resuspended in 4 to 5 volume of NP-40 lyses buffer supplemented with protease inhibitors (Roche; EDTA free complete protease inhibitor cocktail) and incubated on ice for 30 minutes. The lysates were centrifuged at 13000 rpm for 30 minutes at 4oC. Supernatants were transferred into fresh tubes and following protein quantitation; proteins were aliquoted and stored at –80oC.
Bradford Stock solution
Ethanol (95%) 4,75 ml dH2O 250 µl Phosphoric acid (85%) 10 ml Coomassie Brilliant Blue 17,5 mg
Bradford Working solution dH2O 21.25 ml Ethanol (95%) 0,75 ml Phosphoric acid (85%) 1,5 ml Bradford stock solution 1,5 ml
22 Bradford Assay for Protein Quantitation
A standard curve was prepared by using BSA as described below:
Tubes 1 2 3 4 5 6 7 8 BSA(µl) 0 2.5 5 7.5 10 12.5 15 20 dH2O(µl) 100 97.5 95 92.5 90 87.5 85 80 Bradford working solution(µl) 900 900 900 900 900 900 900 900
Protein samples were prepared as described below:
Tubes 1 2 3 4 5
Samples 0 2 2 2 2
dH2O (µl) 98 98 98 98 98
Bradford (µl) 900 900 900 900 900 Lysis buffer (µl) 2 - - - -
A595 values were measured immediately (5-30 min.).
2.8.Western Blotting
SDS-Polyacrylamide gel electrophoresis of proteins
For resolving gel
The glass plates were casted according to the user guide instructions. SDS-PAGE gels with different acrylamide concentrations were prepared considering the linear range of separation (kD). Acrylamide solution was prepared quickly, poured into the space between the glass plates and overlayed with a thin layer of iso-buthanol. After polimerization was complete, iso-buthanol was removed and the surface of the gel was washed several times with deionized water. Any remaining water was discarded by using the edge of a paper towel.
23
For stacking gel
This was prepared in a disposable plastic tube at an appropriate volume and desired concentration. Then, the stacking gel solution was poured onto the surface of the resolving gel. The comb was immediatelly inserted into the stacking gel avoiding air bubble formation. The gel was placed in a vertical position at room temperature. While the gel was polimerizing, samples to be loaded were prepared by boiling them in 1X SDS gel-loading buffer at 100o C for 5 minutes to denature the proteins. After the polimerization of the stacking gel was complete, the comb was removed carefully and each well was checked to discard any unpolymerized acrylamide. The gel was placed in the electrophoresis apparatus and electrophoresis running buffer was poured into top and bottom reservoirs. Any bubble were removed carefully by using a syringe and 5-100 µg of protein was loaded into the wells.
The electrophoresis apparatus was attached to the power supply and the gel was run at a constant volt (80) until the dye has passed to the resolving gel. Then, as the dye reached the resolving gel, voltage was increased to 120-150 volt. When the dye reached the bottom of the gel, power supply was turned off and the glass plates were removed from the apparatus. Plates were separated by using a spatula and the gel was transferred into transfer buffer.
Reagents for SDS –PAGE gel preparation
Stock solutions
Acrylamide/bisacrylamide
Acrylamide (29.2 g /100 ml) 146 g N’N’-Bis-methylene-acrylamide (0,8 g/100 ml) 4 g
Made to 500 ml with distilled water. Filtered and stored at 4o C in the dark (30 days max)
24 1.5 M Tris-HCl pH:8.8
Tris-Base (18.15 g/100 ml) 54.45 g Distilled water 150 ml
Adjusted to pH:8.8 with 1N HCl; made to 300 ml with distilled water and stored at 4oC.
0.5M Tris-HCl pH:6.8 Tris-Base 6 g Distilled water 60 ml
Adjusted to pH: 6.8 with 1N HCl. Made to 100 ml with distilled water and stored at 4o C.
10% SDS
10 g SDS was dissolved in water with gentle stirring and completed to 100 ml with distilled water.
Sample Buffer (SDS reducing buffer )-5X ( Stored at room temperature)
0.225M Tris pH:6.8 50% Glycerol 5% SDS
0.05% BPB(Bromophenol Blue) -add freshly 0.25M DTT (reducing)
25 Electrophoresis buffer (Running Buffer) -5X
Tris- Base 45 g Glycine 216 g
SDS 15 g
Completed to 3 lt with distilled water. Store at 4oC.
Diluted to 1X before using; pH adjustment with acid or base not required.
Components for preparing 10% resolving gel
10% Gel 5 ml 10 ml 15 ml 20 ml 25 ml dH2O 1.9 4 5.9 7.9 9.9 30% mix 1.7 3.3 5 6.7 8.3 1.5 M Tris (pH 8.8) 1.3 2.5 3.8 5 6.3 10% SDS 0.05 0.1 0.15 0.2 0.25 10% APS 0.05 0.1 0.15 0.2 0.25 TEMED 0.002 0.004 0.006 0.008 0.01
Components for preparing 5% stacking gel
5% Gel 1 ml 2 ml 3 ml 4 ml 5 ml dH2O 0.68 1.4 2.1 2.7 3.4 30% mix 0.17 0.33 0.5 0.67 0.83 1.5 M Tris (pH 6.8) 0.13 0.25 0.38 0.5 0.63 10% SDS 0.01 0.02 0.03 0.04 0.05 10% APS 0.01 0.02 0.03 0.04 0.05 TEMED 0.001 0.002 0.003 0.004 0.005
26
Transfer of proteins from SDS-polyacrylamide gels to solid supports
After the running process was complete, four pieces of Whatman 3MM paper and one piece of transfer membrane (PVDF or nitrocellulose) were cut to the exact size of the SDS-polyacrylamide gel by wearing gloves. The membrane was left in methanol for a few seconds, washed with deionized water and soaked into the transfer buffer for 15 minutes along with Whatman 3MM papers.
Preparing of transfer sandwich
2 wet pieces of Whatman 3MM paper were placed onto the anode plate of the transfer apparatus (Bio-Rad, trans-blot) onto which, the membrane was layered. Then, the gel was transferred on this layer of papers and protein markers were punched by using a needle to replicate them on the membrane. Meanwhile, the corner of the memrane was cut to fix its orientation and the transfer sandwich was completed by putting the other 2 wet pieces of Whatmann 3MM paper. The transfer apparatus was assembled by placing the upper plate (cathode) on the top of transfer sandwich.. The transfer system was connected to the power supply and the transfer was done at constant current of 3.5 mA/cm2 of the gel for a period of 45 minutes. Electrical current was turned off and the membrane was removed from the apparatus.
Transfer Buffer
Glycine 2.9 g Trisma –Base 5.8 g SDS 0.37 g Methanol 200 ml
27
Immunological detection of immobilized proteins (Western Blotting)
After the transfer process was completed, the membrane was immersed in the blocking solution for one hour to prevent non-specific binding. After washing, supernatants of 6D5 and 9C11 were added and the membrane was incubated with these primary antibodies at room temperaure for one hour or at 4o C O/N on a rotating platform. Then the antibodies were removed by three washes of TBS-T, one for 15 minutes and two for 5 minutes. Following the washes, the membrane was incubated with 5000 times diluted secondary antibody (HRP-conjugated rabbit anti-mouse Ig-DAKO) for 1 hour at rooom temperature. After the final washing step, the membrane was treated with chemiluminescent substrate to visualize transferred proteins.
Blocking solution
5% milk powder in 0.1%Tween-TBS solution.
(Secondary antibody was diluted in blocking solution containing 3% milk powder.)
Detection of proteins immobilized on the membrane
Detection of the protein was done with ECL Plus Western Blotting Kit (Amersham Life Science; Catalog no: RPN 2106). Membrane was taken away from the TBS-T and touching the edge of the membrane to Whatmann 3 MM paper drained excess buffer. ECL Plus, which was prepared according to the manufacturer instruction, was dropped onto the membrane and after 5 minutes films were developed in the dark room by using Automated Developer Machine (Amersham Hyper processor).
Equal loading
Both anti-Calnexin (AF-18) and cytokeratin-18 monoclonal antibodies were used for this purpose. Developed membrane was incubated with blocking solution
28
and blot processing with either of these antibodies was accomplished as mentioned above (Detection of proteins immobilized on the membrane).
2.9.Immunoprecipitation (IP) with 9C11 and 6D5
Huh-7 cells grown to 70-80% confluency were scraped with ice-cold PBS and stored at –80oC for protein extraction or immediately lysed in lysis buffer. (150mM Na CI,1% NP-40, 50mM Tris pH8, protease inhibitor cocktail-Roche). Meanwhile, the Protein G Gel Slurry (East Coast Biology / R801- H2261) was washed with lysis buffer three times, each for 15 minutes. To avoid non-specific antibody binding, extracted proteins and Protein G beads were co-incubated in microcentrifuge tubes, for 2 hours at room temperature or overnight at 4oC (preclearence). After preclearence, tubes were centrifuged at 2500 rpm for 2 minutes and the supernatants were transferred into fresh tubes. 100 µl. of primary antibody was added and tubes were incubated for 2 hours at room temperature by rotating them constantly. Then, Protein G was added to obtain the triple complex (Antibody+Antigen+Protein G) and tubes were incubated O/N at 4oC. The next day, tubes were centrifuged at 2500 rpm for 2 minutes and supernatants were discarded. Pellets were washed three times with lysis buffer without NP-40 and resuspended in 2X loading buffer. Immunoprecipitated proteins were run in 10% SDS-PAGE and protein transfer and detection were accomplished as described above.
2.10.Induction of apoptosis by UV-C
HUH-7 cells were treated with UV-C to induce apoptosis (125mJ/cm2). For this purpose, culture medium was aspirated; cells were washed twice with PBS and exposed to UV irradiation in Petri dishes by using Stratagene UV-Linker Apparatus. Before placing cell culture dishes into the apparatus, washing medium was aspirated and lids of dishes were displaced. Then, fresh medium was added and culture plates were transferred into the CO2 incubator. Apoptotic cells were observed under inverted light microscope (Zeiss)
29
2.11.Induction of apoptosis by activation of death-receptor mediated apoptosis
Jurkat cells derived from a human T-cell leukemia were cultured to subconfluency in RPMI medium up to 106 cells / ml. Anti-Fas antibody (Upstate Biotechnology-clone CH11) was added to culture flasks at a concentration of 25-50 ng/ml. Cells were collected after 16 hours and pelleted for protein extraction.
2.12.Induction of apoptosis by serum starvation
Hepatocellular carcinoma cells were grown under serum free conditions for three days in order to induce apoptosis. By the end of this period, as the cells started to show morphological characteristics of apoptosis, cells were scraped as previously described and cell pellets were stored at -80oC for protein extraction.
2.13.Induction of apoptosis by oxidative stress
It was performed in two ways.
i) Huh-7 cells were incubated in a culture medium containing 0.1% FCS for 72 hrs, and then treated with freshly prepared 100 µM H2O2. Cells were collected after minimum 4 hrs (Sayan et al ., 2001).
ii) Cells were directly treated with 500µM H2O2 .
Annexin V assay
Cells were grown on sterile cover slips treated with Annexin -V-Fluos (Roche Annexin-V-FLUOS staining Kit) for 10 minutes as recommended by manufacturer. Then, cells were observed under fluorescence microscope (Zeiss).
30 2.14.Kinetic assays
After UV-induction, Huh-7 cells were harvested at different periods. At 0; 2; 4; 8; 16
and 24. hour, cell pellets were collected and western blotting and staining experiments were performed.
After Serum starvation, cell pellets were taken at 0; 1; 2; 3; 4; 5th day and western blotting and staining experiments were performed.
After 500 µM H2O2 treatment, cell pellets were collected at 0; 1; 2; 4; 8; 16; 24th hours
and western blotting and staining experiments were performed.
After100µM H2O2 treatment, pellets were taken at 0; 2; 4; 8; 16; 24th hours and then
31 3. RESULTS
Results are explained in the following order:
*Production of monoclonal antibodies. *Comparison of Hybridoma clones.
*Biochemical characterization of the antigens recognized by 6D5 and 9C11. Western Blotting with 9C11 and 6D5
Immunoprecipitation with 9C11 and 6D5. *Expression of 9C11 and 6D5 in apoptotic cells. *Immunofluorescence with 9C11 and 6D5. *Immunoperoxidase with 9C11 and 6D5.
3.1. Production of monoclonal antibodies.
Balb/C mice were immunized with apoptotic Huh7 cells. Animals were sacrified and splenic cells were fused with SP2/0 parental myeloma cells. Initially antibody-secreting cells were screened by Cell-ELISA, western blot and immunoprecipitation experiments, and 2 clones, namely 6D5 and 9C11 out of 4 were selected for further characterization studies (Figure 5 and 6). We also demonstrated that 6D5 and 9C11 antibodies recognize different proteins.
32
Figure 5. Antibody presence in the supernatants of four hybridomas were shown, as evidenced by immunoprecipitating supernatants directly with protein G beads and subjecting immunoprecipitates to SDS-PAGE and western blot. 50 kd bands correspond to the heavy chain of antibodies.
3.2. Comparison assay for 11G8, 6D5, 6E10 and 9C11
a
b
Figure 6. Immunoprecipitated HUH7 cell lysates with 9C11, 6D5, 6E10 and 11G8 antibodies and immunoprecipitates were loaded to SDS-PAGE as three
11G8 6D5 6E10 9C11 118 88 46.5 6E10 6D5 6E10 6D5 9C11 11G8 11G8 118 88 46.5
9C11 6E10 6D5 9C11 6E10 6D5 9C11 6E10 6D5 11G8
i ii iii iv 118 88 46.5 9C11 6E10 6D5 9C11 6E10 6D5 iii i
33
identical sets, except the 11G8 one. After their transfer onto PVDF membrane, each set was probed with 6E10, 6D5, 9C11 and 11G8, respectively (6a). Then, membranes of 9C11 and 6E10 were probed with 11G8 (6b). 6E10, 6D5 and 11G8 antibodies (6a-i; 6a-ii; 6b-iii and 6b-i respectively) were shown to recognize the same antigen, except 9C11, which recognized a different one. Upper bands correspond to proteins recognized by our antibodies (approximately 75 kD), and lower bands indicate the heavy chain of immunoglobulins.
3.3.Biochemical characterization
Western Blotting with 9C11 and 6D5 monoclonal antibodies
We also investigated the differential expression of proteins recognized by our antibodies, in the context of apoptosis. Total cell lysates from apoptotic and non-apoptotic Huh7 and Jurkat cells were prepared and loaded to 10% SDS-PAGE. After their transfer to PVDF membranes, proteins were probed with 6D5 and 9C11 antibodies. Negative controls, which were not treated with primary antibodies, were also included (not shown). As shown in figure 7., 9C11 antibody recognized both apoptotic and non-apoptotic Huh7 and Jurkat cells (Figure 7. lanes 1, 2, 3 and 4). However, 6D5 antibody failed to react with any protein of Jurkat cells (Figure 7. lanes 5, 6) while recognizing apoptotic and non-apoptotic HUH7 cell lysate (lane 7 and 8 of the same figure). These results clearly demonstrate that 6D5 antibody has a more restricted tissue recognition pattern.
9C11 6D5
Figure 7. Western Blotting with 9C11 and 6D5 monoclonal antibodies 118
87 46
34
Lane 1: Jurkat; Lane 2: Jurkat+Anti-Fas Antibody; Lane 3: Huh7; Lane 4: Apoptotic Huh7 (Lane 5-6-7-8: same order).
Huh7 cells were exposed to UV-C (20 J/m2) in order to induce apoptosis. Jurkat cells were treated with anti-Fas antibody (50 ng /ml) for apoptosis induction. Non-apoptotic and Non-apoptotic cell proteins from both cell lines were probed with 9C11 (lanes 1, 2, 3 and 4) and 6D5 (Lanes 5, 6, 7, 8) in western blotting assay. There was no differential protein expression between non-apoptotic and apoptotic cells.
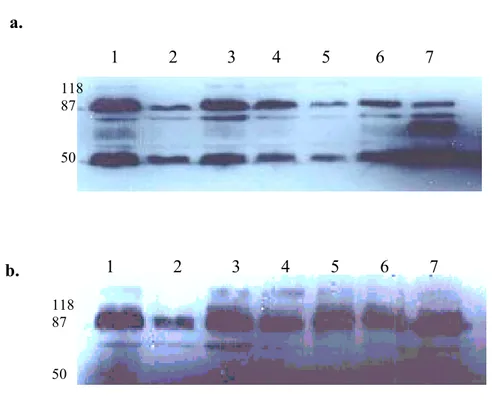
We also performed western blot experiments to show the binding strength of our antibodies to their cognate ligands. To do this, total cell lysates of HUH7 cells were loaded on SDS-PAGE at different concentrations varying from 1µg. to 20 µg. Even the lowest concentration of proteins reacted with 9C11 (figure 8a) and 6D5 (figure 9a). Apoptotic cells show less band intensity than non-apoptotic cells (Lanes 2, 4, 6, 8 in figure 8a and 9a).
a.
b.
Figure 8. Different protein concentrations with 9C11. Lysates that had been obtained from both apoptotic and non-apoptotic Huh7 cells were run in 10% SDS-PAGE at concentrations indicated below and transferred to PVDF membrane.
1 2 3 4 5 6 7 8 118 87 46 1 2 3 4 5 6 7 8 46,5
35
Lane 1: non-apoptotic -1µg, Lane 2: apoptotic -1 µg, Lane 3: non-apoptotic-5 µg, Lane 4: Apoptotic -5 µg, Lane 5: non-apoptotic -10 µg, Lane 6: Apoptotic-10 µg, Lane 7: non-apoptotic - 20 µg, Lane 8: Apoptotic-20 µg, Lane 9: negative control (not probed with 9C11). Membrane was probed with 9C11 to show the antibody strength (a) and with anti-CK-18 mAb to check the protein amounts that were loaded (b).
a.
b.
Figure 9. Different protein concentrations with 6D5. Lysates that had been obtained from both apoptotic and non-apoptotic Huh7 cells were run in 10% SDS-PAGE at concentrations indicated below and transferred to PVDF membrane.
Lane 1: non-apoptotic -1µg, Lane 2: apoptotic -1 µg, Lane 3: non-apoptotic-5 µg, Lane 4: Apoptotic -5 µg, Lane 5: non-apoptotic -10 µg, Lane 6: Apoptotic-10 µg, Lane 7: non-apoptotic - 20 µg, Lane 8: Apoptotic-20 µg, Lane 9: negative control (not probed with 6D5). Membrane was probed with 6D5 to show the antibody strength (a) and with anti-CK-18 mAb to check the protein amounts that were loaded (b). 1 2 3 4 5 6 7 8 118 87 46 1 2 3 4 5 6 7 8 118 87 46
36
3.4 Kinetic Assays in different apoptosis induction methods
3.4.1 UV induction
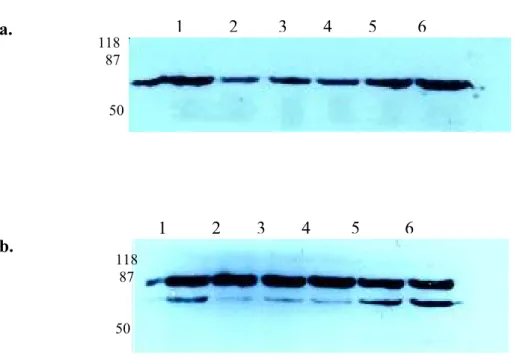
HUH7 cells were exposed to UV-C irradiation to induce apoptosis and cell lysates were collected at different time course. As shown in figure 10, there was a significant signal reduction in early apoptotic stage (2, 4 and 8th hours.), but the protein expression was recovered in 16th and 24th hours. The differential expression was more obvious in equal loading membrane (figure 10b lower bands), since the bands in the membrane probed with 9C11 were at saturation (figure 10a).
a. b.
Figure 10. Kinetic assay in UV-induced apoptosis.
Huh7 cells were treated with UV-C and cells were harvested at different periods. Lane 1: No UV induction, Lane 2-6: 2, 4, 8, 16, 24 hrs respectively after UV induction . Total lysates of these cells were run in SDS-PAGE and proteins were
118 87 50 1 2 3 4 5 6 118 87 50 1 2 3 4 5 6
37
probed with 9C11 after their transfer onto PVDF membrane (a). Equal loading was performed with AF-18, anti-calnexin monoclonal antibody (b). The same pattern was also observed in the experiment performed with 6D5 but, several bands appeared in the membrane probed with this antibody (figure 11a). These results lead us to speculate that the protein recognized by 6D5 antibody might have different isoforms or distinct proteins sharing a common epitope were visualized in our western blots.
a.
b.
Figure 11. Kinetic assay in UV-induced apoptosis.
Huh7 cells were treated with UV-C and cells were harvested at different periods. Lane 1: No UV induction, Lane 2-6: 2, 4, 8, 16, 24 hrs, respectively after UV induction . Total lysates of these cells were run in SDS-PAGE and proteins were probed with 6D5 after their transfer onto PVDF membrane (a). Equal loading was performed with AF-18, anti-calnexin monoclonal antibody (b, upper bands).
50 1 2 3 4 5 6 118 87 50 118 87 1 2 3 4 5 6 50
38 Annexin V Assay
One of the most common techniques used is the detection of phosphotidylserine in the outer leaflet of the plasma membrane of apoptotic cells, using labelled annexin V. Therefore, we confirmed the occurrence of apoptosis after treatment of Huh7 cells with UV-C irradiation by using Annexin V assay (figure 12).
Figure 12. Annexin V Assay. Apoptosis was induced by UV-C irradiation ( 20 J/m2 ) and cells were subjected to Annexin V assay at 4th and 24th hour after treatment (A and C, respectively). Untreated cells were used as negative controls for indicated times (B and D, respectively).
3.4.2. Starvation
Huh7 cells were grown in serum free conditions to induce apoptosis and cell lysates were collected at different time course. Control cells grown in DMEM-10 and DMEM-0 supported with 100 nM selenium were also included in the experiment, since such growth conditions do not allow apoptosis to occur. The follow-up of apoptosis development was performed by morphological analysis of starved cells under inverted microscope (data not shown). Total lysates of these cells were run in SDS-PAGE and proteins were probed with 9C11 (figure 13) and 6D5 (figure 14a)
39
after their transfer onto PVDF membrane. Equal loading was performed with AF-18, anti-calnexin monoclonal antibody (figure 13b and figure 14b) .
Under starvation condition, HUH7 cells have been reported to undergo apoptosis starting from day 3, and increase in the following days (Sayan et al, 2002.). In our starvation assay, we observed, as in UV-induced apoptosis experiment, that proteins recognized by 9C11 and 6D5 antibodies were down-regulated in the early phases of apoptosis (day 3; figure 13-lane 5 and figure 14a-lane 5). However, the band intensity of proteins were recovered in day 4 and 5 (figure 13 and 14a, lanes 6 and 7). This result was also consistent with our previous observation in UV-induced apoptosis assay, in which the same recovery was encountered in the late phase of apoptosis (figures 6a, 6b, 7a and 7b; lanes 5 and 6).
Figure 13. Kinetic assay in starvation with 9C11
Cells were grown in serum free conditions to induce apoptosis. Total lysates of these cells were run in SDS-PAGE and transferred onto PVDF membrane. Proteins were probed 9C11 (lower bands) and AF-18 (upper bands), anti-calnexin monoclonal antibodies.
Lane 1: Control 1 (DMEM-10), Lane 2: control 2 (DMEM-0 containing 100 nM selenium), Lane 3-7: day 1, day 2, day 3, day 4 and day 5, respectively after starvation.
1 2 3 4 5 6 7
118 87 50
40 a. b.
Figure 14. Kinetic assay in starvation with 6D5
Cells were grown in serum free conditions to induce apoptosis. Total lysates of these cells were run in SDS-PAGE and transferred onto PVDF membrane. Proteins were probed with 6D5 (a) and AF-18 (b), anti-calnexin monoclonal antibodies.
Lane 1: Control 1 (DMEM-10), Lane 2: control 2 (DMEM-0 containing 100 nM selenium), Lane 3-7: day 1, day 2, day 3, day 4 and day 5, respectively after starvation. 1 2 3 4 5 6 7 118 87 50 118 87 50 1 2 3 4 5 6 7
41 3.4.3. H2O2 treatment
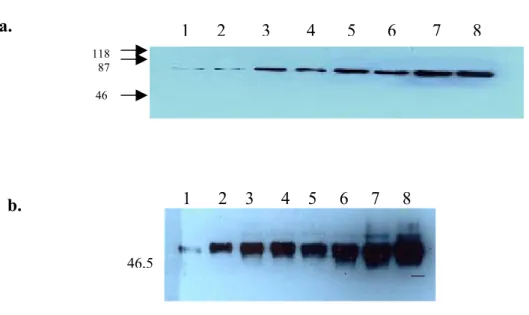
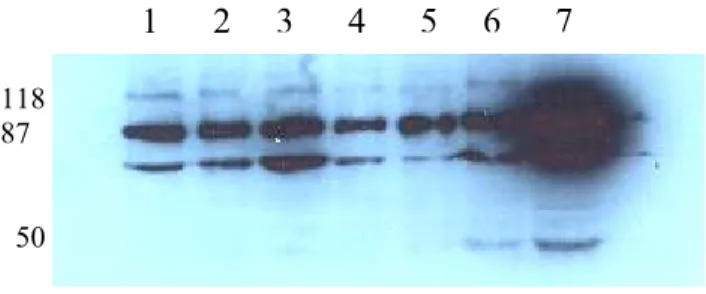
The fact that cells undergo apoptosis with reactive oxygen species (ROS) and direct treatment of H2O2 has been well established. In this context, we treated Huh7 cells with 500 µM H2O2 and collected cells at different times after treatment. However, we did not observe any morphological changes indicating apoptosis induction under this experimental condition (data not shown). Lysates were prepared and proteins were run in 10% SDS-PAGE. After transfer of proteins, PVDF membranes were probed with 9C11 (figure 15) and 6D5 (figure 16a). Unlike UV-induced and starvation-induced apoptosis, H2O2 treatment caused a gradual decrease in the band intensity of proteins recognized by 6D5 (figure 16a), without any recovery event in the late phases of apoptosis. On the other hand, we could not make such a conclusion in the case of 9C11 antibody, because of equal loading problem (Figure 15), yet decreased expression of proteins in the late phases of treatment was observed (Figure 15 lanes 6 and 7).
Figure 15. Kinetic assay in oxidative stress with 9C11.
Lane 1: Control (no H2O2 treatment), Lane 2-7: 1 hour, 2 hours, 4 hours, 8 hours, 16 hours, and 24 hours, respectively after H2O2 treatment. Lane 8: negative control (lysate from untreated cell loaded but not probed with primary antibody). Membrane probed at a time with 9C11 (lower bands), and AF-18 (upper bands).
1 2 3 4 5 6 7 8
118 87 46
42 a.
b.
Figure 16. Kinetic assay in oxidative stress with 6D5
Lane 1: Control (no H2O2 treatment), Lane 2-7: 1 hour, 2 hours, 4 hours, 8 hours, 16 hours, and 24 hours, respectively after H2O2 treatment. Membrane was probed with 6D5 (a) and equal loading was performed with CK18 mAb (b).
3.4.4. Starvation and H2O2 treatment
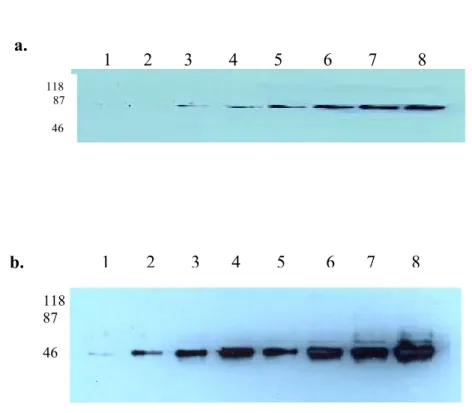
A more intensive oxidative stress condition was also established. To do this, Huh7 cells were grown in 0.1% FCS for 72 hours and then treated with 100 µM H2O2 . Apoptotic cells were observed under light microscope even before the addition of H2O2 into the culture (data not shown). Cells were collected at different times and lysates were prepared. Proteins were run in 10% SDS-PAGE transferred to PVDF membrane. This time, starvation alone caused a decrease in the expression of proteins recognized by both 9C11 and 6D5 (lane 2 of figure 17a and 18a,
118 87 50 1 2 3 4 5 6 7 1 2 3 4 5 6 7 118 87 50
43
respectively) and expression was recovered in the very late phase of oxidative stress conditions (Lane 7 of figure 17a and 18a, respectively). While evaluating these results, one should consider that proteins were overloaded in lanes 3 and 4 of figures 17a and 18a.
a. b.
Figure 17. Kinetic assay in starvation and oxidative stress with 9C11. Lane 1: Control (DMEM-10), Lane 2: (DMEM-0.1 without H2O2 treatment), Lane 3-7: 2, 4, 8, 16, 24 hours after treatment. Membrane was probed with 9C11 (a) and equal loading was performed with AF-18 (b).
a.
b.
Figure 18. Kinetic assay in starvation and oxidative stress with 6D5. Lane 1: Control (DMEM-10), Lane 2: (DMEM-0.1, without H2O2 treatment), Lane 3-7: 2, 4,
1 2 3 4 5 6 7 118 87 50 1 2 3 4 5 6 7 118 87 50 1 2 3 4 5 6 7 50 1 2 3 4 5 6 7 118 87 50
44
8, 16, 24 hours after treatment. Membrane was probed with 9C11 (a) and equal loading was performed with with CK-18 (b).
3.5 Immunofluorescense and Immunoperoxidase with 9C11 and 6D5
We continued our experiments with immunofluorescense and immunoperoxidase staining assays to verify western blot data. These studies allowed us to detect cellular localization of proteins recognized by 9C11 and 6D5, as well as the intensities of antibody reactivities depending on different apoptosis induction assays. Cells were grown on the sterile cover slips and fixed with ice-cold methanol. After their treatment with either antibody, fixed cells were treated with FITC or peroxidase conjugated secondary antibody and counterstaining was accomplished by Hoechst 33258 or hematoxylene for immunofluorescense and immunoperoxidase, respectively.
3.5.1 Kinetic assay in UV-induced apoptosis
Apoptosis was induced as previously described (3.4.1.). Cover slips were collected at times indicated (Figure 19, 20) and cells were subjected to immunofluorescence assay. Concordant with our western blot experiment (Figure 10, 11), a decrease in the signal intensity during early phase of apoptosis was observed (C, E), and the expression of protein was recovered at the late phase (I, K). Non-apoptotic cells were included as positive control (A) and displayed strong staining pattern.
45
Figure 19. Immunofluorescence with 9C11 in UV induction. A-C-E-G-I-K, nonapoptotic; 2, 4, 8, 16 and 24 hrs after treatment, respectively; B-D-F-H-J-L, counterstaining with Hoechst 33258. Primary antibody: 9C11. Cells not treated with primary antibody were used as negative controls (not shown).
A B C D
E F G H
46
Figure 20. Immunofluorescence with 6D5 in UV induction. A-C-E-G-I-K: nonapoptotic, 2, 4, 8, 16 and 24 hrs after treatment, respectively; B-D-F-H-J-L: counterstaining with Hoechst 33258. Primary antibody: 6D5. Cells not treated with primary antibody were used as negative controls (not shown)
3.5.2. Kinetic assay in starvation
Immunofluorescence was performed after cells were grown under serum-free conditions. Signal decrease at day 3 and recovery of the signal intensity at days 4 and
A B C D
I J K L
47
5 of starvation, justified the western blot data (Figure 21 I, K, M; Figure 22 I, K, M). Unstarved cells were used as positive controls (Figure 21 A; Figure 22 A). It has been shown that serum-free medium containing 100 nM selenium protect cells to undergo apoptosis in starvation conditions, however we observed a slight decrease in signal intensity in cells supplied with selenium (Figure 21 C; Figure 22 C).
48
Figure 21. Immunofluorescence with 9C11 in starvation. A-C-E-G-I-K-M: DMEM10, DMEM0+Selenium, 1, 2, 3, 4 and 5 days after treatment, respectively; B-D-F-H-J-L-N: counterstaining with Hoechst 33258, respectively. Primary antibody: 9C11. Cells not treated with primary antibody were used as negative controls (not shown). White arrow indicates apoptotic cells.
A B C D
I J K L
E F G H
49
Figure 22. Immunofluorescence with 6D5 in starvation. A-C-E-G-I-K-M: DMEM10, DMEM0+Selenium, 1, 2, 3, 4 and 5 days after treatment, respectively; B-D-F-H-J-L-N: counterstaining with Hoechst 33258, respectively. Primary antibody: 6D5. Cells not treated with primary antibody were used as negative controls (not shown). White arrow indicates apoptotic cells.
A B C D I J K L E F G H M N K L A B C D I J K L
50 3.5.3 Kinetic assay in oxidative stress.
As previously explained in (3.4.3), oxidative stress condition was generated by treating cells with 500 µM H2O2 and cells were collected at indicated times. After their incubation with 9C11 and 6D5 antibodies, immunoperoxidase staining was performed (Figure 23; Figure 24). Unlike UV induction and starvation conditions, a gradual decrease in the staining intensity was observed with either antibody (Figure 23. A, B, C, D, E, F, G; Figure 24. A, B, C, D, E, F, G).
Figure 23. Immunoperoxidase assay in oxidative stress with 9C11. Cells were treated with 500 µM H2O2. A-B-C-D-E-F-G: Cells grown in DMEM-10 only; and
A B C
D E F
51
cells collected after 1, 2, 4, 8, 16 and 24 hrs of treatment, respectively. Counterstaining was performed with hematoxylene. Cells not treated with primary antibody were used as negative control H. Primary antibody was 9C11.
Figure 24. Immunoperoxidase assay in oxidative stress with 6D5. Cells were treated with 500 µM H2O2. A-B-C-D-E-F-G: Cells grown in DMEM-10 only; and cells collected after 1, 2, 4, 8, 16 and 24 hrs of treatment, respectively. Counterstaining was performed with hematoxylene Primary antibody was 6D5.
A B C
D E F