Copyright © 2020 by Author/s and Licensed by Modestum Ltd., UK. This is an open access article distributed under the Creative Commons Attribution License which permits unrestricted use, distribution, and reproduction in any medium, provided the original work is properly cited.
2020, 17(6), em255 e-ISSN: 2516-3507
https://www.ejgm.co.uk/ Original Article OPEN ACCESS
Alkaline Phosphatase is not Associated with Insulin Resistance: A
Retrospective Cross-Sectional Study
Esra Bihter Gürler 1*, Serpil Çeçen 2 1 İstanbul Atlas University, School of Medicine, Department of Physiology, İstanbul, TURKEY
2 Marmara University, Pendik Education and Research Hospital, Sports Physiology Clinics, İstanbul, TURKEY
*Corresponding Author: [email protected]
Citation: Gürler EB, Çeçen S. Alkaline Phosphatase is not Associated with Insulin Resistance: A Retrospective Cross-Sectional Study. Electron J
Gen Med. 2020;17(6):em255. https://doi.org/10.29333/ejgm/8323
ARTICLE INFO ABSTRACT
Received: 11 Apr. 2020 Accepted: 26 May 2020
Background: Many epidemiologic studies suggested that vitamin D deficiency is associated with obesity but the
relationship between obesity and alkaline phosphatase (ALP) is controversial. In this study association between insulin resistance and alkaline phosphatase is investigated.
Methods: Of the 124 women aged (35,942±9,714) years with (39,47±7,66) body mass index (BMI) and with vitamin
D deficiency is included. The relationship among insulin, glucose, parathormone (PTH), calcium (Ca), alkaline phosphatase (ALP) were evaulated with correlation, linear regression and ANOVA (with post hoc TUKEY). Statistical analysis performed with Eviews v.11 and Graphpad Prism v.8.1
Results: There was no significant correlation among Vitamin D, ALP and PTH in non-insulin resistance patients. A
weak correlation was found among Vitamin D, ALP and Parathormone in insulin resistance group. There was no significant elevation between ALP levels in patients with or without insulin resistance.
Conclusion: Elevation in ALP levels is not associated with insulin resistance. It might be a response to elevated
parathormone levels. Further investigations in large populations are required to understand the relationship between insulin resistance and ALP.
Keywords: alkaline phosphatase, insulin resistance, parathormone, vitamin D
INTRODUCTION
Vitamin D3 or cholecalciferol are two main forms of vitamin D and obtained by the action of UVB light on cholesterol in the skin (1). There is a small contribution from food and other supplements (2). Vitamin D3 and cholecalciferol are prohormones that are hydroxylated in the liver to 25OH and finally in the kidney into 1,25-dihydroxy vitamin D3 [1,25(OH)2D]. This active form binds to vitamin D receptors inside cells and forms gamma carboxy glutamic acid-containing protein or Ca+2-binding protein which mediates the
absorption of calcium from the gut (3).In normal physiological conditions, this process is regulated by parathyroid hormone (PTH) and calcium in circulation.
Alkaline phosphatase (ALP) was first described in 1907 (4) and investigated extensively. However, there is a limited knowledge about its physiological role. Many studies revealed that elevated level of ALP is associated with bone and liver diseases [5-8]. On the contrary, lower levels of ALP is also related with several disorders including; osteoporosis, malnutrition, magnesium deficiency and hypothyroidism (9-11).
Indeed, vitamin D is a fat-soluble vitamin, meaning that it can be stored in body fat (BF). Excessive BF can reduce 25(OH)D levels in the body, especially in obese individuals.
Limited studies have assessed the association between obesity, 25(OH)D levels, parathormone, and ALP in non-menopause obese women. This retrospective cross-sectional study aimed to understand the relationship among vitamin D, parathormone, and ALP status among Turkish obese women by analyzing data from the Marmara University Pendik Research and Education Hospital Sports Physiology Clinics.
MATERIALS AND METHODS
Study Population
Of the 124 women aged (36±10) years with (40±8) body mass index (BMI) and serum 25(OH)D levels of around 13 were (13.26±5.63) included in this study. Exclusion criteria was limited to patients that are taking vitamins, Ca+2, undergoing
therapies related to bone metabolism. Pregnant women, patients suffering from hypo/hyperthyroidism, and dyslipidemia were also excluded from the study.
Measurement of Obesity and Insulin Resistance
Obesity status was measured based on BMI and homeostatic model assessment (HOMA). Bodyweight (BW), fat mass (FM), fat-free mass (FFM), fat percentage (% F), was measured in light clothing and without shoes on a BC-418 Segmental Body Composition Analyzer (Tanita, Tokyo, Japan).
Height was measured to the nearest 1 mm by a stadiometer. BMI was calculated as [ bodyweight (kg)/height (m)2 ]. For adult
women, we used the World Health Organization criteria for the Caucasian population, which defines obesity as a BMI ≥25 kg/m2. HOMA of β-cell function and insulin resistance (IR) was
calculated using the formula: FBI (µU/L) x FBG (nmol/L)/22.5.
Biochemical Analysis
Blood samples were obtained in the morning after a fast of at least 8 hours. Analysis of plasma concentrations of insulin, glucose, PTH, Ca, ALP was processed in the Pendik Education and Research Hospital Central Laboratory, İstanbul. Insulin and PTH were assessed on a Cobas®6000 (Roche Diagnostics, Mannheim, Germany), and on a Dimension Vista®1500 (Siemens Healthcare, Erlangen, Germany) using enzymatic colorimetric method. Ca, ALP, and glucose were assessed on AU®5900 (Beckman Coulter, USA) using photometric, kinetic, and enzymatic colour tests. Vitamin D was determined on
Access®Unicel (Beckman Coulter, USA) using a
chemiluminescent immunoassay (EIA).
Statistical Analysis
Pearson correlations were performed to explain the associations among variables. Variables that were significantly associated with the dependent variables on Pearson analyses were evaluated in the linear regression models. A linear regression analysis was used to summarize and study relationships between variables. Statistical analysis was performed using Eviews (v.11, USA). One-way ANOVA and post-hoc Tukey were also performed to investigate the relationship between PTH, ALP, and insulin resistance.
Statistical analysis was performed according to obesity (BMI>29), insulin resistance (HOMA<2.7 or HOMA>5.5), or parathormone level (15<PTH< 65 pg/ml or PTH>65 pg/ml).
RESULTS
General characteristics of participants are presented in
Table 1. On average, participants had high body mass index
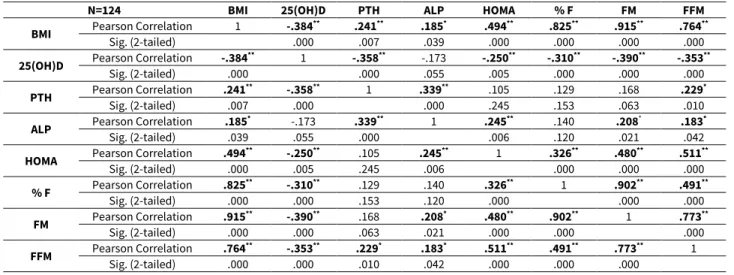
(40±8 kg/m2). They were divided into three groups: 2.41 % overweight (Class I obesity), 51.6 % Class II obese, 48.4 % Class III. Average serum vitamin 25(OH)D levels were 13.26 ± 5.63 ng/mL and all subjects had vitamin D insufficiency. PTH levels were 53.35±20.89 pg/mL with 40% of them were at the maximum level (65 pg/ml). Average ALP level was 77.23±19.70 U/L. HOMA was 4.45±2.81 while 25 % of patients did not have insulin resistance. Association between Vitamin D, PTH, Ca, ALP, HOMA, F %, FM, FFM, and BMI are shown in Table 2. BMI was inversely correlated with Vitamin D insufficiency and significantly associated with PTH, ALP, HOMA, F %, FM, and FFM, while Vitamin D was not associated with ALP.
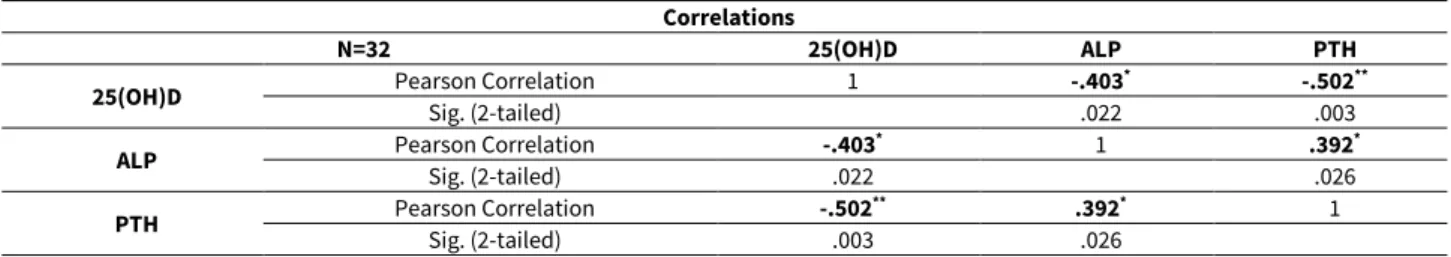
Association between vitamin D insufficiency and PTH and ALP was further analyzed by stratifying the insulin resistance group (Tables 3 and 4). There was no significant correlation among Vitamin D, ALP, and PTH in non-insulin resistance group (data not shown). On the contrary, there was a significant correlation among Vitamin D, ALP, and PTH (Table 3) in the insulin resistance group. However, this was not significant in the regression analysis (Table 4). No significant difference was observed between ALP levels in patients with or without insulin resistance, while a significant decrease was seen in Vitamin D levels (p<0.01) and an elevation in PTH levels (p<0.05) (Figure 1). Concomitant with PTH, there was a significant (p<0.001) increase in FM and FFM (Figure 2).
When the study group was classified according to PTH levels (15<PTH< 65 pg/ml or PTH>65 pg/ml) a significant increase in ALP levels (p<0.05) and a significant decrease in Vitamin D levels (p<0.001) (Figure 3) was observed.
Table 1. General Characteristics of Study Population (N=124)
Age BMI 25(OH)D PTH ALP HOMA F % FM FFM
Mean 35.942 39.471 13.266 53.359 77.235 4.445 44.131 46.0389 56.526
Median 38.000 37.500 11.900 49.100 75.420 3.550 43.600 44.200 55.300
Mode 18.000 30.3 10.300 27.500a 59.000a 1.7a 43.600 56.200 49.300
Sum 4456.89 4894.4 1645.01 6616.55 9577.26 551.2 5472.24 5708.82 7009.332
a. Multiple modes exist. The smallest value is shown
Table 2. Correlation among variables (Overall)
N=124 BMI 25(OH)D PTH ALP HOMA % F FM FFM
BMI Pearson Correlation Sig. (2-tailed) 1 -.384.000 ** .241.007 ** .185.039 * .494.000 ** .825.000 ** .915.000 ** .764.000 **
25(OH)D Pearson Correlation Sig. (2-tailed) -.384.000 ** 1 -.358.000 ** -.173 .055 -.250.005 ** -.310.000 ** -.390.000 ** -.353.000 **
PTH Pearson Correlation Sig. (2-tailed) .241.007 ** -.358.000 ** 1 .339.000 ** .245 .105 .153 .129 .063 .168 .229.010 *
ALP Pearson Correlation Sig. (2-tailed) .185.039 * -.173 .055 .339.000 ** 1 .245.006 ** .140 .120 .208.021 * .183.042 *
HOMA Pearson Correlation Sig. (2-tailed) .494.000 ** -.250.005 ** .105 .245 .245.006 ** 1 .326.000 ** .480.000 ** .511.000 **
% F Pearson Correlation Sig. (2-tailed) .825.000 ** -.310.000 ** .129 .153 .140 .120 .326.000 ** 1 .902.000 ** .491.000 **
FM Pearson Correlation Sig. (2-tailed) .915.000 ** -.390.000 ** .168 .063 .208.021 * .480.000 ** .902.000 ** 1 .773.000 **
DISCUSSION
We conducted a cross-sectional study to investigate the association between vitamin D insufficiency and insulin, PTH, ALP, and obesity among Turkish adult women aged 18-51 years using integrated data from Pendik Education and Research
Hospital Sports Physiology Clinics. Similar to the previous reports (12,13), our results revealed a significant inverse relation between Vitamin D and obesity. On the other hand, we determined that there was no association between serum vitamin D and ALP levels before and after adjustment for IR based on HOMA.
Table 3. Correlation among variables (Insulin resistance +)
Correlations
N=32 25(OH)D ALP PTH
25(OH)D Pearson Correlation Sig. (2-tailed) 1 -.403.022 * -.502.003 **
ALP Pearson Correlation Sig. (2-tailed) -.403.022 * 1 .392.026 *
PTH Pearson Correlation Sig. (2-tailed) -.502.003 ** .392.026 * 1
*. Correlation is significant at the 0.05 level (2-tailed). **. Correlation is significant at the 0.01 level (2-tailed).
Table 4. Linear regression analysis among variables (Insulin resistance +)
Model Summary
Model R R Square Adjusted R Square Std. Error of the Estimate
1 .403a .163 .135 4.683673757853097
a. Predictors: (Constant). ALP
Model R R Square Adjusted R Square Std. Error of the Estimate
2 .502a .252 .227 4.425881320297497
a. Predictors: (Constant), PTH
Figure 1. Variation between groups (Vitamin D, PTH, ALP). *p<0.05 and **p<0.01.
Prevalence of vitamin D deficiency is variable. A meta-analytic study revealed a correlation between obesity and vitamin D deficiency is stronger in the Asian population than in the European-American population. Furthermore, it is also related to skin color, clothing style, regional differences (14-16). A Turkish study showed that vitamin D levels were low in 66.6% of women of reproductive age in Istanbul (17) and it was 93% in the entire female population (18).
However, several studies have pointed out an inverse association between vitamin D deficiency and obesity, it is still unclear whether low vitamin D status is responsible for the development of obesity or whether obesity causes vitamin D deficiency. There is a meta-analytic study also showed a weak correlation between serum 25(OH) D levels and BMI in the adult population (19).
Additionally, previous experiments suggested that reduction in Vitamin D levels may lead to greater adiposity by stimulating parathormone levels and overflow of calcium into adipocytes, thereby increasing lipogenesis (20). Concomitant to these findings, we find a significant inverse association with Vitamin D and FM, FFM, and F %.
Several reports also showed a significant elevation in the serum ALP level in obese individuals (21-23). It is known that ALP is expressed in the adipose tissue (24). Controversially to previous reports, our results suggested that association among FM, FFM, F %, and ALP is not sufficient. Similar to our findings, a study revealed no direct relation of vitamin D deficiency with ALP (15), and another study also pointed out Vitamin D concentrations were not related to ALP in drug-naïve individuals without liver disease (25).Besides, there was also no significant cross-sectional association between 25(OH)D and bone turnover markers (26).
Overall, this study has several limitations. First of all, we could not exclude the possibility of residual confounding factors like sun exposure on 25(OH)D levels, bone diseases, non-alcoholic fatty liver disease. Second, we identified the association between Vitamin D, ALP, PTH, and insulin resistance. However, due to the nature of a cross-sectional study, we had problems in identifying causal relationships between exposure and outcome. Therefore, well-designed studies, more homogenous study populations, and clinical trials, are needed to confirm this causality.
CONCLUSION
In conclusion, prevalence of vitamin D insufficiency or deficiency among adult women is considerably high, and the serum 25(OH)D levels of these women are inversely associated with HOMA and BMI similar to previous reports. Parallel to vitamin D, PTH is associated with vitamin D insufficiency but ALP does not show a direct relationship with insulin resistance. Elevation in ALP levels may be a response to PTH. Further investigations in large populations are required to understand the relationship between insulin resistance and ALP.
REFERENCES
1. Lips P. Vitamin D physiology. Progress in Biophysics and Molecular Biology 2006;92(1):4-8. https://doi.org/10.1016/ j.pbiomolbio.2006.02.016 PMid:16563471
2. Walsh JS, Bowles S, Evans AL. Vitamin D in obesity. Current Opinion in Endocrinology, Diabetes and Obesity 2017;24(6):389-94. https://doi.org/10.1097/MED.00000000 00000371 PMid:28915134
3. Feldman D, Pike JW, Glorieux FH. Vitamin D second ed. 2005; Elsevier, Academic Press, London, San Diego. 4. Suzuki U, Yoshimura K, Takashi M. Uber ein enzyme ―
phytase ‖ das anhydro-oxy-methylen-diphosphorsaure spaltet. Bull Coll Agri Tokyo Imp Univ. 1907;7:503-12. 5. Epstein E, Kiechle FL, Artiss JD, Zak B. The clinical use of
alkaline phosphatase enzymes. Clin Lab Med. 1986;6:491-505. https://doi.org/10.1016/S0272-2712(18)30795-9 6. Rodan GA, Rodan SB. In: Advances in bone and mineral
research annual II. Peck WA, editor. Amsterdam: Excerpta Medica 1984:244-85.
7. Preussner HT. Detecting coeliac disease in your patients. Am Fam Physician. 1998;57:1023-34.
8. Lange PH, Millan JL, Stigbrand T, Vessella RL, Ruoslahti E, Fishman WH. Placental alkaline phosphatase as a tumor marker for seminoma. Cancer Res. 1982;42:3244-7. 9. Schiele F, Vincent-Viry M, Fournier B, Starck M, Siest G.
Biological effects of eleven combined oral contraceptives on serum triglycerides, gamma-glutamyltransferase, alkaline phosphatase, bilirubin and other biochemical variables. Clin Chem Lab Med. 1998;36:871-8. https://doi.org/10.1515/CCLM.1998.153 PMid:9877094 10. Sharma U, Pal D, Prasad R. Alkaline phosphatase: an
overview. Indian J Clin Biochem. 2014;29(3):269-78. https://doi.org/10.1007/s12291-013-0408-y PMid:24966474 PMCid:PMC4062654
11. Couttenye MM, D’Haese PC, Van Hoof VO, Lemoniatou E, Goodman W, Verpooten GA, De Broe ME. Low serum levels of alkaline phosphatase of bone origin: a good marker of adynamic bone disease in haemodialysis patients, Nephrology Dialysis Transplantation 1996;11:6:1065-72. https://doi.org/10.1093/oxfordjournals.ndt.a027457 12. Kremer R, Campbell PP, Reinhardt T, Gilsanz V. Vitamin D
status and its relationship to body fat, final height, and peak bone mass in young women. J. Clin. Endocrinol. Metab. 2009;94:67-73. https://doi.org/10.1210/jc.2008-1575 PMid:18984659 PMCid:PMC2630864
13. Dong Y, Pollock N, Stallmann-Jorgensen IS, Gutin B, et al. Low 25-hydroxyvitamin D levels in adolescents: Race, season, adiposity, physical activity, and fitness. Pediatrics 2010;125:1104-11. https://doi.org/10.1542/peds.2009-2055 PMid:20439594 PMCid:PMC3935324
14. Yao Y, Zhu L, He L, et al. A meta-analysis of the relationship between vitamin D deficiency and obesity. Int J Clin Exp Med. 2015;8(9):14977-84.
15. Saqib MAN, Rafique I, Hayder I, Irshad R, Bashir S, Ullah R, Awan NJ. Comparison of vitamin D levels with bone density, calcium, phosphate and alkaline phosphatase — an insight from major cities of Pakistan. Journal of the Pakistan Medical Association 2018;68(4):543-7.
16. Alpdemir M, Alpdemir MF. Vitamin D deficiency status in Turkey: A meta-analysis. Int J Med Biochem 2019;2(3):118-31. https://doi.org/10.14744/ijmb.2019.04127
17. Alagol F, Shihadeh Y, Boztepe H, Azizlerli H, Sandalci O. Sunlight exposure and vitamin D deficiency in Turkish
women. J Endocrinol Invest 2000;23:173-7.
18. Satman I, Ozbey N, Boztepe H, Kalaca S, Omer B, Tanakol R, Tutuncu Y, Genc S & Alagol F. Prevalence and correlates of vitamin D deficiency in Turkish adults Endocrine Abstracts 2013;32:135. https://doi.org/10.1530/endoabs. 32.P135
19. Saneei P, Salehi-Abargouei A, Esmaillzadeh A. Serum 25-hydroxy vitamin D levels in relation to body mass index: a systematic review and meta-analysis. Obes Rev. 2013;14:393-404. https://doi.org/10.1111/obr.12016 PMid: 23331724
20. Hjelmesaeth J, Hofso D, Aasheim ET, Jenssen T, Moan J, Hager H, Roislien J, Bollerslev J. Parathyroid hormone, but not vitamin D, is associated with the metabolic syndrome in morbidly obese women and men: a cross-sectional study. Cardiovasc Diabetol. 2009;8:7. https://doi.org/ 10.1186/1475-2840-8-7 PMid:19187564 PMCid:PMC2644287 21. Ali AT, Paiker JE, Crowther NJ. The relationship between anthropometry and serum concentrations of alkaline phosphatase isoenzymes, liver enzymes, albumin, and bilirubin. Am J Clin Pathol. 2006;126:437-42. https://doi.org /10.1309/9N346GXX67B6PX5W PMid:16880138
22. Al-Sultan AI. Assessment of the relationship of enzymes with obesity and insulin resistance in adults in Saudi arabia. Sultan Qaboos Univ Med J. 2008;8:185-92.
23. Khan AR, Awan FR, Najam SS, Islam M, Siddique T, Zain M. Elevated serum level of human alkaline phosphatase in obesity J Pak Med Assoc. 2015;65(11):1182-5.
24. Ali AT, FerrisWF, Penny CB, Van derMerweM-T, Jacobson BF, Paiker JE, et al. Lipid accumulation and alkaline phosphatase activity in human preadipocytes isolated from different body fat depots. J Endocrinol Metabol Diabetes SA 2013;18:58-64. https://doi.org/10.1080/ 22201009.2013.10872304
25. Naderpoor N, Mousa A, de Courten M, Scragg R, de Courten B. The relationship between 25-hydroxyvitamin D concentration and liver enzymes in overweight or obese adults: Cross-sectional and interventional outcomes. The Journal of Steroid Biochemistry and Molecular Biology 2018;177:193-9. https://doi.org/10.1016/j.jsbmb.2017.09. 009 PMid:28899715
26. Schwetz V, Trummer C, Pandis M, et al. Effects of Vitamin D Supplementation on Bone Turnover Markers: A Randomized Controlled Trial. Nutrients. 2017;9(5):432. https://doi.org/10.3390/nu9050432 PMid:28448457 PMCid:PMC5452162