Tar. Bil. Der.
Dergi web sayfası: www.agri.ankara.edu.tr/dergi
Journal homepage: www.agri.ankara.edu.tr/journal
Multivariate Multiple Regression Analysis Based on Principal
Component Scores to Study Relationships between Some
Pre- and Post-slaughter Traits of Broilers
Mehmet MENDEŞa
a
Canakkale Onsekiz Mart University, Faculty of Agriculture, Department of Animal Science, 17020, Çanakkale, TURKEY
ARTICLE INFO
Research Article Biometrics
Corresponding author: Mehmet MENDEŞ, e-mail: [email protected], Tel: +90(286) 213 83 92 Received: 03 February 2009, Received in revised form: 16 February 2011, Accepted: 30 March 2011
ABSTRACT
The main purpose of this study is to show that how can we use multivariate multiple linear regression analysis (MMLR) based on principal component scores to investigate relations between two data sets (i.e.pre- and post-slaughter traits of Ross 308 broiler chickens). Principal component analysis (PCA) was applied to predictor variables to avoid multicolinearity problem. According to results of the PCA, out of 7 principal components only the first three components (PC1, PC2, and PC3) with eigenvalue greater than 1 were selected (explained 89.45 % of the variation) for MMLR analysis. Then, the first three principal component scores were used as predictor variables in MMLR. The results of MMLR analysis showed that shank width, breast circumference and body weight had a similar linear effect on predicting the post-slaughter traits (P=0.746). As a result, since the animals had high value of shank width, breast circumference and body weight, it might be probable that their post-slaughter traits namely heart weight, liver weight, gizzard weight and hot carcass weight were also expected to be high.
Keywords: Multivariate regression analysis; Principal component analysis; Canonical correlation; Prediction
Etlik Piliçlerde Kesim Öncesi ve Kesim Sonrası Bazı Özellikler
Arasındaki Đlişkilerin Temel Bileşenler Skorları Üzerinden
Uygulanan Çok Değişkenli Çoklu Regresyon Analizi ile Araştırılması
ESER BĐLGĐSĐAraştırma Makalesi Biyometri
Sorumlu Yazar: Mehmet MENDEŞ, e-posta: [email protected], Tel: +90(286) 213 83 92 Geliş tarihi: 03 Şubat 2009, Düzeltmelerin gelişi: 16 Şubat 2011, Kabul: 30 Mart 2011
ÖZET
Bu çalışmanın amacı, temel bilesenler skorları üzerinden uygulanan çok değişkenli çoklu doğrusal regresyon analizinin (MMLR) iki değişken seti arasındaki ilişkilerin araştırılmasında nasıl kullanılabileceğini göstermektir. Bu amaçla Ross 308 hattından etlik piliçlere ilişkin bazı kesim öncesi ve sonrası özellikler kullanılmıştır. Temel Bileşenler Analizi (PCA), bağımsız değişkenler arasındaki çoklu bağlantı problemini gidermek için kullanılmıştır. Yapılan PCA sonucunda 7 komponentten öz değeri 1’den büyük olan 3 temel bileşene ilişkin skorlar MMLR’de
T
A
R
IM
B
İL
İM
LE
R
İ
D
E
R
G
İS
İ
J
O
U
R
N
A
L
O
F
A
G
R
IC
U
LT
U
R
A
L
S
C
IE
N
C
E
S
17 ( 20 11 ) 77 -8 3
açıklayabilmiştir. MMLR analiz sonucunda incik genişliği, göğüs çevresi ve canlı ağırlığın kesim sonrası özellikleri tahmin etmedeki doğrusal etkilerinin benzer olduğu görülmüştür (P=0.746). Sonuç olarak, kesim öncesinde incik genişliği, göğüs çevresi ve canlı ağırlığı fazla olan hayvanların kesim sonrası özelliklerinin de fazla olmasının beklendiği kanısına varılmıştır.
Anahtar sözcükler: Çok değişkenli çoklu regresyon analizi; Principal komponent analizi; Kanonik korelasyon; Tahmin © Ankara Üniversitesi Ziraat Fakültesi
1. Introduction
Information on the relations between two data or variable sets (i.e. pre- and post-slaughter traits) is quite important (Mendeş et al 2005). In practice, canonical correlation analysis (CCA) is commonly used to investigate the relations between two data sets (Akbaş & Takma 2005; Mendeş & Akkartal 2007; Sousa et al 2007). Multivariate multiple linear regression analysis (MMLR) can also be used for this objective (Lutz & Eckert 1994). In animal science, however, there are no studies in literature using MMLR. The MMLR is one of the alternatives of CCA. Thus, it will be useful to show how MMLR can be used in investigating relations between two data sets.
Both CCA and MMLR techniques are highly affected from high correlations (multicollinearity problem) between predictor variables (Sharma 1996; Baldava 2004).
It is well known that in the presence of multicollinearity problem, the standard errors of the parameter estimates could be quite high, resulting in unstable estimates of the regression model. Hence, the multicollinearity between predictor variables can lead to incorrect identification of the
most important predictors (Sharma 1996;
Thompson et al 2001; Hoe & Kim 2004). Previously, some researchers (Sharma 1996; Çamdeviren et al 2005; Sousa et al 2007; Mendeş 2009) reported that one of the approaches to avoid this problem is the principal component analysis. Recently, the usage of principal component analysis (PCA) to avoid multicollinearity problem began to increase with the availability of related statistical package programs such as SAS, Statistica, SPSS and NCSS (Fievez et al 2003; Liu et al 2004; Raick et al 2006; Posta et al 2007).
The main purpose of this study is to show that how can we use multivariate multiple linear regression analysis (MMLR) based on principal
component scores to investigate relations between two data sets (i.e.pre- and post-slaughter traits of Ross 308 broiler chickens).
2. Materials and Methods
2.1. MaterialsA total of 51 broiler male Ross 308 broiler chickens were used. The following pre-slaughter traits were measured when the birds were six weeks old: body weight (BW,g), shank width (SHW, mm), shank length (SHL, mm), breast bone length (BBL, mm), breast width (BRW, mm), breast circumference (BRC, cm) and body length (BL, cm). The birds
were slaughtered at 6th week of the investigation.
The post-slaughter traits were: hot carcass weight (HCW, g), heart weight (HW, g), liver weight (LW, g) and gizzard weight (GW, g).
2.2. Multivariate Multiple Linear Regression Analysis (MMLR)
Multivariate multiple linear regression analysis (MMLR) was used to investigate the relations between pre- and post-slaughter traits of broiler chickens. Like CCA, MMLR analysis enables us to investigate the relations between two data sets (Baldava 2004; Akkartal et al 2009). In this study, the first data set formed by pre-slaughter traits (independent or predictor variables) and the second data set formed by post-slaughter traits (dependent variables). MMLR is similar to multiple linear regression analysis (MLR). However, the numbers of dependent variables are more than one in MMLR. Computationally, MMLR gives the same coefficients, standard errors, t-and p-values and confidence intervals as one would estimate with individual MLR computations for each of the dependent variables separately (Breiman & Friedman 1997; Baldava 2004). However, since numbers of dependent variables are more than one and the dependent variables are correlated in
general, the using of MMLR instead of MLR would be more appropriate in investigating relations between two data sets (Goldwasser & Fitzmaurice 2006). The hypothesis being tested by a multivariate regression is that there is a joint linear effect of the set of independent variables on the set of dependent variables. Hence, the null hypothesis is that slope of all coefficients is simultaneously zero.
In MMLR, q dependent variables (Y1, Y2,…,
Yq) are to be predicted by linear relationships with r
independent variables (X1, X2,…, Xr). That is, we
are interested in how the set of dependent variables relate to the independent variables. Therefore, the statistical model for the MMLR is:
nxq E 1)xm (r B 1) nx(r X nxq Y = + + + (1)
where Y represents n observations of a q-dependent variable, X represents the design matrix of rank r+1 with its first column being the vector 1, B is a matrix of parameters to be estimated and E represents the matrix of residuals (Monge 1977; Lutz & Eckert 1994; Khattree & Naik 1999; Keskin et al 2008).
In practice, MMLR include a large number of independent (predictor) variables (X’s) where some of them might be slightly correlated with the dependent variables (Y’s) or may be redundant because of high correlations (multicollinearity problem) with other independent variables. The use of redundant predictors can be harmful since potential gain in accuracy attributable to their inclusion is outweighed by inaccuracies associated with estimating their proper contribution to the prediction (Spark et al 1985). Especially, in the presence of multicollinearity among the column of X can have significant impacts on the quality and stability of the fitted model (Johnson 1991). One approach to avoid this problem is PCA.
2.3. Principal Component Analysis (PCA)
PCA is an appropriate multivariate technique to reduce the dimension of a data set consisting of a large number of interrelated variables, while retaining as much as possible of the variation present in the data set (Sharma 1996; Özkan &
Mendeş 2004). This is achieved by transforming set of original variables to a new set of variables, the principal components (PCs), and which are ordered so that the first few retain most of the variation present in all of the original variables (Joliffe 2002). Since detailed information about PCA was given by Johnson & Wichern (1982), Sharma (1996) and Tabachnick & Fidell (2001), we did not give any further information about PCA. The basic equation of PCA is, in matrix notation, given by following equation:
Y=W’X (2)
where X is the matrix which contains p original variables and W is the matrix of weights which
contains standardized weights (wij) of the each
variable in PCs. The magnitudes of the coefficients give the contributions of each variable to that component.
The units of the variables could have an effect on PCA. Due to differences in the units of variables used in PCA, correlation matrix of variables (C) was used to get eigenvalues and weight of variables.
Bartlett’s sphericity test is used to test the null hypothesis that the correlation matrix is an identity matrix or all correlations are zero. In other words, the applicability of PCA is determined based on Bartlett’s sphericity test result. Therefore, the applicability of PCA was tested by Bartlett’s sphericity test. The formula for computing this test is: C e log 6 6n) 2p (11 2 χ = + − (3)
where p is the number of components, n is the number of observations in the sample and C is the correlation matrix.
In this study, we used only three PCs with eigenvalue greater than 1 out of 7 PCs (Kaiser 1960). Therefore, only score values of first three selected PCs were considered. Coefficient of
determination (R2), Durbin-Watson statistic (DW)
and residual mean square error (RMSE) were used as goodness-of-fit criteria. SAS V8 (SAS Institute Inc., 1999) and NCSS (Hintze 2001) statistical package programs were used in the statistical analyses.
3. Results and Discussion
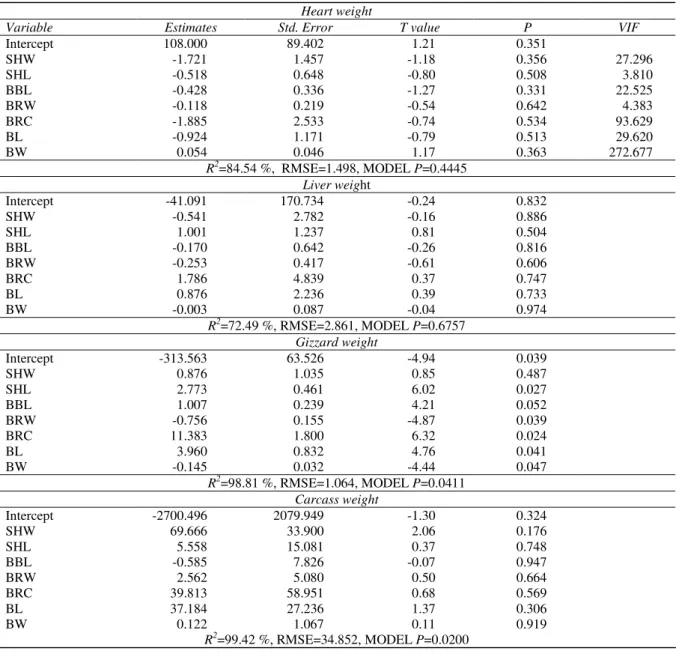
It has observed that when the raw data of the study were used for the multivariate multiple linear regression analysis (MMLR), a multicollinearity problem had existed with high values of variance inflation factor (VIF>10.0; Table 1). Johnson (1991) and Sharma (1996) reported that the prediction of dependent variable(s) in the regression
analysis was highly affected from the
multicollinearity problem between the independent variables. It is well known that in the presence of multicollinearity, the standard errors of the parameter estimates could be quite high, resulting in unstable estimates of the regression model. In this case, using the MMLR analysis to investigate the relationships between two data sets can not be gave reliable results.
Sharma (1996) and Sousa et al (2007) informed that one of the approaches to avoid this problem
was principal component analysis (PCA).
Therefore, principal component scores were used as independent variables in MMLR model to avoid multicollinearity problem and get more reliable parameter estimates. Results of PCA are given in Tables 2, 3 & 4.
Firstly, Bartlett’s sphericity test for testing all correlations are zero or for testing the null hypothesis that the correlation matrix is an identity matrix was used to verify the applicability of PCA. The value of Bartlett’s sphericity test was found to be as 50.77 and it implied that the PCA is applicable to our data set (P=0.000). In principal component analysis, one of the most commonly used criteria for solving the number-of-components problem is the eigenvalue-one criterion, also known as the Kaiser criterion (Kaiser 1960). With this approach, we retain and interpret any component with an eigenvalue greater than one. According to the results of PCA (Table 2), out of 7 principal components only first three principal components (PC1, PC2, PC3) with eigenvalue greater than one were selected for MMLR analysis. Because eigenvalues represent variances and that each standardized variable contributes to principal component extraction is one, a component with the eigenvalue less than one is not as significant. Thus, the first three principal components provide
adequate information of the data for most purposes. The first three principal components explained 89.45 % of the variation (Table 2). The first principal component (PC1) is a measure of SHW, BRC and BW while the second principal component (PC2) is a measure of SHL and BRW and the third principal component (PC3) is a measure of BBL and BL across the birds. The PC1 accounts for 43.00 % of the total variance while the PC2 and PC3 account for 25.22 % and 21.24 % of total variance, respectively.
Communality values of variables (Table 3) were also found to be high in SHW (94.6 %), SHL (78.5 %), BBL (87.2 %), BRC (80.4%), BRW (96.0 %), BL (90.6%) and BW (98.9 %) selected principal component scores. The highest values of communalities indicate that the variances of variables were efficiently reflected by variables in MMLR analysis. Therefore, only the first three principal components were appropriate for explain variations in 7 pre-slaughter traits.
Loadings, the simple correlations between the original and new variables, give an indication of the extent to which the original variables are influential or important in forming new variables (Sharma 1996) are given in Table 3. The bold market loads indicate the highest existing correlation between variables and the selected components (the higher loading the more influential variable in forming the principal component scores). As can be seen from Table 3, SHW, BRC and BW traits have the highest correlations with the PC1. PC1 or score 1 had a positive impact on heart weight (HW), liver weight (LW), gizzard weight (GW) and hot carcass weight (HCW) of birds and 91.63 % of variation in these post-slaughter traits could be explained by the first scores (Table 4).
Multivariate multiple linear regression analysis results based on PC scores showed that the overall model was statistically significant (Wilks’ Lambda=0.00754; P=0.0351). Therefore, MMLR model based on principal component scores for investigate the relations between pre- and post-slaughter traits can be written as:
(HW+LW+GW+HCW)=0.95725PC1+0.12509PC2 -0.16849PC3
Table 1-Multivariate multiple linear regression analyses results based on raw data
Çizelge 1-Ham veriler üzerinden elde edilen çokdeğişkenli çoklu doğrusal regresyon analizi sonuçları
Table 2-Eigenvalues, individual and cumulative %
Çizelge 2-Özdeğerler, bireysel ve kümülatif %
Principal components Eigenvalue Individual, % Cumulative, %
1 3.009 43.00 43.00 2 1.765 25.22 68.21 3 1.486 21.24 89.45 4 0.429 6.14 95.59 5 0.199 2.85 98.44 6 0.106 1.53 99.97 7 0.002 0.30 100.00 Heart weight
Variable Estimates Std. Error T value P VIF
Intercept 108.000 89.402 1.21 0.351 SHW -1.721 1.457 -1.18 0.356 27.296 SHL -0.518 0.648 -0.80 0.508 3.810 BBL -0.428 0.336 -1.27 0.331 22.525 BRW -0.118 0.219 -0.54 0.642 4.383 BRC -1.885 2.533 -0.74 0.534 93.629 BL -0.924 1.171 -0.79 0.513 29.620 BW 0.054 0.046 1.17 0.363 272.677 R2=84.54 %, RMSE=1.498, MODEL P=0.4445 Liver weight Intercept -41.091 170.734 -0.24 0.832 SHW -0.541 2.782 -0.16 0.886 SHL 1.001 1.237 0.81 0.504 BBL -0.170 0.642 -0.26 0.816 BRW -0.253 0.417 -0.61 0.606 BRC 1.786 4.839 0.37 0.747 BL 0.876 2.236 0.39 0.733 BW -0.003 0.087 -0.04 0.974 R2=72.49 %, RMSE=2.861, MODEL P=0.6757 Gizzard weight Intercept -313.563 63.526 -4.94 0.039 SHW 0.876 1.035 0.85 0.487 SHL 2.773 0.461 6.02 0.027 BBL 1.007 0.239 4.21 0.052 BRW -0.756 0.155 -4.87 0.039 BRC 11.383 1.800 6.32 0.024 BL 3.960 0.832 4.76 0.041 BW -0.145 0.032 -4.44 0.047 R2=98.81 %, RMSE=1.064, MODEL P=0.0411 Carcass weight Intercept -2700.496 2079.949 -1.30 0.324 SHW 69.666 33.900 2.06 0.176 SHL 5.558 15.081 0.37 0.748 BBL -0.585 7.826 -0.07 0.947 BRW 2.562 5.080 0.50 0.664 BRC 39.813 58.951 0.68 0.569 BL 37.184 27.236 1.37 0.306 BW 0.122 1.067 0.11 0.919 R2=99.42 %, RMSE=34.852, MODEL P=0.0200
Table 3-Principal component coefficients, loadings and final communalities
Çizelge 3-Temel bileşen katsayıları, yükler ve son communalitiler
Standardized coefficients Loadings after varimax rotation Variable PC1 PC2 PC3 PC1 PC2 PC3 Communality SHW 0.412 -0.094 -0.530 0.868 0.223 -0.137 0.946 SHL 0.185 -0.622 0.011 0.033 0.229 0.127 0.785 BBL 0.477 -0.178 0.295 0.328 -0.012 0.486 0.872 BRW 0.079 0.580 0.357 0.062 -0.965 0.132 0.804 BRC 0.385 0.472 -0.283 0.892 -0.306 -0.029 0.960 BL 0.298 -0.092 0.647 0.004 -0.141 0.957 0.906 BW 0.569 0.068 -0.064 0.849 -0.054 0.373 0.989
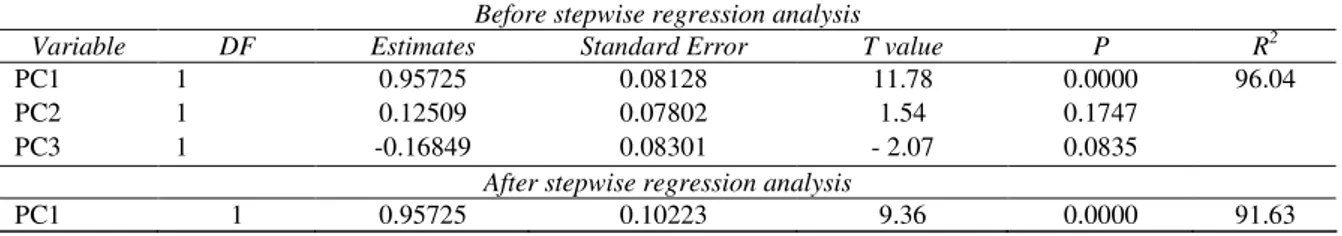
Table 4-Multivariate multiple linear regression analysis results based on PCs scores
Çizelge 4-Temel bileşen skorları üzerinden elde edilen çokdeğişkenli çoklu doğrusal regresyon analizi sonuçları Before stepwise regression analysis
Variable DF Estimates Standard Error T value P R2
PC1 1 0.95725 0.08128 11.78 0.0000 96.04
PC2 1 0.12509 0.07802 1.54 0.1747
PC3 1 -0.16849 0.08301 - 2.07 0.0835
After stepwise regression analysis
PC1 1 0.95725 0.10223 9.36 0.0000 91.63
Stepwise regression analysis was made to determine which PCs contributed to the variation in the dependent (post-slaughters) variables set. The stepwise regression analysis revealed that only PC1, which was composed of SHW, BRC and BW, contributed the most. Hence, the final MMLR model can be written as:
HW+LW+GW+HCW)=0.95725PC1
with a value for R2 of 91.63%.
Results of MMLR analysis show that SHW, BRC and BW have a similar linear effect on predicting the post-slaughter traits (P=0.746). The loading of SHW (0.868), BRC (0.892) and BW (0.849) found to be also similar to each other. These results suggest that these three pre-slaughter traits namely SHW, BRC and BW vary together. Hence, since the animals had high value of SHW, BRC and BW, it may be probable that their post-slaughter traits namely HW, LW, GW and HCW (especially HCW and HW) were also expected to be high. SHW, BRC and BW account for 91.63 % of the total variance in post-slaughter traits.
4. Conclusion
Multivariate multiple linear regression analysis can be a useful way of demonstrating the relationships between two variable sets in animal based studies as well as in other areas of research. In view of these results, it possible to suggest that the most important pre-slaughter traits influencing the changes in the post-slaughter traits (especially in heart weight and hot carcass weight) were shank width, breast circumference and body weight. On the other hand, changes in shank width, breast circumference and body weight contributed more to changes in heart weight and hot carcass weight rather than changes in liver weight and gizzard weight.
References
Akbaş Y & Takma Ç (2005). Canonical correlation analysis for studying the relationship between egg production traits and body weight, egg weight and age at sexual maturity in layers. Czech Journal of Animal Science 50(4): 163-168
Akkartal E, Mendeş M & Kursun I (2009). Multivariate analysis of the relations between some blood biochemistry parameters, morphological characters and tonic immobility in broiler. Asian Journal of Chemistry 21(4):2869-2874
Baldava S (2004). Seismic performance prediction of steel structures using multiple intensity measures. The University of Texas at Austin. Master thesis Breiman L & Friedman J H (1997). Predicting
multivariate responses in multiple linear regression. Journal of the Royal Statistical Society 59(1): 3-54 Çamdeviren H, Demir N, Kanik A & Keskin S (2005).
Use of principal component scores in multiple linear regression models for prediction of Cholophyll-a in reservoirs. Ecological Modelling 181:581-589 Fievez V, Vlaeminck B, Dhanoa M S & Dewhurst R J
(2003). Use of principal component analysis to investigate the origin of heptadecenoic and conjugated linoleic acids in milk. Journal of Dairy Science 86: 4047-4053
Goldwasser M A & Fitzmaurice G M (2006). Multivariate linear regression analysis of childhood psychopathology using multiple informant data. Internatioanl Journal of Methods in Psychiatric Research 10(1):1-10
Hintze J (2001). NCSS and PASS Number cruncher statistical systems. Kaysville, Utah. www. NCSS.com Hoe J S & Kim D S (2004). A new method of ozone forecasting using fuzzy expert and neural network systems. Science of the Total Environment 325:221-237
Joliffe I (2002). Principal Component Analysis, 2nd ed., Springer
Johnson J D (1991). Applied Multivariate Data Analysis. Springer-Verlag New York, USA
Johnson R A & Wichern D W (1982). Applied Multivariate Statistical Analysis (5th edition). Upper Saddle River, NJ: Prentice Hall
Kaiser H F (1960). The application of electronic computers to factor analysis. Educational and
Psychological Measurement 20:141-151
Keskin S, Boysan M & Göktaş I (2008). Mükemmeliyetçilik ve obsesif kompülsif semptomlar arası ilişki için çok değişkenli analiz yaklaşımı. Türkiye Klinikleri Tıp Bilimleri Dergisi 28:319-326
Khattree R & Naik D N (1999). Applied Multivariate Statistics with SAS Software. 2nd ed.Cary NC: SAS Institute Inc
Liu Y, Lyon B G, Windham W R, Lyon C E & Savage E M (2004). Principal component analysis of physical, color and sensory characteristic of chicken breast deboned at two, four, six and twenty-four hours
postmorten. Poultry Science 83: 101-108
Lutz J G & Eckert T L (1994). The relationship between canonical correlation analysis and multivariate multiple regression. Educational and Psychological Measurement 54(3): 666-675
Mendeş M, Karabayır A, Ersoy I E & Savaş T (2005). The relationship among pre-and post slaughter traits of American Bronze turkey. Archives of Animal Breeding 48(3): 283-289
Mendeş M & Akkartal E (2007). Canonical correlation analysis for studying the relationships between pre- and post slaughter traits of Ross 308 broiler chickens. Archive Gefligelkünde 71(6): 267-271
Mendeş M (2009). Multiple linear regression models based on principal component scores to predict slaughter weight of broilers. Archive Gefligelkünde
73(2):139-144
Monge P R (1977). Multivariate multiple regression in communication research. 80p
Özkan M M & Mendeş M (2004). Empirical table values of Eigen values for different variable numbers and sample size combinations. Pakistan Journal of Biological Sciences 7(6): 870–878
Posta J, Komlosi I & Mihok S (2007). Principal component analysis of performance test traits in Hungarian Sporthorse mares. Archives of Animal Breeding 50: 125-135
Raick C, Beckers J M, Soetaert K & Gregoire M (2006). Can principal component analysis be used to predict the dynamics of a strongly non-linear marine biogeochemical model? Ecological Modelling 196: 345-364
SAS (1999). SAS OnlineDoc , Version 8, Cary, NC., USA
Sharma S (1996). Applied multivariate techniques. John Wiley & Sons, Inc., Canada
Spark R S, Zucchini W & Coutsourides D (1985). On variable selection in multivariate regression. Communications in Statistics - Theory and Methods
14(7):1569-1587
Sousa S IV, Martins F G, Alvim-Ferraz M C M & Pereira M C (2007). Multiple linear regression and artificial neural Networks based on principal components to predict ozone concentrations. Environmental Modelling & Software 22: 97-103 Tabachnick B G & Fidell L S (2001). Using Multivariate
Statististics. Allyn and Bacon A Pearson Education Company Boston, U.S.A
Thompson M L, Reynolds J, Cox L H, Guttorp P & Sampson P D (2001). A review of statistical methods for the meteorological adjustment of tropospheric ozone. Atmospheric Environment 35: 617-630