Sami Al Kharusi (Oman), Eşref Savaş BAŞCI (Turkey)
Financial institutions performance evaluation in a unique
developing market using TOPSIS approach
Abstract
Using Technique for Order Performance by Similarity to Ideal Solutions (TOPSIS) approach for the data from 2011 to 2015, the authors investigate the financial performance of 16 different financial institutions in Oman that include nine commercial banks, three specialized banks, two investment companies, and two finance companies. They find that the one investment company, Dhofar International Development and Investment Holding Co., was more efficient in 2015 and 2011. Moreover, Oman Housing Bank was more efficient in 2013 and 2014, while Ahli Bank was more efficient in the year 2012. In contrast, Bank Muscat that has the largest total assets was ranked number 16 for the years 2013, 2014 and 2015. As a result of Spearman’s Rho (Rank-Order) Correlation, all ranked results are related to other years. If a bank is at placement in level, it can be affected by year before or year after. But Oman banks’ correlations shows that there are 2 different periods as effecting one year to the other.
Keywords: financial institutions performance, TOPSIS, emerging markets, efficiency, decision making criteria. JEL Classification: G21, G23, L25.
Introduction
The performance evaluation of financial institutions has very important results for investors, creditors and stakeholders. Measuring the banks’, investment and finance companies ability to compete is critical for future sustainability. Their large economic significance highlights the importance of evaluating the financial performance in order to help to improve and monitor their financial conditions. In this paper, we investigate 16 financial institutions: 1) Ahli Bank, 2) Alizz Islamic Bank, 3) Bank Dhofar, 4) Bank Muscat, 5) Bank Nizwa, 6) Bank Sohar, 7) National Bank of Oman, 8) Oman Arab Bank, 9) HSBC Bank Oman, 10) Central Bank of Oman, 11) Oman Development Bank, 12) Oman Housing Bank, 13) Dhofar International Devel-opment & Investment Holding Company, 14) Oman International Development and Investment Company, 15) Muscat Finance Company, 16) United Finance Company. The selected banks represent all national banks in Oman, Central Bank of Oman and two spe-cialized banks. In addition, other investment and fi-nance companies are selected based on their assets size and availability of information. The study is conducted using Technique for Order Performance by Similarity to Ideal Solutions (TOPSIS) approach for a recent period 2011-2015. This is a critical investigation for several reasons. Firstly, the changes in the Omani economy from fuel dependence economy into a more diversified economy. This strategic change means that private sector and banking will play a measure role in
Sami Al Kharusi, Eşref Savaş BAŞCI, 2017.
Sami Al Kharusi, Ph.D., Assistant Professor, Economics and Finance Department, Sultan Qaboos University, Oman.
Eşref Savaş BAŞCI, Ph.D., Faculty of Economics and Administrative Sciences, Banking and Finance Department, Hitit University, Çorum, Turkey.
This is an Open Access article, distributed under the terms of the Crea-tive Commons Attribution 4.0 International license, which permits unrestricted re-use, distribution, and reproduction in any medium, provided the original work is properly cited.
the coming few years. This is known as the triple PPP, which stands for Public and Private Partnership. Sec-ondly, the testing of financial institutions can add value to strategic policy makers in Central Bank of Oman, investors and commercial banks executive manage-ment. The period between 2011 and 2015 is character-ized by a period of both strong economic growth, in-vestment and a decline in oil prices, which effected both government and private sector profitability. This paper makes several contributions. This is the first study that uses TOPSIS approach to measure the financial performance of financial institutions in Oman. Also, this paper examines a critical very recent time frame that combines both increase and decrease of economic activities. Furthermore, this is the first study that combines not only the commer-cial banks, but also specommer-cialized banks, investment companies and finance companies.
This paper is organized as follows. Section 1 provides the literature review. Section 2 describes the data and methodology used to assess the bank branches effec-tiveness, followed by section 3, which summarizes the results and implications. Major conclusions are illus-trated in final section.
1. Literature review
Over the last few decades, there is a growing number of literature on the efficiency and effectiveness of fi-nancial institutions. These large numbers of studies use different methods to measure banks’ and other finan-cial institutions performance. Both parametric and non-parametric techniques have been used as efficiency measures. Murillo-Zamorano (2004) addressed that both techniques have attracted debate and no method is strictly preferable. Some studies use traditional ratio analysis to measure banks’ performance, but conclude that it could be not sufficient (Tozum, 2002). Tradi-tional ratio analysis measures the relationship between two variables to provide some indication about the
performance of financial institutions. Such ratio analy-sis includes profitability, assets quality, capital ade-quacy, risk management and many others. Traditional ratio analysis is easy to understand and simple, how-ever, it only examines part of the units’ activity with-out a comprehensive measure of performance evalua-tion. Furthermore, regression analysis is another com-mon method using input-output analysis to measure financial performance of financial institutions. This method can help to evaluate the influence of multiple independent variables on dependent variable. Other methods include: frontier efficiency, multivariate sta-tistical analysis, balanced scorecard, analytic hierarchy process and gray relation analysis.
Li, Liu, Liu and Whitman (2001) employed nine dif-ferent financial rates to measure the performance of Chinese banks. They identified two reasons for low profitability of state-owned commercial banks com-pared with joint-equity banks. First is the higher ratio for non-interest expenses and second is the lower interest margin. Mercan, Reisman, Yolalan and Emel (2003) documented the effect of financial crisis and the impact of financial liberalization on commercial banks in Turkey using a financial performance index. They used fundamental financial ratios from 1989 to 1999. Staub, Souza and Tabak (2009) studied the efficiency of Brazilian banks during the period 2000 to 2007 using Data Envelopment Analysis (DEA). They conclude that banks in Brazil have low levels of economic efficiency compared European and Ameri-can banks. In addition, they find that state owned banks are more cost efficient compared to foreign and private banks in Brazil. Using similar approach, Data Envelopment Analysis, many studies have found that banking sector is inefficient in different countries (Saha and Ravisankar, 2000; Bhattacharyya, Lovell and Sahay, 1997). Furthermore, Tecles and Tabak (2010) suggested that large banks in Brazil are the most profitable and cost efficient. Both local and foreign banks achieved a good level of performance and improved their efficiency. The study used Bayes-ian stochastic frontier approach for the period be-tween 2000 and 2007.
Another study by Lin and Zhang (2009) found that bank performance measure by profitability, efficiency, and assets quality is better for Chinese banks with foreign acquisition and public listing compared to the big four state owned commercial banks. Ravi, Kurnia-wan, Thai and Kumar (2008) measured the bank fi-nancial performance using soft computing prediction system. The model combined includes multi-layered feed forward neural network trained with back propa-gation and other statistical techniques. Another method to measure the bank performance is the CAMELS evaluation system (Capital adequacy, Assets, Man-agement capabilities, Earnings, Liquidity and Sensitiv-ity) used by Kaya (2001). She conducted her study on
Turkish banking sector between 1998 and 2000. The study concludes that Turkish banks were successful using a set of financial success measurements.
Kraft and Tırtıroğlu (1998) investigated the bank-ing system in Croatia and found that new private banks are not as efficient as the old ones. Hence, they recommended that the government should create a competitive framework to govern the banking system. Mertens and Urga (2001) found that big banks are more efficient in terms of profit, but less efficient than small banks in terms of cost. The study conducted in analyzing the effi-ciency of commercial banks in Ukraine. In Hun-gary, Hasan and Marton (2003) found that domes-tic banks in developed countries experienced higher efficiency than foreign banks.
2. Data and methodology
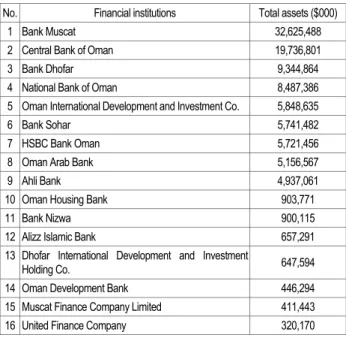
This paper investigates the Oman’s financial insti-tutions between 2011 and 2015. The analysis in-cludes nine local banks: Ahli Bank, Alizz Islamic Bank, Bank Dhofar, Bank Muscat, Bank Nizwa, Bank Sohar, National Bank of Oman, Oman Arab Bank, HSBC Bank Oman, three specialized banks: Central Bank of Oman, Oman Development Bank, Oman Housing Bank, two investment companies: Dhofar International Development and Investment Holding Company, Oman International Develop-ment and InvestDevelop-ment Company, and two finance companies; Muscat Finance Company and United Finance Company. Table 1 lists these financial institutions based on their total assets in US dol-lars for the year 2015.
Table 1. Total assets of financial institutions in Oman
No. Financial institutions Total assets ($000)
1 Bank Muscat 32,625,488
2 Central Bank of Oman 19,736,801
3 Bank Dhofar 9,344,864
4 National Bank of Oman 8,487,386 5 Oman International Development and Investment Co. 5,848,635
6 Bank Sohar 5,741,482
7 HSBC Bank Oman 5,721,456
8 Oman Arab Bank 5,156,567
9 Ahli Bank 4,937,061
10 Oman Housing Bank 903,771
11 Bank Nizwa 900,115
12 Alizz Islamic Bank 657,291 13 Dhofar International Development and Investment
Holding Co. 647,594
14 Oman Development Bank 446,294 15 Muscat Finance Company Limited 411,443 16 United Finance Company 320,170
We used financial and non-financial variables related to financial institutions for TOPSIS method. All variables and information are col-lected and obtained from Bankscope and financial
institutions financial statements, such as their balance sheets, income statements and their offi-cial web-sites.
Table 2. All variables for TOPSIS analysis
Variable Using in TOPSIS Deposits & short term funding Thousand USD Total assets Thousand USD Return on average assets (ROAA) Calculating in % Return on average equity (ROAE) Calculating in % Loan loss res / gross loans Calculating in % Cost to income ratio Calculating in % Number of employees Sum of employees in the year
In this study, we have used Technique for Order Preference by Similarity to Ideal Solution (TOP-SIS). It is called multicriteria decision analysis. It is one of the classical decision making methods. The method was, first, developed by Hwang and Yoon in 1981 and, then, modified by Yoon in 1987. Finally, Lai and Liu has finalized the TOP-SIS method in 1993. This method can be described with concept of chosen alternatives. The alterna-tives are either having a short distance or a long distance from the decision point. These points may include positive or negative ideal solutions from the decision point. The method can calculate the weighted alternatives to determine the standard decision matrix and it includes 6 steps. The follow-ing part illustrates these steps in details.
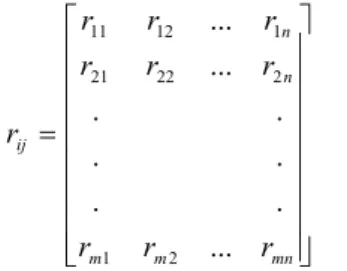
STEP 1: Determination decision matrix
In first step, it is necessary to make decision matrix. In terms of matrix, it has rows that include decision point, which want to be ordered by success criteria and columns refer to evaluation factors that may be used in decision making process.
mn m m n n ij a a a a a a a a a A ... . . . . . . ... ... 2 1 2 22 21 1 12 11 .
In first step,
A
ij matrix m refers to count of decision point, n refers to count of evaluating factor as well.STEP 2: Standard decision matrix
In the Step 2, standard decision matrix can be calcu-lated with using first step’s
A
ij matrix’s components. It can be shown as follows:
m k kj ij ij a a r 1 2 .Once rij matrix is calculated, we make a new
ma-trix that is vector normalization with the new ele-ments like below:
mn m m n n ij r r r r r r r r r r ... . . . . . . ... ... 2 1 2 22 21 1 12 11 .
STEP 3: Weighted standard decision matrix
In this step, we need to know all element’s weight in the matrix. All weighted elements’ sum must be 100 percent. Indeed, firstly, we can calculate criteria weights (
w
i) related to evaluation factors. And, then, each element that is placed in each column must multiply with the wi, therefore, we can make anew matrix. New modified matrix is called V Matrix as follows:
n i i w 1 1 , mn n m m n n n n ij r w r w r w r w r w r w r w r w r w V ... . . . . . . ... ... 2 2 1 1 2 22 2 21 1 1 12 2 11 1 .STEP 4: Making solutions for ideal (A+) and ideal (A-)
In the step 4, from the V matrix, two different solu-tions are produced which set both positive ideal solution and negative ideal solution. It is related to weighted normal value largest (best) choice which can alternatively be at least (worst) value acceptable to determine alternative. Set of ideal solving can be calculated using maximum and minimum compo-nent to find best solution as follows:
(maxv j J),(minv j J' A ij i ij i .
The formula above is determined for A+ ideal
solu-tion cloud. For A-, we calculated ideal solution as
follows: (min v j J),(max v j J' A ij i ij i .
In both formulas, J shows benefit maximization, and
J’ shows lost minimization.
STEP 5: Calculating dimension of distinction
This step needs to calculate standard deviation of decision point among positive and negative
dimen-sions. There are two parts of solution for each posi-tive and negaposi-tive side. It can be calculated as fol-lows using Euclidean distance formula:
n j j ij i v v S 1 2 *) ( ,
n j j ij i v v S 1 2 ) ( .represents distance from ideal positive solution and represents distance from ideal negative solu-tion too.
STEP 6: Calculating ideal solutions of relative prox-imity
In this last step, relative proximity can be calculated using ideal negative and ideal distinction as follows:
* * i i i i S S S C . * i
C
value must be between0
C
i*
1
, and Ci* 1, and0
*
i
C
.When an alternative is close to positive ideal solu-tion, value of ∗is close to 1, otherwise, the alterna-tive is close to negaalterna-tive ideal solution and its value approaches to 0. This situation of each alternative is represented in Figure 1.
Fig. 1. Illustration of TOPSIS
When we calculate , and ∗, then, we need to rank all results according to the descending order of the value. If any ∗ of each alternative has distance from 1, it can be understood that it is placed too close to positive ideal point. And it can be said that it has higher performance than the others.
After ranking order by result in terms of descending order, we may calculate coefficient of correlation between two ranked variables. Spearman’s Rho
(Rank-Order) Correlation is the nonparametric ver-sion of the Pearson product-moment correlation and it is used in strength of all series.
1 6 ∑
1 .
In this formula, D2 refers to square of two variables
that are different according to rank order, N refers to count of total elements in the analysis. In the result of the Spearman’s Rho Correlation, we can test the relationships between ranked results.
3. Results and implications
According to TOPSIS method, we analyzed perfor-mance measurements of Oman’s financial institu-tions given a set of variables for the period from 2011 to 2015.
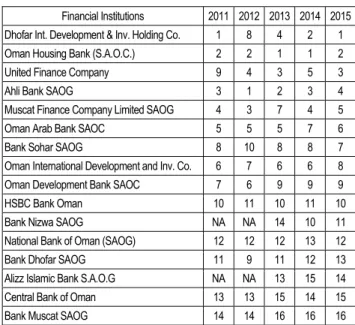
Table 3. All ranked results for financial institutions from 2011 to 2015
Financial Institutions 2011 2012 2013 2014 2015 Dhofar Int. Development & Inv. Holding Co. 1 8 4 2 1 Oman Housing Bank (S.A.O.C.) 2 2 1 1 2 United Finance Company 9 4 3 5 3
Ahli Bank SAOG 3 1 2 3 4
Muscat Finance Company Limited SAOG 4 3 7 4 5 Oman Arab Bank SAOC 5 5 5 7 6
Bank Sohar SAOG 8 10 8 8 7
Oman International Development and Inv. Co. 6 7 6 6 8 Oman Development Bank SAOC 7 6 9 9 9 HSBC Bank Oman 10 11 10 11 10 Bank Nizwa SAOG NA NA 14 10 11 National Bank of Oman (SAOG) 12 12 12 13 12 Bank Dhofar SAOG 11 9 11 12 13 Alizz Islamic Bank S.A.O.G NA NA 13 15 14 Central Bank of Oman 13 13 15 14 15 Bank Muscat SAOG 14 14 16 16 16
Table 3 represents all results of TOPSIS method for each year. The order is based on the year 2015. Dho-far International Development and Investment Hold-ing Co., accordHold-ing to all variables and the results of TOPSIS method, is placed at the first rank in 2015 and 2011. However, in 2014, the company is ranked second after Oman Housing Bank. Moreover, Dho-far International Development and Investment Hold-ing Co. is ranked 4th and 8th for the years 2013 and
2012, respectively.
Hence, it can be concluded that Dhofar International Development and Investment Holding Co. was more efficient in terms of given variables using the TOP-SIS method in 2015 and 2011. In addition, Oman Housing Bank was ranked first for two consecutive years, 2013 and 2014. In 2012, Ahli Bank was more efficient, as it was ranked number one using the TOPSIS method. In contrast, Bank Muscat and Cen-tral Bank of Oman, which were considered the two
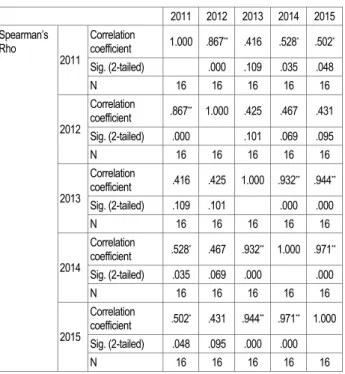
biggest banks in terms of total assets, were placed at the bottom of the list. This indicates that both are less efficient based on the method used in this paper. As for Spearman’s Rho Correlation, we tested rela-tionships between ranked series among all banks and for all years. We used IBM SPSS 21 version to cal-culate Spearman’s Rho Correlation, and the results are shown in Table 4.
Table 4. Spearman’s Rho Correlations
2011 2012 2013 2014 2015 Spearman’s Rho 2011 Correlation coefficient 1.000 .867** .416 .528* .502* Sig. (2-tailed) .000 .109 .035 .048 N 16 16 16 16 16 2012 Correlation coefficient .867** 1.000 .425 .467 .431 Sig. (2-tailed) .000 .101 .069 .095 N 16 16 16 16 16 2013 Correlation coefficient .416 .425 1.000 .932** .944** Sig. (2-tailed) .109 .101 .000 .000 N 16 16 16 16 16 2014 Correlation coefficient .528* .467 .932** 1.000 .971** Sig. (2-tailed) .035 .069 .000 .000 N 16 16 16 16 16 2015 Correlation coefficient .502* .431 .944** .971** 1.000 Sig. (2-tailed) .048 .095 .000 .000 N 16 16 16 16 16
**. Correlation is significant at the 0.01 level (2-tailed). *. Correlation is significant at the 0.05 level (2-tailed). Conclusion
We analyzed the performance of selected Omani financial institutions between the period of 2011 and 2015. The analyses include nine commercial banks, three specialized banks, two investment companies and two finance companies. All variables and
information are collected and obtained from Bank-scope and financial institutions financial statements such as their balance sheets, income statements and their official web sites. In this study, we have used Technique for Order Preference by Similarity to Ideal Solution (TOPSIS). It is called multicriteria decision analysis. In the TOPSIS method, we used financial and non-financial variables related to fi-nancial institutions using TOPSIS method. As a result of our analysis, it can be concluded that Dho-far International Development and Investment Hold-ing Co. was more efficient in terms of given va-riables in the TOPSIS method in 2015 and other years, respectively, 2nd, 4th, etc. Moreover, Oman Housing Bank has 2nd rank in 2015, 1st in 2014 and the same result for 2013. The first 5 levels of the results show more efficient financial institutions in Oman than others.
After ranking order by result in terms of descen-ding order with the TOPSIS method. We calcu-lated coefficient of Spearman’s Rho (Rank-Order) Correlation between two ranked variables. More-over, Spearman’s Rho Correlation analysis shows strong relationships between years, especially 2011 and 2012, where it look as one group. In the second group, those can be determined relation-ships from 2013 to 2015. In the group, there are strong relationships between variables in each year. All strong relations are significant at the 0.01 level as a statistically base. As a result of this correlation, all ranked results are related to other years. If a financial institution is at placement in level, it can be affected by the year before or the year after. However, Oman’s financial institutions correlations show that there are 2 diffe-rent pe-riods as effecting one year to the other. A further research study might compare the results using different approaches to measure the performance other than the TOPSIS approach.
References
1. Bhattacharyya, A., Lovell, C.K. & Sahay, P. (1997). The impact of liberalization on the productive efficiency of Indian commercial banks, European Journal of operational research, 98 (2), pp. 332-345.
2. Hasan, I. & Marton, K. (2003). Development and efficiency of the banking sector in a transitional economy: Hun-garian experience,Journal of Banking & Finance, 27 (12), pp. 2249-2271.
3. Hwang, C.L., Lai, Y.J., Liu, T.Y. (1993). A new approach for multiple objective decision making, Computers and
Operational Research, 20, pp. 889-899.
4. Hwang, C.L., Lai, Y.J., Liu, T.Y. (1993). A new approach for multiple objective decision making, Computers and
Operational Research, 20, pp. 889-899.
5. Hwang, C.L., Yoon, K. (1981). Multiple Attribute Decision Making: Methods and Applications, New York: Springer-Verlag.
6. Hwang, C.L., Yoon, K. (1981). Multiple Attribute Decision Making: Methods and Applications, New York: Springer-Verlag.
7. Kaya, Y.T. (2001). CAMELS analysis in Turkish banking sector, BRSA MSPD working report, p. 6.
8. Kraft, E. & Tırtıroğlu, D. (1998). Bank efficiency in Croatia: A stochastic-frontier analysis, Journal of compara-tive economics, 26 (2), pp. 282-300.
9. Li, S., Liu, F., Liu, S. & Whitmore, G.A. (2001). Comparative performance of Chinese commercial banks: Analy-sis, findings and policy implications, Review of Quantitative Finance and Accounting, 16 (2), pp. 149-170.
10. Lin, X. & Zhang, Y. (2009). Bank ownership reform and bank performance in China, Journal of Banking &
Fi-nance, 33 (1), pp. 20-29.
11. Mercan, M., Reisman, A., Yolalan, R. & Emel, A.B. (2003). The effect of scale and mode of ownership on the financial performance of the Turkish banking sector: results of a DEA-based analysis, Socio-Economic Planning
Sciences, 37 (3), pp. 185-202.
12. Mertens, A. & Urga, G. (2001). Efficiency, scale and scope economies in the Ukrainian banking sector in 1998,
Emerging Markets Review, 2 (3), pp. 292-308.
13. Murillo‐Zamorano, L.R. (2004). Economic efficiency and frontier techniques, Journal of Economic surveys, 18 (1), pp. 33-77.
14. Ravi, V., Kurniawan, H., Thai, P.N.K. & Kumar, P.R. (2008). Soft computing system for bank performance pre-diction, Applied soft computing, 8 (1), pp. 305-315.
15. Saha, A. & Ravisankar, T.S. (2000). Rating of Indian commercial banks: a DEA approach, European Journal of
Operational Research, 124 (1), pp. 187-203.
16. Staub, R.B., de Souza, G.D.S. & Tabak, B.M. (2010). Evolution of bank efficiency in Brazil: A DEA approach,
European journal of operational research, 202 (1), pp. 204-213.
17. Tecles, P.L. & Tabak, B.M. (2010). Determinants of bank efficiency: The case of Brazil, European Journal of
Operational Research, 207 (3), pp. 1587-1598.
18. Tözüm, H. (2002). Performance evaluation of banks, Active: Journal of Banking and Finance, 27, pp. 1-9. 19. Yoon, K. (1987). A reconciliation among discrete compromise situations, Journal of Operational Research
Soci-ety, 38, pp. 277-286.
20. Yoon, K. (1987). A reconciliation among discrete compromise situations, Journal of Operational Research
Soci-ety, 38, pp. 277-286.