29 (2) 7-18, 2000 29 (2) 7-18, 2000
DETERMINATION OF SOME PARAMETERS WHICH AFFECT THE ACCURACY AND PRECISION IN UV-VIS SPECTROPHOTOMETRY
UV-GÖRÜNÜR ALAN SPEKTROFOTOMETRİSİ'NDE DOĞRULUK VE KESİNLİĞİ ETKİLİYEN BAZİ DEĞİŞKENLERİN TAYİNİ
Cem YÜCESOY
Ankara University, Faculty of Pharmacy, Department of Analytical Chemistry 06100 Ankara-TÜRKİYE
ABSTRACT
In this study, quality control tests on UV-Vis spectrophotometers, cells and solvents used in UV-Vis spectrophotometry were made according to the instructions of pharmacopoeia and reference books. For this purpose, baseline flatness, stray light, resolution, wavelength and absorbance accuracy of UV-Vis spectrophotometers were tested. It was found that many parameters tested deviate from acceptable limits. Likely, many of the cell-pairs and solvents of
different brands tested didn't meet the requirements. The results confirmed that the maintenance of the instruments, quality of cells and solvents used in the UV-Vis spectrophotometry are prerequisite to achieve accurate and precise results.
Key Words : UV-Vis spectrophotometry, accuracy and precision, determination of parameters. ÖZET
Bu çalışmada, görünür-alan spektrofotometrisi'nde kullanılan cihaz, hücre ve çözücüler farmakope ve kaynak kitaplar tarafından öngörülen kalite kontrol testlerinden geçirildiler. Bu amaçla, UV-görünür alan spektrofotometrelerinde zemin absorbansı, kaçak ışın, ayırma gücü, dalga boyu ve absorbans doğruluğu kontrol edildi. İncelenen parametrelerin çoğunun kabul edilen sınırların dışında sapma gösterdiği görüldü. Aynı şekilde, incelenen hücre çiftleri ve çözücülerin çoğunun da istenen şartları yerine getirmediği görüldü. Sonuçlar, UV-görünür
alan spektrofotometrisi'nde doğru ve kesin olmasının, hücre ve çözücü kalitesinin önemli
Anahtar Kelimeler : UV-görünür
tayini.
sonuçlar olduğunu
elde etmek için teyit etti.
alan spektrofotometrisi, doğruluk
kullanılan cihazın bakımlı
ve kesinlik, değişkenlerin
INTRODUCTION
The first UV-Vis spectrophotometers came into general use in 1940's. Since then they have become the most important analytical instrument in many pharmaceutical, clinical and environmental laboratories. Because the UV-Vis spectra of substances are highly suitable for quantitative assays and for many substances they are useful as additional means of identification. Since the technique has become so commonplace, it is assumed that every scientist knows how to 'run' an absorption spectrum. However, a proper training in the technique, maintenance of the spectrophotometer, quality of the cells and solvents used is essential to achieve reproducible and reliable results. This paper investigates the importance of these factors referring to quality control tests required from pharmacopoeias and other reference books.
MATERIALS AND METHODS Apparatus
Five UV-Vis recording spectrophotometers (Al, A2, Bl, B2 and C) were tested, which were produced from two different instrument manufacturers. Different models of the one manufacturer were coded as A and B (two of each were tested) and the one and only model of the other manufacturer is coded as C.
Seven matched quartz cell-pairs (path length = 10 mm) produced from two different manufacturers were tested.
Reagents
Analytical grade potassium chloride (KC1 ), sodium nitrite( NaN02 ), toluene, hexane, potassium dichromate ( K2Cr2O7 ) and sulphuric acid ( H2SO4) were purchased from Merck and Fisher. Solvents tested were ethanol 96 %, ethanol absolute, methanol absolute and
cyclohexane. They were products of eight different manufacturers, four of which were international origin.
Solutions
1- Solution A : 50 0.5 mg K2Cr2O7 (dried for 1 hour at 110 C) is dissolved and made
up to 1000 ml with 0.005 M H2SO4.
2- Solution B : 100 1 mg K2Cr2O7 (dried for 1 hour at 110 C) is dissolved and made up
to 1000 ml with 0.005 M H2SO4.
3- 1.2 % KC1 solution : 1.200 g KC1 is dissolved and made up to 100 ml with water. 4- 5 % NaN02 solution : 5.000 g NaN02 is dissolved and made up to 100 ml with water.
5- 0.02 % toluene (v/v) in hexane solution : 2.0 ml toluene is dissolved and made up to 100 ml with hexane. 1.0 ml of this solution is diluted to 100 ml with hexane.
Control of the Instrumental Baseline (Baseline flatness):
It should be ensured that there are no cells in the cell holders. The spectrum between 200-800 nm are recorded. Absorbance settings : 0.010 A.
Control of the Cell Baseline :
The sample and reference cells are filled with water and placed in the cell holder. The spectrum between 200-800 nm are recorded. Absorbance settings : 0.050 A.
If there are considerable differences from the instrumental baseline, the cells are changed and checked whether the deviation is reverse in sign.
Control of the Stray Light:
The absorbance of 1.2 % KC1 solution is measured at 200 nm against water. The transmittance of 5 % NaN02 solution is measured at 340 nm against water.
Control of the Resolution :
The spectrum of 0.02% toluene in hexane solution is recorded between 200-300 nm. The ratio of the absorbance at 269 nm to that at 266 nm is calculated.
Control of Wavelengths :
The spectrum of solution A is recorded between 200-400 nm using 0.005 M H2S04 as the
reference. The absorption maxima and minima are compared with the wavelengths given in Table 2.
Control of Absorbance :
The absorbance values of solution A and B are measured at 235, 257, 313 and 350 nm for the instrument tested and compared with the data given in Table 3. The measurements should be made with 10 mm pathlength cells with the temperature controlled within the range 15 - 25 °C using 0.005 M H2S04 as the reference.
Control of the Precision :
The absorbance of solution A is measured 10 times at 235, 257, 313 and 350 nm using two different techniques.
a) Common technique : The sample-cell is removed from the cell holder, emptied, filled and placed again in the cell holder.
b) Proposed technique : The cells are placed in the cell holder. The filling and emptying process of the sample-cell is made on site by means of Pasteur-pipette (Tablo 3 ).
RESULTS AND DISCUSSION
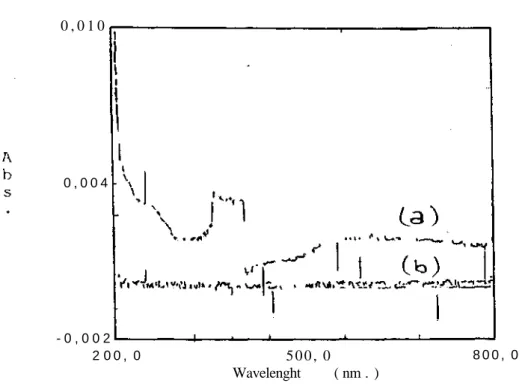
The instrumental baseline is a useful check of the condition of the whole system. Even if measurements are made at a single wavelength, it is worth of scanning on each side of that wavelength to ensure that the baseline is not changing rapidly (1). In this study five spectrophotometers of different models and age were tested. By all of them, the deviation of the baseline was out of the acceptable limits before baseline correction was made (Table la). As an example, the baseline of the instrument coded as Bl was shown in Figure 1. The results show the importance of baseline correction before actual sample-readings were made.
Table 1: a) Instrumental Baseline, b) Stray light and c) Resolution of spectrophotometers tested.
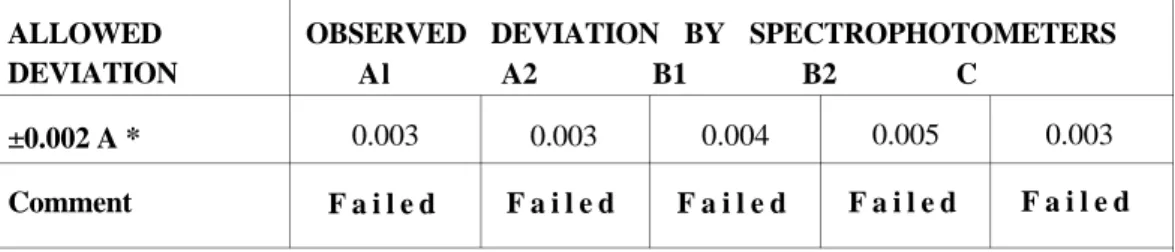
a) INSTRUMENTAL BASELINE ( Deviation from zero-Absorbance) ALLOWED
DEVIATION ±0.002 A * Comment
OBSERVED DEVIATION BY SPECTROPHOTOMETERS Al A2 B1 B2 C 0.003 F a i l e d 0.003 F a i l e d 0.004 F a i l e d 0.005 F a i l e d 0.003 F a i l e d b) STRAY LIGHT at 200 nm (as Absorbance) and 340 nm (as % Transmittance) VALUES REQUIRED A200> 2.000 Comment T3 4 0<0.1% Comment
VALUES OBSERVED BY SPECTROPHOTOMETERS Al A2 B1 B2 C 1.822 F a i l e d 0.48 F a i l e d 1.855 F a i l e d 0.41 F a i l e d 3.173 Passed 0.06 Passed 3.155 Passed 0.06 Passed 2.033 Passed 0.09 Passed c) RESOLUTION (as A269 / A266) REQUIRED RATIO 1.5** Comment
RATIOS OBSERVED BY SPECTROPHOTOMETERS Al A2 B1 B2 C 1.21 F a i l e d 1.23 F a i l e d 1.30 F a i l e d 1.31 F a i l e d 1.24 F a i l e d * Specified from instrument manufacturers. ** BP 1990.
The light, which reaches the detector by-passing the sample is called stray light. This problem, met near the wavelength limits of an instrument and at the crossover point between UV and Visible lamps, reduces the apparent absorption and causes asymmetrical peaks (2). The stray light of the instruments were checked at two wavelengths. The absorbance of 1.2% KC1 at 200 nm should be more than 2.000 and the transmittance of 5 % NaN02 at 340 nm should be
less than 0.1 % (2). Two relatively older instruments, coded as Al and A2 had more stray light than allowed (Table 1 b).
Figure 1. Instrumental baseline of spectrophotometer Bl(a) before and (b) after correction (suppressed spectrum) was made.
However the effect of stray light on measured absorbance is dependent on the type of sample being measured. Consequently, this check serves to monitor the deterioration of the instrument only (1).
The resolution of the spectrophotometers is important in qualitative analysis only (3-5). To find the resolution, the ratio of the absorbance at the maximum at 269 nm to that at the mini mum at 266 nm is calculated. The pharmacopoeias considered refer to the numerical value stated in the particular monograph. As an exception, BP 1990
5 0 0 , 0 Wavelenght ( nm . ) 8 0 0 , 0 2 0 0 , 0 - 0 , 0 0 2 0 , 0 0 4 0 , 0 1 0
requires that this ratio should be more than 1.5 (4). None of instruments tested met this
requirement (Table lc).
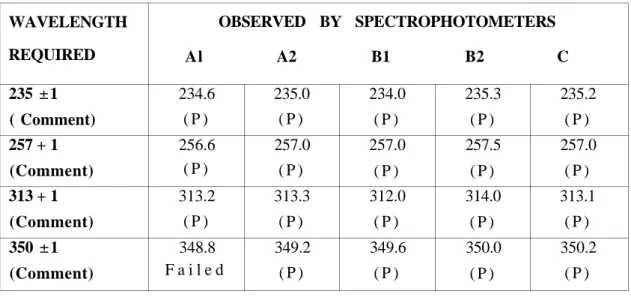
The accuracy of the wavelengths of the instruments were investigated using solution A, which was actually prepared to check the absorbance accuracy. Because wavelength standards such as holmium oxide solution (6) couldn't be obtained. K2Cr207 absorbs approximately
between 200-450 nm and have two maxima and minima at 235, 257, 313 and 350 nm. Accepted deviation for wavelength-readings in the UV region is ±1 nm. With one exception, all the instruments tested, passed this test, although it cannot be assumed that the wavelengths in the visible range were also correct (Table 2).
Table 2. Wavelength Accuracy of the spectrophotometers tested. WAVELENGTH REQUIRED 235 ± 1 ( Comment) 257 + 1 (Comment) 313 + 1 (Comment) 350 ± 1 (Comment) OBSERVED BY SPECTROPHOTOMETERS Al A2 B1 B2 C 234.6 ( P ) 256.6 ( P ) 313.2 ( P ) 348.8 F a i l e d 235.0 ( P ) 257.0 ( P ) 313.3 ( P ) 349.2 ( P ) 234.0 ( P ) 257.0 ( P ) 312.0 ( P ) 349.6 ( P ) 235.3 ( P ) 257.5 ( P ) 314.0 ( P ) 350.0 ( P ) 235.2 ( P ) 257.0 ( P ) 313.1 ( P ) 350.2 ( P ) * ( P ) = Passed the control.
** Spectrum of solution A is recorded between 200 - 400 nm.
The accuracy of the absorbance of the instruments is checked with two solutions of K2Cr207 of known concentration (Solution A and B). The second column of Table 3 shows the
accepted range of absorbances being measured by the instruments at 235, 257, 313 and 350 nm. The tolerances represent acceptable limits based on the uncertainties of the literature values, the temperature coefficient of the molar absorptivities of K2Cr207 over the temperature range
laboratory (1). The absorbance values of the older instrument was totally out of acceptable limits. The deviations observed correspond to about 4 % error. Other instruments had relative lower absorbance deviations and this at some wavelengths, the reason of which may be optical, electronic or mechanical origin (1).
It is assumed that the filling and emptying of the cells and their relocation in the cell holder is a serious source of error in uv-vis spectrophotometry. To evaluate the eventual effect of cell relocation on accuracy and precision of absorbance readings, the results of the common technique (Tl) and proposed technique (T2) were compared (1). For this work, solution A was used only.
In the common technique, sample cell was removed after each measurement from the cell holder, emptied, filled with the same solution and relocated in the cell holder for following absorbance measurement. In the proposed technique, sample cell was held in the cell holder during measurements. The emptying and filling process was made with a Pasteur pipette. The average of 10 measurements and the relative standard deviation (RSD) for both techniques were calculated. According to the results, there was no remarkable difference between the means and RSDs (Column Al, A2, B l , B2 and C of Table 3). Conclusively, the proposed technique might be useful for spectrophotometers with relative older technology.
SOLN. A A B A A B A A B A A B (nm) and ABS. REQUIRED at 235 => 0.626±0.009 235 => 0.626±0.009 235=>1.251±0.019 257 => 0.727±0.007 257 => 0.727+0.007 257 => 1.454 0.015 313 => 0.244 0.004 313=> 0.244 0.004 313 => 0.488 0.007 350 => 0.536 0.005 350 => 0.536 0.005 350 => 1.071 0.011 T* I II I I II I I II I I II I
ABS. OBSERVED BY SPECTROPHOTOMETERS
Al A2 B l B2 C 0.602±0.001 F 0.602±0.001 F 1.215 F 0.698 0.000 F 0.698 0.000 F 1.412 F 0.234 0.001 F 0.234 0.000 F 0.465 F 0.515 .0.001 F 0.514 0.000 F 1.026 F 0.615 0.001 F 0.615 0.001 F 1.228 F 0.717 0.001 F 0.718 0.000 F 1.429 F 0.239 0.000 F 0.240 0.000 0.483 0.533 0.000 0.532 0.001 1.063 0.632 0.000 0.631 0.001 1.260 0.729 0.000 0.728 0.001 1.461 0.249 0.000 F 0.248 0.001 0.499 F 0.538 0.000 0.537 0.001 1.072 0.619 0.001 0.620 0.000 1.241 0.720 0.001 F 0.719 0.001 1.437 F 0.242 0.000 0.241 0.000 0.478 F 0.529 0.001 0.528 0.000 1.050 0.622 0.001 0.623 0.001 1.233 0.723 0.000 0.722 0.000 1.452 0.240 0.000 0.239 0.001 F 0.485 0.527 0.000 F 0.527 0.001 F 1.065
* Technique I ( T I ) = The cells are emptied and filled outside and relocated in the cell holder. Technique II ( T I I ) = The cells are emptied and filled inside the cell holder.
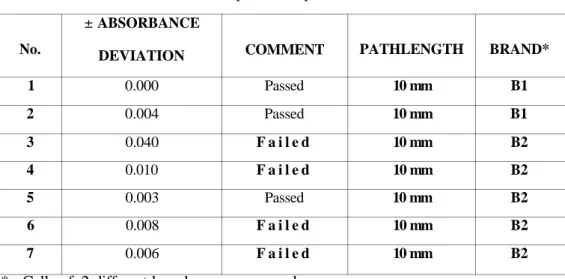
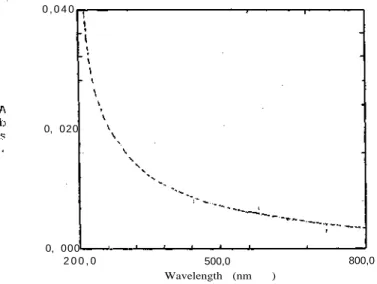
Control of cell baseline should be performed every time that clean cells are put into the instrument and at least once per day. If the cells and the solvent they contain are identical, the cell baseline should coincide with the instrumental baseline. A difference of ±0.005 cm in the cell-pathlength is tolerable, which again causes such a difference in the absorbance-measurements (3-5). The baselines of cell-pairs tested were recorded between 200-800 nm using water as solvent. Absorbance difference of four cell-pairs inspected was out of the limits, which can be explained with the contamination that the cleaning procedure has failed to remove or fine scratchs that were not visible, when the cells are filled (Table 4). Figure 2 shows the absorbance deviation of cell baseline for matched cell-pair No.3 from acceptable limits.
BP 1980 requires that ethanol 96 %, ethanol absolute, methanol absolute and cyclohexane should have an absorbance, measured in a 1-cm cell at 240 nm with reference to water, not exceeding 0.100 A (7). This statement was discarded in the latest edition of British Pharmacopoeia. To find whether it is important or not, nine
Table 4 : Cell Baseline of matched quartz cell-pairs tested.
No. 1 2 3 4 5 6 7 ± ABSORBANCE DEVIATION 0.000 0.004 0.040 0.010 0.003 0.008 0.006 COMMENT Passed Passed F a i l e d F a i l e d Passed F a i l e d F a i l e d PATHLENGTH 10 mm 10 mm 10 mm 10 mm 10 mm 10 mm 10 mm BRAND* B1 B1 B2 B2 B2 B2 B2 * Cells of 2 different brands were measured.
Figure 2. The cell baseline of the matched cell-pair No. 3
solvents of different commercial origin were tested. As all the solvents of international manufacturers passed this exam, 3 out of 4 Turkish products failed, showing the importance of solvent purity in the uv-spectrophotometry (Table 5).
Table 5 : Absorbance of some solvents of different commercial origin at 240 nm SOLVENTS
Ethanol 96 % (TP-l)a Ethanol Abs. (TP-2) Methanol Abs (IP-3)b
Methanol Abs (IP-4) Methanol Abs (TP-5) Methanol Abs (TP-6) Cyclohexane (IP-3) Cyclohexane (IP-7) ABSORBANCE OBSERVED REQUIRED 0.085 0.151 0.030 0.026 1.852 4.000 0.037 0.051 < 0.100 < 0.100 < 0.100 < 0.100 < 0.100 < 0.100 < 0.100 < 0.100 COMMENT Passed F a i l e d Passed Passed F a i l e d F a i l e d Passed Passed
TP-1 = Turkish product, IP- 3 = Imported product. Following numbers (1-7) represent different
manufacturers. 0 , 0 4 0 0, 020 0, 000 2 0 0 , 0 500,0 800,0 Wavelength (nm )
The results of the study show that achievement of accurate and precise results in uv-vis spectrophotometry depend on the maintenance of the spectrophotometer, quality of the cell-pairs and solvents chosen for the assay. It can not be expected that spectrophotometers in use reach the performance of a brandnew one. Therefore, it is more realistic to set personal tolerances based on the level of performances that is required from the instrument. But as soon as the regular checks show that the performance has fallen outside these tolerances, action must be taken.
REFERENCES
1- Knowles, A., Burges, C. Practical absorption spectrophotometry, Vol.3, Chapman and Hall, London, p.119 -155,209 - 220 (1984).
2- Moffat, A.C. Clarke's Isolation and Identification of drugs, 2nd Ed., Thes Pharmaceutical Press, London, p.221-232 (1984).
3- European Pharmacopoeia, 3rd Ed., Council of Europe, Strasbourg, p.28-29 (1997).
4- The British Pharmacopoeia 1990, Her Majesty's Stationary Office, London, A88-A89 (1990).
5- Das 9. Deutsche Arzneibuch, Deutsches Arzneibuch 9.Ausgabe 1986 Deutscher Apotheker Verlag Stuttgart Govi-Verlag GmbH Frankfurt, p.134-135 (1986).
6- The United States Pharmacopoeia XXII., U.S. Pharmacopoeial Convention, Rockville MD,p.l992-1997(1999).
7- The British Pharmacopoeia 1990, Her Majesty's Stationary Office, London, A74-A75 (1980).