ORIGINAL RESEARCH
Analysis of correlation between white matter changes
and functional responses in thalamic stroke: a DTI & EEG study
Adil Deniz Duru1&Dilek Göksel Duru2&Sami Yumerhodzha3&Nerses Bebek3Published online: 10 May 2015
# Springer Science+Business Media New York 2015
Abstract Diffusion tensor imaging (DTI) allows in vivo structural brain mapping and detection of microstructural dis-ruption of white matter (WM). One of the commonly used parameters for grading the anisotropic diffusivity in WM is fractional anisotropy (FA). FA value helps to quantify the di-rectionality of the local tract bundle. Therefore, FA images are being used in voxelwise statistical analyses (VSA). The pres-ent study used Tract-Based Spatial Statistics (TBSS) of FA images across subjects, and computes the mean skeleton map to detect voxelwise knowledge of the tracts yielding to groupwise comparison. The skeleton image illustrates WM structure and shows any changes caused by brain damage. The microstructure of WM in thalamic stroke is investigated, and the VSA results of healthy control and thalamic stroke patients are reported. It has been shown that several skeleton regions were affected subject to the presence of thalamic stroke (FWE, p<0.05). Furthermore the correlation of quanti-tative EEG (qEEG) scores and neurophysiological tests with the FA skeleton for the entire test group is also investigated. We compared measurements that are related to the same fibers across subjects, and discussed implications for VSA of WM in thalamic stroke cases, for the relationship between behavioral tests and FA skeletons, and for the correlation between the FA maps and qEEG scores.
Results obtained through the regression analyses did not exceed the corrected statistical threshold values for multiple comparisons (uncorrected, p<0.05). However, in the regres-sion analysis of FA values and the theta band activity of EEG, cingulum bundle and corpus callosum were found to be relat-ed. These areas are parts of the Default Mode Network (DMN) where DMN is known to be involved in resting state EEG theta activity. The relation between the EEG alpha band power values and FA values of the skeleton was found to support the cortico-thalamocortical cycles for both subject groups. Further, the neurophysiological tests including Benton Face Recognition (BFR), Digit Span test (DST), Warrington Topographic Memory test (WTMT), California Verbal Learning test (CVLT) has been regressed with the FA skeleton maps for both subject groups. Our results corre-sponding to DST task were found to be similar with previous-ly reported findings for working memory and episodic mem-ory tasks. For the WTMT, FA values of the cingulum (right) that plays a role in memory process was found to be related with the behavioral responses. Splenium of corpus callosum was found to be correlated for both subject groups for the BFR.
Keywords DTI . FA . EEG . TBSS . Neurophysiological test . Thalamic stroke
Introduction
Axon loss that occurs due to neurodegenerative diseases cause changes in the structural connectivity patterns of the brain. This structural degeneration directly affects cognitive activity and the behavioral response of the brain. The effect of struc-tural variation on the functional output motivates researchers * Adil Deniz Duru
1 School of Physical Education and Sports, Neuroscience in Sports
Research Lab., Marmara University, Istanbul 34800, Turkey
2
Department of Biomedical Engineering, Istanbul Arel University, Istanbul 34537, Turkey
3
Istanbul Faculty of Medicine, Department of Neurology, Istanbul University, Istanbul 34093, Turkey
and clinicians to investigate the underlying mechanism of an-atomical connectivity in the human brain.
Several neuroimaging techniques exist that can be used to identify anatomical and functional connectivity. As a nonin-vasive technique, Diffusion Tensor Imaging (DTI) is unique in its ability to provide in vivo structural brain information among the other MRI methodologies. Differing from the dif-fusion weighted MR images, DTI provides directional infor-mation that could be used to compute nerve pathways and extract knowledge about anatomical connectivity. Diffusivity property of the water is used in white matter estimation (Basser et al.2000; Le Bihan et al. 2001). DTI is advantageous in clinical neuroscience, for quantitative comparison of specific white matter pathways in disease, in guided interventions, and for the exploration of normal brain anatomy (Johansen-Berg and Behrens 2006). Microstructural alterations in white matter (WM) can be assessed by measuring the fractional anisotropy (FA) using DTI (Ciccarelli et al. 2003). The FA images are used to threshold the data and to quantify the directionality of the local tract bundle. DTI parameters of patients with Multiple Sclerosis (MS) were found to be correlated with cognitive dynamics (Rimkus et al. 2011). Bai et al. (2009), found significant correlations between white matter FA values obtained using a region of interest (ROI) based approach to DTI and the cognitive performance task scores in amnestic type mild cognitive impairment pa-tients. In addition to studies evaluating the relationship of DTI with cognitive performance in neurodegenerative diseases, the correlation between the type 2 diabetes and white matter tracts were also examined (Reijmer et al. 2013). The relationship between DTI and cognitive dy-namics in normal aging has been investigated (Sasson et al. 2012).
FA value comparison of two groups can be performed using voxel based morphometry (VBM) techniques. The VBM technique was developed to analyze changes observed in T1 weighted images (Ashburner and Friston2000). One of the major limitations of this technique is the misregistration problem. To overcome the limitation of the registration algo-rithms that are used in VBM studies, a novel technique was developed by Smith et al. (Smith et al.2006). In VBM studies, after the normalization step, the variability of each subject data is minimized using the spatial smoothing operator. However, tract based spatial statistics (TBSS) does not require the smoothing operator, but it is lacking in analyzing the whole brain.
Conventional techniques that perform voxelwise statistics between groups or, regression with psychological tests, gen-erally use all of the voxels forming the brain. However, mean FA skeleton (Smith et al.2006) usage enable researchers to perform statistical tests in a reduced model. As a continuous parameter, FA in TBSS allows analysis of white matter
estimation and diffusivity across subjects, and calculation of the mean skeleton map to monitor any brain damage (Smith et al.2006). FA maps of patients with motor neuron dis-eases such as amyotrophic lateral sclerosis (ALS) and primary lateral sclerosis (PLS) were compared with the control maps, and structural differences were exhibited using TBSS (Ciccarelli et al. 2009). Wang et al. applied both VBM and TBSS separately on the same dataset, and they achieved similar results with the use of both tech-niques (Wang et al. 2013). In another study, VBM and TBSS analysis on FA maps were conducted to extract the differences between two groups of stroke patients, where one group consists of patients who regained some of their hand functions, and the second group who did not regain hand functionality. The spatial location patterns for FA losses between two groups deduced by VBM analysis were in agreement with those obtained through TBSS (Yin et al. 2013). White matter FA changes of congenital blind and late blind subjects compared to con-trol subjects were examined using TBSS and VBM. Both methods showed decreased FA values in the bilateral op-tic radiations for the blind groups (Wang et al. 2013).
The relationship between anatomical connectivity and physiological response of the brain can be examined with functional neuroimaging techniques. The functional activity of the brain can be determined using functional Magnetic Resonance Imaging (fMRI) or Positron Emission Tomography (PET) with a high spatial resolution. The rela-tionship between the fMRI blood oxygenated level dependent (BOLD) signal and the FA values have been investigated by regression analysis. The general framework is to use the FA maps as the dependent variable whereas the BOLD response is used as a predictor (Baird et al.2005).
Among the advantages of these techniques, the time resolu-tion parameter, in the order of seconds, seems to be the major drawback for imaging cognitive activity. On the other hand, electrophysiological measurements (Electroencephalogram, EEG), enable researchers and clinicians to measure brain elec-trical activity with a high temporal resolution, crucial for the monitoring of rapid changes due to functional activity. Thus, the use of the EEG and DTI techniques in combination allows researchers to investigate the functional and anatomical rela-tionship in the brain noninvasively. The regression of the be-havioral test results and white matter (FA) values of the skeleton, uniquely, identifies the relation between ana-tomical connectivity pattern of the brain and behavioral re-sponses. Moreover, the connectivity structure and the resting state electrophysiological output of the brain can be analyzed by the use of the DTI and EEG measurements. By the use of diffusion tensor images, precise analysis of the anatomical connectivity can be formed while high temporal resolution of EEG can be used to model the electrical oscillations gener-ated by the brain.
Connections originated or crossing from thalamus especial-ly thalamocortical axonal connectivity may cause major changes in subject’s perception (Ro et al.2007) and damage in the thalamus can lead to neurophysiological impairment (Pappata et al.1990). Memory and attention level of the tha-lamic stroke patients are measured using P3 pattern of event related potentials (P3-ERP) and it has been ob-served that thalamus has an effect on the generation of P3 component of the ERP (Trinka et al. 2000). These findings suggest that, the relationship between the thal-amus originated structural connections and electrophysi-ological responses should vary between the thalamic stroke patients and healthy controls.
The aim of this study is to investigate the differences in the brain structural connectivity of the healthy controls and thalamic stroke patients. We also aim to exhibit the relationship between the structural connectivity and be-havioral responses deduced by neurophysiological tests for the thalamic stroke patients. Finally, the relation of structural connectivity and resting state EEG is queried in the concept of the study.
In this study, the anatomical changes that occur in the brain after thalamic stroke are analyzed using FA images obtained from the DTI measurements. DTI measurements were obtain-ed from 15 thalamic stroke patients and 15 control subjects who were similar in age. TBSS was used to generate FA skel-eton maps of the data and to compare white matter integrity in the two groups. TBSS findings demonstrated successful iden-tification of structured topologies of fibers corresponding to the same anatomical regions across subjects. Comparing FA skeleton maps between healthy subjects and subjects suffering from thalamic stroke helps us to detect the WM fiber tract changes by considering each individual voxel’s contribution in the topology. This is achieved through the skeletonisation step of TBSS, explained in detail in the methods section. Through the use of EEG measurements, band powers of the EEG are computed as quantitative EEG (qEEG) metrics while the subjects are at rest. The relationships between FA skeleton values and qEEG metrics are investigated in the patient and control groups independently. Finally, behavioral test scores are used to determine the effects of FA skeleton changes for both patients and controls.
Background
Principle component analysis of diffusion tensor imaging DTI relies on the Stejskal-Tanner imaging sequence. Physically, the diffusion tensor estimation can be obtain-ed by taking the arithmetic average of the diffusion weighted images in all possible directions. Mathematically, the result is 3 × 3 symmetric diffusion tensor D as
represented in Eq. (1) for each pixel in the imaging slice (Basser et al. 2000).
Si¼ S0e−bbgi T
Dbgi; ð1Þ
where;
Si Signal received with the ith diffusion gradient pulse,
where i=1 to N, (N=6 typically)
S0 Signal received without the diffusion gradient pulse
b The diffusion weighting factor
|gi| Strength of the ith diffusion gradient pulse, and
ĝi ith diffusion gradient vector.
The diagonal and off-diagonal elements of 3×3 D are im-ages with diffusion gradients, required to detect diffusivity in all directions. The base of the calculation of diffusivity is principal component analysis (PCA). The diagonalization of the diffusion tensor results in a set of three eigenvalues λ1>λ2>λ3associated with the three eigenvectors e!1, e!2,
and e!3corresponding to the principal diffusivity vectors for
each voxel being studied (Basser et al.2000; Mori et al.1999; Watts et al.2003). The eigenvectors, e!i, for a voxel x can be
computed as in Eq.2and3:
Dx!ei¼ λi!ei; ði¼ 1; 2; 3Þ ð2Þ
Dx−λI
j j ¼ 0 ð3Þ
Here,D is the diffusion tensor (Eq.1) of the standardized data, and I is the identity matrix. The eigensystem calculation of the analyzed image data provides information about the diffusion distribution throughout the investigated image. The first principal componentλ1shows the dominant diffusivity
direction. The second and third principal componentsλ2and
λ3provide information of the intermediate and smallest
prin-cipal diffusivity, respectively. In diffusion tensor literature, tracking methods rely mainly on the dominant principal dif-fusivity λ1. The assumption is that the fibers’ orientation is
along the principal diffusivity (Jones et al.1999a; Jones et al. 1999b; Le Bihan et al. 2001; Reijmer et al. 2013). White matter estimation is achieved through these calculated diffu-sivity components. The state of being all the three eigenvalues equallyλ1=λ2=λ3is achieved when the region is isotropic.
The deviation from isotropic diffusion represents the degree of anisotropy. One of the commonly used parameters for grading the anisotropic diffusivity in white matter tracts is the FA. Fractional anisotropy Map
The fractional anisotropy (max. FA=1) represents the degree of anisotropy, or the deviation from isotropic diffusion (FA= 0). An FA map is one of the commonly used parameters for grading the anisotropic diffusivity in white matter tracts, and serves as an index of WM microstructure. Anatomically,
anisotropy tends to be high in white matter and low in gray matter, where a sudden drop in anisotropy is assumed to be the gray/white matter boundary. By ordering the eigenvectors in the order of descending eigenvalues, one can create an ordered orthogonal basis with the first eigenvector having the direction of largest variance of the data, which gives, in our case, the principal diffusivity. In this way, the most appropriate diffu-sivity directions can be determined. PCA is applied on the signal matrix to yield three uncorrelated (orthogonal) linear combinations λ1,λ2,λ3 of the signal Sx, Sy, Sz. The first
principal componentλ1has maximum variance, and thus its
weighting coefficients will give the direction of the maximum diffusion weighted signal, or largest principal diffusivity. The weighting coefficients of the second and third principal com-ponentsλ2andλ3will give the directions of the intermediate
and smallest principal diffusivity, respectively. The FA map is a representation of these eigenvalues as a characteristic param-eter of DTI analysis. Calculation of an FA map is based on the sum of squares of the diffusivity differences as in Eq. (4). The square root of the sum of squares of eigenvalues is used to gain a weighted average, where the principal eigenvalue is the largest, and therefore the dominant component. In this study, the FA map is being used by TBSS to compare the anatomy of the WM across subjects.
FA¼ ffiffiffi 3 2 r ffiffiffiffiffiffiffiffiffiffiffiffiffiffiffiffiffiffiffiffiffiffiffiffiffiffiffiffiffiffiffiffiffiffiffiffiffiffiffiffiffiffiffiffiffiffiffiffiffiffiffiffiffiffiffiffiffiffiffiffiffiffiffiffiffiλ 1−λ2 ð Þ2þ λ 1−λ3 ð Þ2þ λ 2−λ3 ð Þ2 q ffiffiffiffiffiffiffiffiffiffiffiffiffiffiffiffiffiffiffiffiffiffiffiffiffiffiffiffiffiffi λ1þ λ2þ λ3 ð Þ p ð4Þ
In this study, FA value is used as a quantification measure, selected and used as a base for skeletonisation in TBSS. Voxelwise statistical analyses (VSA) of white matter proper-ties provide results to localize changes in brain tissue caused by pathology, development, or degeneration. VSA typically relies on scalar measurements like FA, which are spatially matched across subjects prior to statistical modelling.
TBSS: tract based spatial statistics
TBSS is an approach to assess localized statistical testing of FA (and other diffusion-related) data that should alleviate the alignment problems.
TBSS implementation methodology begins with identifi-cation of a common registration target. Then all subjects’ FA images are aligned to this target using nonlinear registration. At this stage, perfect alignment is not expected or required. In this study, all FA images are aligned to the FMRIB58_FA standard space image (a high resolution average of 58 well-aligned FA images of healthy subjects whose ages vary from 20 to 50) as the target using nonlinear registration for each subject. Then, the target image is aligned to a standard space having a resolution of 1×1×1 mm (MNI152 (Mazziotta et al. 1995)). High resolution standard-space alignment enables us
to compute values for the skeletonisation step. Original FA images are transformed to MNI152 space through execution of the previous two steps. The FA image of each subject in a standard-space is stored into a single file having 4 dimensions. In this step, the final 4-D dataset includes the concatenated transformed FA images of the subjects.
After the computation of the mean FA map of all aligned FA images, the skeletonisation step is performed on the mean FA data, which is computed by taking the average of the FA images over subjects. This yields the skeleton of the mean FA image. Prior to the voxelwise cross-subject statistics, a binary mask of the skeleton is achieved by performing a thresholding process with a predefined common value (0.2) using the mean FA skeleton image. Then each subject’s aligned FA data is projected onto the mean FA skeleton image by using the FA values of the nearest tract center. This operation is performed by selecting the maximum FA value of the voxel of each subject, which has a minimum distance value to the tract cen-ter. The candidate FA values are selected from the voxels that are aligned perpendicular to the tract center. To achieve this, a distance map is created based on the skeleton mask. Finally, a four dimensional dataset is produced containing the projected FA values for each subject. This dataset is used for voxel-wise statistical operations. A suppressed image with low mean FA and/or high inter-subject variability is achieved by thresholding. Next, each subject’s aligned FA image is projected onto the skeleton map. This allows to cover the skeleton with FA values from the nearest relevant tract center. The process follows for each skeleton voxel (Smith et al. 2006). Finally, voxelwise statistics across subjects on the FA skeleton are done.
Material and methods
Participants
The participants of the study (n=30) belonged to one of two groups: one consisting of healthy control subjects (n=15), and the second consisting of patients (n=15) with thalamic stroke. The information about the age and education year distribu-tions is summarized in Table1. The thalamic lesions of the patients were investigated with MRI examinations, and it was observed that lesions were localized close to thalamus for each subject. Patients started taking antiagregant or anticoagulant medication regularly after the thalamic stroke diagnosis. Inclusion and exclusion criterias
Subjects are selected from a patient group who were diag-nosed with thalamic stroke in the concept of the study. Diagnosis of thalamic stroke was supported by the presence of acute ischemic thalamic lesion from MR images. Those
subjects older than 18 years old are informed about the behav-ioral experiments and written consent are obtained from the subjects. Exclusionary criteria for the study included the fol-lowing: presence of a hematom, a glioma or venous infarction, other infarcts such located around posterior cerebral arteria region and presence of cortical infarcts. Subjects younger than 18 years old are excluded. For the control group, 15 subjects are selected who had similar age, gender, education level with the patient group. The exclusionary criteria for the control group included the following: presence of demantia or epilepsia diagnosis, cerebrovascular illness or psychiatric medical history, alcohol and drug addiction.
The study was approved by the institutional review board of Istanbul University, Istanbul Medical School Department with document number 2011/1646-735, 19.10.2011-1689. Written informed consent was provided by all subjects prior to all imaging, measurements, and neurophysiological tests. MR image acquisition
The MR images used in this study were acquired on a 1.5 T Philips Achieva Scanner, in Istanbul Medical School Department of Neurology. T1-weighted structural MR images were acquired in sagittal plane, with slice thickness=3 mm, a gap=0.46 mm, TE=15 ms, TR=542 ms, a flip angle of 69°, matrix size = 528 × 528 and slices 20. Additionaly, T1-weighted structural MRI images were acquired in transverse plane, with slice thickness=4.2 mm, a gap=1.9 mm, TE= 15 ms, TR=542 ms, a flip angle of 69°, matrix sixe=512× 512 and slices 20. DTI data were acquired in transverse plane, with slice thickness =2 mm (contiguous), TE =80.261 ms, TR=9356 ms, a flip angle of 90°, matrix sixe=128×128, a voxel dimension 1.75 mm×1.75 mm×2 mm and slices 60 in 34 diffusion direction with a b0 value of 800.
After the thalamic stroke diagnosis of the patients, infarct volume information has been obtained using T1 weighted MR images. The thalamic stroke region of interest was selected by the neurologists using in house developed Matlab code for
each patient data. The mean and standart deviation of the infarct volume was found as 0.17 and 0.1 cm3respectively. Moreover, the T1 weighted MR images are segmented using FAST tool of FSL (Smith et al.2004). The intracranial vol-ume, gray matter volume and white matter volume of all par-ticipants are computed using segmented images using Matlab. The computed results are summarized in Table2, and sample segmentation results are given in Fig.1.
Behavioral scores
The behavioral metrics consist of the Digit Span Test (DST), Benton Face Recognition Test (BFR), California Verbal Learning Test (CVLT) and Warrington Topographic Memory Test.
Short term memory, working memory, and attentional skills are evaluated using the DST, which has two conditions. In the first case, subjects are asked to repeat the given numbers in the same order, and in the second they are asked to repeat the numbers in the reverse order.
For the BFR, monochrome sample photos are shown to the subjects, and subjects are asked to recognize these images from a group of images, which are produced using different light effects as monochrome. In the second step of the test, subjects are asked to recognize the photos in a group of im-ages, which are created by using different color and light Table 1 Demographic and
clinical characteristics of thalamic stroke patients and control subjects
Patients (7F, 8M) Control (7F,8M)
Mean (SD) Mean (SD) Z p
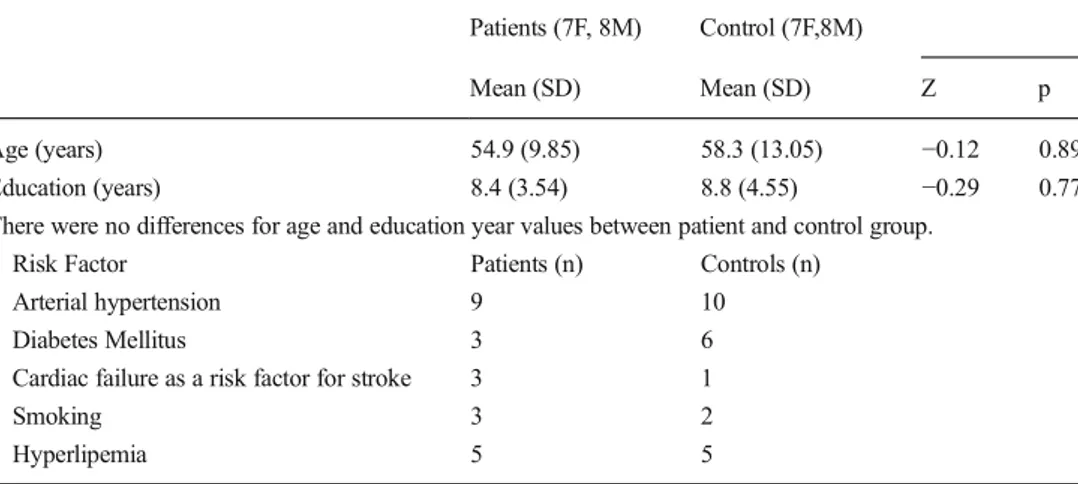
Age (years) 54.9 (9.85) 58.3 (13.05) −0.12 0.89 Education (years) 8.4 (3.54) 8.8 (4.55) −0.29 0.77 There were no differences for age and education year values between patient and control group.
Risk Factor Patients (n) Controls (n)
Arterial hypertension 9 10
Diabetes Mellitus 3 6
Cardiac failure as a risk factor for stroke 3 1
Smoking 3 2
Hyperlipemia 5 5
Table 2 The intracranial, white, gray matter volumes and normalized volume of Gray and White matter
Control (N=15) Patient (N=15) Mean (SD) cc Mean (SD) cc Intracranial Volume 1412.4 (177.82) 1455.9 (144.55) Gray Matter (GM) 599.34 (74.4) 621 (57.91) White Matter (WM) 509.38 (77.79) 502 (64.21) % GM 42.47 (1.4) 42.8 (2.6) %WM 36 (2.1) 34.5 (2.5)
compositions. Thus as a cognitive process, object perception ability is tested.
The CVLT is designed to evaluate verbal memory and ver-bal learning, and it is thought that the test measures conceptual skills. The CVLT consists of four categories, each containing four different words. The words are selected from the catego-ries of fruits, spices, clothes, and tools. The test includes two separate lists of the words, and the administrator reads the first list. After the reading phase, the subject is asked to repeat the word list completely. This process is repeated five times, and then the same process occurs for the second list. Finally, the subject is asked to remember the first list without the reading phase. This final phase is called as short delayed independent recall (Phase I). Following this phase, the subject performs different tasks with a duration of 20 min. Then, the subject is again asked to recall the first list. This second part of the test is called as long delayed independent recall (Phase II).
Warrington topographic recognition memory test consists of 30 outdoor images being shown to the subjects while they were asked to respond to irrelevant questions. After this pro-cess, the subjects are asked to recognize the irrelevant images within a set containing both previously viewed as well as novel images (Mesulam2000).
Quantitative EEG
The quantitative EEG scores used in this study are the band power values delta, theta, alpha, and beta from the eyes-closed spontaneous resting state data. 19 channel EEG data were collected with a mean duration of 10 min for each subject with a sampling rate of 256 Hz. The EEG channels that are used in this study are Fp1, Fp2, F7, F3, Fz, F4, F8, T3, C3, Cz, C4, T4, T5, P3, Pz, P4, T6, O1, O2. Delta band power (0.1– 3.5 Hz), theta band power (4–7.5 Hz), alpha band power (8– 13 Hz), and beta band power (14–28 Hz) values were com-puted using 1-s time windows (epochs) with a 50 % overlap-ping, respectively. EEG is assumed as stationary in 1 s time windows. Hanning time window was used to suppress energy
infiltration through boundaries of epochs maxima. The power spectra of the filtered epochs are computed using the fast Fourier transformation algorithm. Then, the resulting spectral values were averaged over the trials and over channels for each frequency band. Thus, for each subject, each frequency band is represented with a scalar value. The alpha power values of the occipital channels were averaged to form the qEEG alpha metric. Mean power value of all electrodes were used to obtain the delta, theta, and beta qEEG metrics.
Image processing and analysis
Diffusion analysis and FA calculation was performed by in-house code, developed using Matlab 2009. The FA images were used as input to create the white matter skeleton using TBSS (Smith et al.2006). The skeleton maps are represented in the Results section, overlaid on T2 weighted MR images. Projected FA image of each subject was formed after the ap-plication of the TBSS process, and these images were used for statistical inferences.
The voxels having increased FA value in controls with respect to those measured for the subjects were analyzed. Voxelwise statistics has been performed on the skeletonised FA data using a permutation-based inference tool for nonpara-metric statistical thresholding in the randomise tool, provided in FSL package [(http://www.fmrib.ox.ac.uk/fsl/)]. Number of permutations and the significance threshold for patient-control differences was set at 5000 and p<0.05, respectively. The threshold free cluster enhancement (TFCE) option in FSL randomize toolbox was selected for the correction of multiple comparisons (Familywise Error Rate, p<0.05).
The relationship between the behavioral tests and FA im-ages was investigated using the previous pipeline including the covariate parameters of no interest as gender, age, educa-tion year, total white matter volume and risk factors such as presence of arterial hypertension, diabetes mellitus, cardiac failure which can be a risk factor for stroke, smoking and hyperlipemia. Moreover, for the patient group, volume of Fig. 1 Sample segmented images
from a patient and a control subject. Axial images are plotted for brain extracted T1 weighted MR, gray matter, white matter and CSF
the infarct was also used as a covariate. The effect of each behavioral test metric was analyzed using the GLM matrix formed with the addition of all covariates. Same analysis ap-proach is adopted for the linear regression using FA values as dependent variables and qEEG metrics as independent vari-ables. For each independent variable, a separate regression model was computed and the voxels correlated with the inde-pendent variables were obtained for patient and control groups independently.
Results
Structural MR images were obtained, and the thalamic stroke locations were identified by visual examination. The affected areas are shown with red circles in Fig.2for all subjects who suffer from thalamic stroke (8 Right, 7 Left). The FA value differences of the control and subject groups were analyzed after the TBSS processing, and the areas in which the FA values of controls are greater than the patients’ were explored. Control > patient contrast
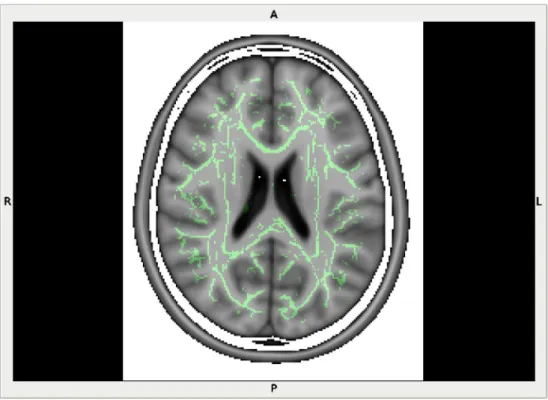
TBSS pipeline was performed on the entire FA dataset. Mean skeleton image can be seen in Figs.3and4.
The FA values computed for two groups of subjects were compared by using a tool based on permutation-based non-parametric inference which is implemented in the Randomise
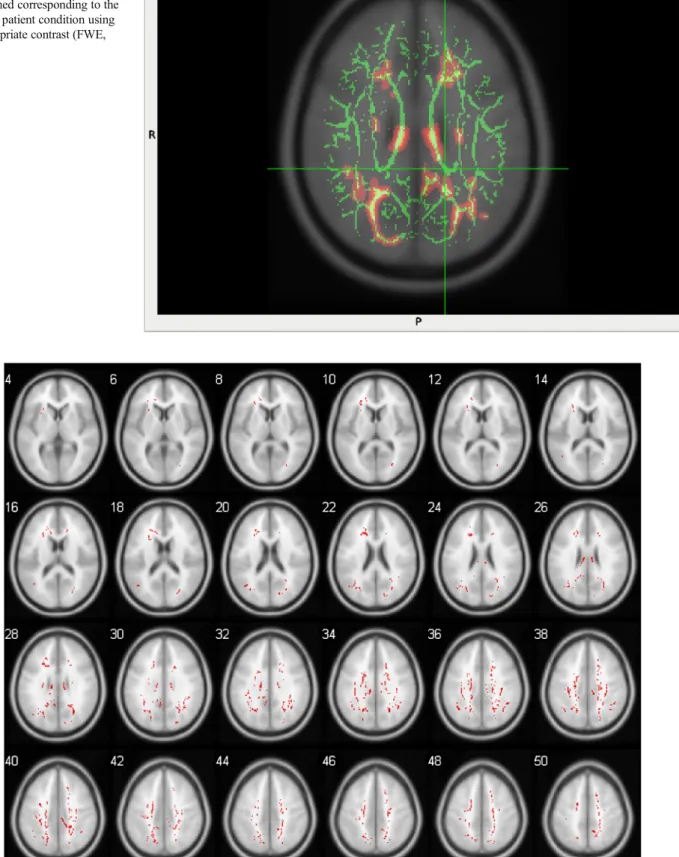
tool of FSL. Anatomical locations that have reduced FA in patients compared to normal controls were deduced using TBSS as shown in Figs. 5 and 6. The voxelwise statistics operation enabled us to find which FA skeleton voxels (Fig.3) vary between thalamic stroke patients and members of the control group. The p-value images were obtained after correction for multiple comparisons across space, and the FA voxels that have reduced values were identified (Family Wise Error (FWE) corrected, p<0.05) and reported in Table3.
The reduced skeleton values are localized in several areas, such as the body of the corpus callosum (BCC), superior co-rona radiata right/left (SCR-RL), superior longitudinal fascic-ulus right/left (SLF-RL), cingulum (cingulate gyrus) right/left (CGC-R), posterior corona radiata left (PCR-L), splenium of corpus callosum (SCC), anterior corona radiata right/left (ACR-RL), posterior thalamic radiation (includes optic radia-tion) left (PTR-L), the retrolenticular part of the internal cap-sule left (RLIC-L), posterior limb of internal capcap-sule right (PLIC-R), tapatum left (TAP-L) and in the anterior limb of the internal capsule left (ALIC-L).
Relationship between behavioral tests and FA skeletons None of the behavioral test results exceeded the multiple cor-rection threshold. However the uncorrected statistical results are reported in Table4. Benton face recognition test scores (BFR) of the subjects were used as a regressor set to explain the FA skeleton values. Regression analysis results indicate
that SCC and Cingulum, left (CGH-L) are correlated with the BFR for the patient group. Only SCC was found to be corre-lated within the control group.
The regression analyis was applied for the DST for both groups. FA values of the patient group were found to be cor-related in the areas of ALIC-RL, PCR-L and external capsule Fig. 3 Mean skeleton image
(green) deduced from 30 subjects’ data is overlaid on an axial structural image
Fig. 4 Mean skeleton image deduced from 30 subjects’ data is overlaid on a multislice axial structural image. High FAvalues of the skeleton are denoted with yellow, while red is used for lower FA values
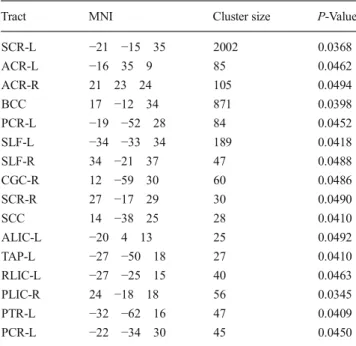
Fig. 5 Voxelwise statistics for two-group comparison are per-formed using GLM on aligned FA images, and the statistical maps are obtained corresponding to the control > patient condition using the appropriate contrast (FWE, p<0.05)
Fig. 6 Voxelwise statistics for two-group comparison are performed using GLM on aligned FA images, and the statistical maps are obtained corresponding to the control > patient condition using the appropriate
contrast (FWE, p<0.05). Results are overlayed on a structural T1 weight-ed image and visualizweight-ed on multiple axial slices
left (EC-L). ALIC-RL and EC-L were also correlated with the test scores in the control group.
The regression analysis for the CVLT (Phase I) using the skeleton of the patients showed related patterns in the genu of the corpus callosum (GCC), ACR-RL, and CGC-R. There were no significant correlations for the control group. A mod-ified version of the CVLT (Phase II) score results were regressed, and the areas of fornix (FX) and EC-RL were found to be correlated with the Phase II parameter for the patient group. No significant correlations were observed for the con-trol group.
The scores obtained with the Warrington Memory task were used as a regressor vector and correlation was observed in the middle cerebellar peduncle (MCP), BCC, CGH-R, SCR-RL and in SLF-R for the control group, whereas the FA values of SCR-RL, CGH-R, PCR-L and inferior fronto-occipital fasciculus right (IFO-R) were significantly correlated for the patient group.
Correlation between FA maps and quantitative EEG scores The FA values of the white matter regions of each subject were investigated and the correlation between the FA maps and the quantitative EEG scores were examined for both the control and patient groups independently. Similar to behavioral re-sults, none of the qEEG relations exceeded the corrected threshold and reported in Table5. When the delta band power values of the control subjects were used as a regressor vector, the FA values of the SCR-L showed correlation with the
regressor (uncorrected). There were no areas that are correlat-ed with the delta band of the patient group.
Theta band power of the control subjects was correlated with the FA values on the skeleton located in the BCC, CGC-L, and SLF-RL, while the FA values of the patient group were correlated with the BCC, EC-R, CGC-L, SLF-RL. It was observed that the FA values of SCC, RLIC-R, SCR-RL and PCR-L are correlated with the alpha band power belonging to the control group. The FA values of the patient group were correlated with the FA values in SCR-RL, BCC and PCR-L. Finally, the beta band power values and FA values of the control group were found to be correlated in PLIC-L, while FA values of ALIC-L, PLIC-RL and EC-R were correlated for the patient group.
Table 3 The results of the Control > Patient contrast after correction for multiple comparisons across space (Family Wise Error (FWE) corrected, p<0.05)
Tract MNI Cluster size P-Value
SCR-L −21 −15 35 2002 0.0368 ACR-L −16 35 9 85 0.0462 ACR-R 21 23 24 105 0.0494 BCC 17 −12 34 871 0.0398 PCR-L −19 −52 28 84 0.0452 SLF-L −34 −33 34 189 0.0418 SLF-R 34 −21 37 47 0.0488 CGC-R 12 −59 30 60 0.0486 SCR-R 27 −17 29 30 0.0490 SCC 14 −38 25 28 0.0410 ALIC-L −20 4 13 25 0.0492 TAP-L −27 −50 18 27 0.0410 RLIC-L −27 −25 15 40 0.0463 PLIC-R 24 −18 18 56 0.0345 PTR-L −32 −62 16 47 0.0409 PCR-L −22 −34 30 45 0.0450
Table 4 Multiple regression results for the relation of FA with behavioral tests (uncorrected)
Tract MNIx Cluster Size p-Value Group Benton face recognition test scores (BFR)
SCC −15 −40 25 16 0.008 Control CGH-L −21 −36 −8 29 <0.001 Patient SCC −16 −46 14 39 0.016 Patient Digit Span Test (DST)
EC-L −34 6 −8 20 0.024 Control ALIC-R 11 2 0 24 0.006 Control ALIC-L −11 0 4 20 0.024 Control ALIC-R 11 2 0 20 0.007 Patient ALIC-L −11 1 4 23 0.02 Patient PCR-L −25 −27 27 26 0.012 Patient EC-L −35 5 −8 22 0.008 Patient CVLT (Phase 1) GCC 0 32 5 17 0.023 Patient ACR-L −20 40 1 22 0.005 Patient ACR-R 17 36 6 18 0.03 Patient CGC-R 9 3 33 22 0.004 Patient CVLT (Phase 2) FX 0 −10 13 22 0.004 Patient
Warrington Memory task
PCR-L −25 −30 27 14 0.012 Patient SCR-L −26 −17 24 12 0.030 Patient SCR-R 27 −18 27 18 0.028 Patient IFO-R 42 −29 −12 10 0.010 Patient CGH-R 23 −25 −18 16 0.007 Patient MCP 21 −43 −36 26 0.016 Control BCC −9 −26 29 21 0.014 Control SCR-L −30 −14 25 18 0.007 Control SCR-R 22 −10 29 15 0.012 Control SLF-R 34 −19 34 16 0.020 Control CGH-R 21 −24 −19 22 0.002 Control
Discussion
Several case studies are reported about subjects who are suf-fering from thalamic stroke (Stenset et al.2007, Ro et al. 2007). The approach reported in our study, enable us to deal with a group of patients which can enhance to learn more about the structural connectivity and behavioral outputs of the subjects having thalamic lesions. Low number of the tha-lamic stroke patients is one of the disadvantages of our study. Therefore, a nonparametric version of multiple regression has been applied. Functional imaging measurements are carried out for the thalamic stroke patients to identify cortical and cerebellar metabolic rates using positron emission tomogra-phy (PET, Pappata 1989). As non-invasive techniques, EEG and fMRI has the unique capability for measuring the activity patterns forming in the brain. In the concept of this study, EEG is selected to deduce the level of electrical activity generated in the brain because of high temporal resolution. Anatomical variations of brain tissue can be measured via MR imaging,
non-invasively. Among the anatomical MR sequences, the structural connectivity patterns deduced from DTI can be used to identify changes that may occur due to a mental disorder. Generally, clinical DTI studies measure the data voxelwise, where the size of each voxel is on the order of millimeters, but it’s well-known that there are millions of fibers passing through each image voxel. As a measure of anatomical con-nectivity, FA values are used to define the fiber density. In this study, we examined structural changes of brain tissue in a group of patients who suffered from thalamic stroke. The dif-ferentiation of the structural fiber changes in patients com-pared to controls were investigated using FA values as a met-ric. The differences of FA values between the patient and control groups indicate that thalamic stroke impairs white matter distribution.
The regression analysis based on the neurophysiological test scores implicates several white matter areas. Further, the neurophysiological test scores of the two groups are regressed with the FA values to analyze behavioral responses.
Performance on the DST is likely related with the areas of both left and right cerebral structures, and during working memory tasks, parietal areas are activated. In our analyses, significant correlation values were found between the white matter FA values and the DST scores in bilateral areas for the patients (uncorrected, p<0.05). Similar areas were also found in the control group. These results for the working memory and episodic memory tasks are in agreement with the findings of Bendlin et al. (2010). The inferior fronto-occipital fascicu-lus is known to be related with visual memory tasks, and we observed significant relationships.
BFR test functions are related with parietal, occipitoparietal, and occipitotemporal areas in the right hemisphere structures (Tranel et al. 2009). It is known that the fibers in the SCC connect the occipital and parietal cortices, and also connect the inferior and medial temporal regions. Our findings for both groups showed that FA values in the SCC were correlated with the test scores as expected.
Warrington’s Recognition Memory Test performance has been shown to be related to activation in the right temporal lobe (Kiernan2012). The CGH-R was found to be correlated with test scores having the maximum t-score, which can be taught to be a part of memory process and connected with parts of the temporal lobe.
Apart from the neurophysiological correlation analysis, resting state eyes-closed EEG data of the subjects were also used to investigate the relationship with the FA maps. In eyes-closed EEG measurements, it was observed that the major theta band contribution was from the frontal electrodes. The overall EEG theta band activity computed by averaging the band powers of all electrodes had similar values with those obtained using just the frontal electrodes. Thus, in the regres-sion analysis, the average of all electrodes was used to repre-sent the resting state theta activity. Resting state theta band Table 5 Regression results between FA values and EEG band powers
(uncorrected)
Tract MNI Cluster Size p-Value Group Delta Band SCR-L −27 −12 30 44 0.015 Control Theta Band SLF-L −38 −11 29 42 <0.001 Control CGC-L −9 −4 36 22 0.007 Control BCC −11 −7 34 18 0.010 Control SLF-R 35 −5 24 36 0.002 Control SLF-L −39 −9 24 33 0.004 Patient SLF-R 35 −5 24 25 0.026 Patient CGC-L −9 −4 36 18 0.012 Patient BCC −12 −6 35 13 0.016 Patient EC-R 32 5 −8 25 0.022 Patient Alpha Band SCR-L −22 −23 24 38 0.004 Control SCR-R 29 −23 23 24 0.006 Control PCR-L −26 −25 26 20 0.013 Control RLIC-R −27 −25 6 21 0.010 Control SCC −11 −46 16 18 0.036 Control SCR-R 30 −19 22 18 0.001 Patient SCR-L −27 −16 22 22 0.032 Patient PCR-L −25 −20 22 36 0.007 Patient BCC 8 −29 25 20 0.002 Patient Beta Band PLIC-L −23 −18 13 10 0.028 Control PLIC-L −27 −14 −15 16 0.010 Patient PLIC-R 25 −22 17 22 0.007 Patient ALIC-L −21 7 16 14 0.018 Patient EC-R 31 6 −5 12 0.020 Patient
activity of the EEG has been reported to be related with the default mode network activity that is deduced by the analysis of the functional MR images collected during the rest period (Scheeringa et al.2008). Horn et al. (2014) identified that the cingulum bundle and the corpus callosum stand as the main white matter areas that form the structural connection within the functional default mode network.
The bilateral superior longitudinal fasiculus, cingulum, and corpus callosum were the main areas that were correlated with the theta band power values of both the patient and control groups. The SLF connects neurons from the back to the front of the cerebrum in a bidirectional way. Some of the portions of the SLF terminate in the prefrontal cortex and in the dorsolat-eral prefrontal cortex. Our findings suggest that the resting state theta band changes might be related due to the changes in the FA values observed in the SLF, cingulum bundle, and corpus callosum.
The most prominent channels that represent the alpha power changes were observed in the occipital area. Thus, the EEG band power values were computed during the eyes closed pe-riod of the subjects and two occipital channels (O1 and O2) were used to denote the alpha band. Alpha power peak values were found to be positively correlated with FA values in the bilateral posterior and superior corona radiata (Valdés-Hernández et al. 2010). As it is thought that the cortico-thalamocortical cycles are related to change in the alpha fre-quency, our findings support this phenomenon, where the max-imum t-score obtained from multiple regression analysis was localized in the superior corona radiata for both patient and control groups for the alpha band power values.
Skeleton maps used in the study enabled us to discover the FA differences of thalamic stroke patients from those of the normal control group. The findings of this study demonstrate that FA value changes are correlated with neurophysiological test scores, and also with quantitative scores deduced using the ongoing resting EEG data.
Conflict of Interest Adil Deniz Duru, Dilek Göksel Duru, Sami Yumerhodzha, and Nerses Bebek declare that they have no conflicts of interest.
Informed Consent All procedures performed in studies involving hu-man participants were in accordance with the ethical standards of the insti-tutional and/or national research committee and with the 1964 Helsinki declaration and its later amendments or comparable ethical standards.
References
Ashburner, J., & Friston, K. J. (2000). Voxel-based morphometry - the methods. NeuroImage, 11, 805–821.
Bai, F., et al. (2009). Abnormal integrity of association fiber tracts in amnestic mild cognitive impairment. Journal of the Neurological Sciences, 278, 102–106.
Baird, A. A., Colvin, M. K., VanHorn, J. D., Inati, S., & Gazzaniga, M. S. (2005). Functional connectivity: integrating behavioral, diffusion tensor imaging, and functional magnetic resonance imaging data sets. Journal of Cognitive Neuroscience, 17(4), 687–693. Basser, P. J., Pajevic, S., Pierpaoli, C., Duda, J., & Aldroubi, A. (2000).
In vivo fiber tractography using DT-MRI data. Magnetic Resonance in Medicine, 44(3), 625–632.
Bendlin, B. B., Fitzgerald, M. E., Ries, M. L., Xu, G., Kastman, E. K., et al. (2010). White matter in aging and cognition: a cross-sectional study of microstructure in adults aged eighteen to eighty-three. Developmental Neuropsychology, 35(3), 257–277.
Ciccarelli, O., Werring, D. J., Barker, G. J., Griffin, C. M., et al. (2003). A study of the mechanisms of normal-appearing white matter damage in multiple sclerosis using diffusion tensor imaging–evidence of Wallerian degeneration. Journal of Neurology, 250(3), 287–92.
Ciccarelli, O., Behrens, T. E., Johansen-Berg, H., Talbot, K., et al. (2009). Investigation of white matter pathology in ALS and PLS using tract-based spatial statistics. Human Brain Mapping, 30, 615–624. Horn, A., Ostwald, D., Reisert, M., & Blankenburg, F. (2014). The
struc-tural–functional connectome and the default mode network of the human brain. NeuroImage, 102(1), 142–151.
Johansen-Berg, H., & Behrens, T. E. (2006). Just pretty pictures? What diffusion tractography can add in clinical neuroscience. Current Opinion in Neurology, 19(4), 379–385.
Jones, D. K., Horsfield, M. A., & Simmons, A. (1999a). Optimal strate-gies for measuring diffusion in anisotropic systems by magnetic resonance imaging. Magnetic Resonance in Medicine, 42, 515–525. Jones, D. K., Simmons, A., Williams, S. C. R., & Horsfield, M. A. (1999b). Non-invasive assessment of axonal fiber connectivity in the human brain via DTMRI. Magnetic Resonance in Medicine, 42, 37–41.
Kiernan, J. A. (2012). Anatomy of the temporal lobe. Epilepsy Research and Treatment. doi:10.1155/2012/176157.
Le Bihan, D., Mangin, J. F., Poupon, C., Clark, C. A., Pappata, S., et al. (2001). Diffusion tensor imaging: concepts and applications. Journal of Magnetic Resonance Imaging, 13, 534–546.
Mazziotta, J. C., Toga, A. W., Evans, A., Fox, P., & Lancaster, J. (1995). A probabilistic atlas of the human brain: theory and rationale for its development. NeuroImage, 2, 89–101.
Mesulam, M. M. (2000). The thalamus. In Principles of behavioral and cognitive neurology (2nd ed., pp. 71–76). New York: Oxford University Press.
Mori, S., Crain, B. J., Chacko, V. P., & van Zijl, P. C. M. (1999). Three-dimensional tracking of axonal projections in the brain by magnetic resonance imaging. Annals of Neurology, 45, 265–269.
Pappata, S., Mazoyer, B., Tran Din, S., Cambon, H., Levasseur, M., & Baron, J. C. (1990). Effects of capsular or thalamic stroke on me-tabolism in the cortex and cerebellum: a positron tomography study. Stroke, 21, 519–524.
Reijmer, Y. D., et al. (2013). Microstructural white matter abnormalities and cognitive functioning in type 2 diabetes, a diffusion tensor im-aging study. Diabetes Care, 36, 137–144.
Rimkus, C. M., Junqueira, T. F., Lyra, K. P., et al. (2011). Corpus callosum microstructural changes correlate with cognitive dysfunc-tion in early stages of relapsing-remitting multiple sclerosis: axial and radial diffusivities approach. Multiple Sclerosis International.
doi:10.1155/2011/304875.
Ro, T., Farnè, A., Johnson, R. M., Wedeen, V., Chu, Z., Wang, Z. J., Hunter, J. V., & Beauchamp, M. S. (2007). Feeling sounds after a thalamic lesion. Annals of Neurology, 62, 433–441.
Sasson, E., et al. (2012). Structural correlates of cognitive domains in normal aging with diffusion tensor imaging. Brain Structure and Function, 217, 503–515.
Scheeringa, R., Bastiaansen, M. C. M., Petersson, K. M., Oostenveld, R., et al. (2008). Frontal theta EEG activity correlates negatively with
the default mode network in resting state. International Journal of Psychophysiology, 67, 242–251.
Smith, S. M., Jenkinson, M., Woolrich, M. W., Beckmann, C. F., Behrens, T. E. J., et al. (2004). Advances in functional and structural MR image analysis and implementation as FSL. NeuroImage, 23(S1), 208–219.
Smith, S. M., et al. (2006). Tract-based spatial statistics: voxelwise anal-ysis of multi-subject diffusion data. NeuroImage, 31(4), 1487–1505. Stenset, V., Grambaite, R., Reinvang, I., Hessen, E., Cappelen, T., Bjørnerud, A., Gjerstad, L., & Fladby, T. (2007). Diaschisis after thalamic stroke: a comparison of metabolic and structural changes in a patient with amnesic syndrome. Acta Neurologica Scandinavica, 115, 68–71.
Tranel, D., Vianna, E., Manzel, K., Damasio, H., & Grabows, T. (2009). Neuroanatomical correlates of the Benton facial recognition test and judgment of line orientation test. Journal of Clinical and Experimental Neuropsychology, 31(2), 219–233.
Trinka, E., Unterrainer, J., Staffen, W., Löscher, N. W., & Ladurner, G. (2000). Delayed visual P3 in unilateral thalamic stroke. European
Journal of Neurology, 7, 517–522. doi:10.1046/j.1468-1331.2000.
t01-1-00117.x.
Valdés-Hernández, P. A., Ojeda-González, A., Martínez-Montes, E., Lage-Castellanos, A., et al. (2010). White matter architecture rather than cortical surface area correlates with the EEG alpha rhythm. NeuroImage, 49, 2328–2339.
Wang, D., Qin, W., Liu, Y., Zhang, Y., Jiang, T., & Yu, C. (2013). Altered white matter integrity in the congenital and late blind people. Neural Plasticity. doi:10.1155/2013/128236.
Watts, R., Liston, C., Niogi, S., & Ulug, A. M. (2003). Fiber track-ing ustrack-ing magnetic resonance diffusion tensor imagtrack-ing and its applications to human brain development. Mental Retardation and Developmental Disabilities Research Reviews, 9(3), 168– 177.
Yin, D., Yan, X., Fan, M., Hu, Y., Men, W., et al. (2013). Secondary degeneration detected by combining voxel-based morphometry and tract-based spatial statistics in subcortical strokes with different outcomes in hand function. American Journal of Neuroradiology, 34(7), 1341–1347.