1063 J. Oleo Sci. 68, (11) 1063-1071 (2019)
Effect of Varieties on Bioactive Properties and
Mineral Contents of Some Sorghum, Millet and Lupin
Seeds
Fahad Al Juhaimi
1*, Şenay Şimşek
2, Kashif Ghafoor
1, Elfadil E. Babiker
1,
Mehmet Musa Özcan
3*, Isam A Mohamed Ahmed
1, and Omer Alsawmahi
11
Department of Food Science & Nutrition, College of Food and Agricultural Sciences, King Saud University, Riyadh, SAUDI ARABIA 2 Department of Plant Sciences, Cereal Science Technology, North Dakota State University, Fargo, US
3 Department of Food Engineering, Faculty of Agriculture, Selçuk University, 42079 Konya, TURKEY
1 Introduction
Sorghum is one of the most important cereal grain and ranks fifth after wheat, rice, maize and barley. The kernel of sorghum varies in colour, shape, size and certain ana-tomical components1). The colour of sorghum grains varies
from white to dark brown depending on the phenolic pig-ments present. Anthocyanogens have been detected in yellow millo and red kafir sorghum but not in white waxy or yellow endosperm, varieties2). Nutritionally, sorghum and other cereal proteins are deficient in essential amino acids such as lysine, tryptophan and threonine1). Food grains are the major ingredients used for producing various food products such as oil, starch and glucose3, 4). Lupin belongs to Leguminosae family, and is an important
*Correspondence to: Fahad Y. AL-juhaimi, Department of Food Science & Nutrition, College of Food and Agricultural Sciences,
King Saud University, Riyadh, SAUDI ARABIA E-mail: [email protected]
Accepted July 29, 2019 (received for review April 26, 2019)
Journal of Oleo Science ISSN 1345-8957 print / ISSN 1347-3352 online
http://www.jstage.jst.go.jp/browse/jos/ http://mc.manusriptcentral.com/jjocs
legume used for the production of both human and animal foods since the ancient times5). However, a significant
re-duction in objectionable compounds such as tannins, alka-loids and oligosaccharides is essential before its consump-tion6, 7). The use of lupin oil as food ingredient is due to the
presence of oil in varieties Lupinus albus and Lupinus
mutabilis at levels around 110 and 190 g/kg respectively in
the varieties7). Lupin flour is being used as a foaming agent in food instead of egg albumin8). Several studies have re-ported about the chemical composition and nutritive value of sorghum, millets and lupin seeds originating from differ-ent geographical regions around the globe1, 9). The aim of this study was to determine some physico-chemical prop-erties, amino acids, fatty acids, sugars and mineral contents
Abstract: In this study, some physico-chemical properties, amino acids, fatty acids, sugars and mineral contents of sorghum, millet and lupin seeds. Sorghum (red, white and yellow) and millet seeds were purchased from market in Saudi Arabia (Riyadh). Lupin seeds were provided from in Turkey (Konya). Protein contents of seed samples ranged from 8.6% (yellow sorghum) to 37.7% (lutop) (p < 0.05). The extractable phenolics contents for gallic acid equivalent (GAE) of grains ranged between 1.43 mgGAE/g (white sorghum) to 8.23 mgGAE/g (red sorghum), and hydrolysable phenolics contents for GAE of grains varied between 1.48 mgGAE/g (white sorghum) to 26.10 mgGAE/g (red sorghum (p < 0.05). Total phenol contents of seeds were found between 2769 mg GAE/g (bablon) to 6087 mgGAE/g (yellow sorghum) (p < 0.05). Amino acid contents of millet changed between 0.02% (ornithine) and 2.07% (glutamic acid), while amino acid contents of yellow sorghum range from 0.02% (hydroxyproline) to 1.71% (glutamic acid), amino acid values of white sorghum changed between 0.02% (hydroxyproline) and 2.21% (glutamic acid), amino acid values of lutop seed changed between 0.02% (ornithine) and 6.77% (glutamic acid) (p < 0.05).While the oleic acid contents change between 25.27% (white sorghum) and 53.50% (Bablone), linoleic acid contents ranged from 14.60% (Bablone) to 42.67% (Millet) (p < 0.05). However, the amount of potassium in the seeds varied between 1831.34 mg/kg (while sorghum) and 11895.8 mg/kg (Lutop). Generally, protein, oleic acid, amino acid and mineral contents of lupin varieties were higher as compared to those of millet phenol, anthocyanin and sorghum seeds.
1064
of sorghum, millet and lupin seeds.
2 Material and Methods
2.1 Material
Sorghum(red, white and yellow)and millet seeds were purchased from market in Riyadh in Saudi Arabia. Lupin seeds(Bablon, Deşdiğin and Bablone cv)used were sup-plied by herbarium in the Department of Field Crops, Faculty of Agriculture, Selcuk University in Turkey. The seeds were cleaned, sorted and dried in other to remove all dirts. The pericarps were removed manually from the seeds and the seeds were then packed in polypropylene bags and stored in refrigerator.
2.2 Methods
2.2.1 Proximate analysis
The moisture, protein and ash content of the samples were determined according to AACC methods 44-15.02, 08-01.01 and 46-30.01. The moisture content was deter-mined by heating the samples in a gravity oven for 1 hour at 135℃. The ash content was estimated by heating the sample in a muffle furnace at 525℃ for approximately 16 hours. The crude protein content of the samples were measured using nitrogen combustion method according to AACC International10)method. Leco combuston analyzer was used to determine the protein content of the samples and conversion factor of 6.25 was used. Total starch was measured using AACC approved method 76-13.01, using an assay kit from Megazyme(Megazyme International, Ireland). The samples were incubated with heat stable fungal α-amylase and amyloglucosdiase to hydrolyze the starch to glucose. The glucose was treated with glucose oxidase/peroxidase(GOPOD)and the absorbance was read at 492 nm. The starch content was calculated based on the glucose concentration11). Total fat content was determined
according to AOCS method Ba 3-38. Soxhlet apparatus was used to extract fat from the millet sample for 3 hours and n-Hexane was used as the solvent12).
2.2.2 Extractable polyphenols
The extraction was done by continuous shaking using methanol. Acidified water(50:50 v/v, pH 2, 50 mL/g sample, 60 min, room temperature)with HCL and acetone: water 70:30 v/v, 50 mL/g sample, 60 min, room temperature)were used. Samples were centrifuged(15 min, 25℃, 3000 g)and combined supernatants were analyzed for extractable polyphenols. Ferulic acid and gallic acid were used to prepare standard curves. Extractable polyphenols were determined by the Folin-Ciocalteu procedure13)and
quanti-fied as miligram ferulic acid equivalents per gram(mg FAE/ g)and milligram gallic acid equivalents per gram(mg GAE/ g).
2.2.3 Hydrolysable polyphenols
Acidic hydrolysis can be used to extract tannis, hydroxy-cinnamic acids and phenolic acids from food materials composed of polyphenols. Tannis, hydroxycinnamic acids and phenolic acids were extracted from the samples using methanol/H2SO4 hydrolysis for 20 h 85℃ using the residues
of material used for the determination of soluble polyphe-nols14), centrifugation(3000×g)for 15 min at 25℃ was
done after extraction. Folin Ciocalteu method using ferulic acid standard curve were combined with the supernatant13)
was used for the hydrolysable polyphenols analysis which were presented as miligram ferulic acid equivalents per gram(mg FAE/g)and milligram gallic acid equivalents per gram(mg GAE/g).
2.2.4 Sugar composition
The free sugar composition was determined by chroma-tography technique according to Kakehi and Honda15). 2.2.5 Amino acid analysis
Amino acid profile analysis was carried out using AOAC Official Method 982.30 E(a,b,c)described by International AOAC et al.16). Acid hydrolysis, performic acid oxidation
followed by acid hydrolysis and alkaline hydrolysis was conducted prior to amino acid analysis. Samples were hy-drolyzed with 6M HCl after freezing in a dry ice-alcohol bath under vacuum. The samples were heated at 110℃ for 24 hours before filtering through Whatman No. 1 filter paper. Then the sample is rinsed with water three times and filtered in between each rinse. Cold performic acid was added to a second portion of sample and held overnight at 0-5℃ prior to adding cold HBr and 1-octanol. The sample was mixed in an ice-water bath and evaporated to dryness at 40℃ under vacuum. HCl was then added and hydrolysis was done as stated above. A third portion of sample was added to a tube having a Nalgene polypropylene centrifuge tube liner. Potato starch was added to samples with low starch content, and fresh 4.2M NaOH and 1-octanol was added. The sample was mixed under partial vacuum prior to freezing in a dry ice-alcohol bath. The third portion of sample was then hydrolyzed for 22 hours at 110℃ and then cooled before transferring to a 5 ml volumetric flask containing 6M HCl. Each hydrolysate was analyzed in an amino acid analyzer.
2.2.6 Fatty acid determination
The fatty acid profile determination was done using AOAC methods 996.06, 965.49 and 969.33 as described by International AOAC et al.16). They were analysed gas chro-matography(HP 6890)equipped with flame-ionization detector(FID)and capillary column(60 m×0.25 mm i.d.; film thickness 0.20 micrometere). The temperature of in-jection block and dedector was 260℃. It was operated under the following conditions: oven temperature program. 175℃ for 7 min. Raised to 250℃ at a rate 5℃/min and than kept at 250℃ for 15 min); injector and detector tempera-tures, 250 and 250℃; respectively, carrier gas. nitrogen at
1065
flow rate of 1.51 mL/min; split ratio. 1/50 μL/min.
2.2.7 Total phenolic, flavonoid and anthocyanin contents determination
Quantification of anthocyanins was based on the method of Ticconi et al.17). Propanol, chlorhydric acid, and water in
ratio 18:1:81 in solution was homogenized with 0.5 g of the sample. The homogenates that result were heated in water bath for 3 min, allowed to boil and then incubated for 24 h in a dark room at room temperature. The supernatants(3 mL each)were centrifuged for 40 min at 6500 rpm and the absorbance was recorded at 535 and 650 nm. The phenolic content of the samples were extracted using methanol and quantified with spectrophotometer absorbance at 765 nm using Folin-Ciocalteu reagent(FCR)as described by Madaan et al.18). Gallic acid standard curve was constructed and used to evaluate the total phenolic, which was ex-pressed using gallic acid equivalent. 10 mg of gallic acid and 100 mL of having 50% methanol μg/mL were mixed, followed by dilution in concentration of 12.5, 25, 50 or 100 μg/mL. An aliquot of 0.076 mL from each of this dilution was kept in a glass tube and diluted further to a final volume of 0.76 mL using distilled water. About 0.12 nL of Folin-Ciocalteu reagent(1 N)was added and the samples were held at room temperature for 5 min incubation after which 0.32 mL of Na2CO(20% w/w)was added and total 3
volume in test tubes made 2 mL each using distilled water. The samples and standard mixtures prepared in the same manner were vortexed and allowed to stand at room tem-perature for 30 min, after which the optical activity at 765 nm was measured using UV/VIS spectrophotometer (Schi-madzu, Japan)using distilled water as blank. Dilute metha-nolic extracts of 0.76 mL was used for the estimation of the plant samples in test tubes. The same approach was used for the standard.
The method described by Dewanto et al.19)was used to
determine the total flavonoids in the samples. In the proce-dure, distilled water was thoroughly mixed with methanol extracts, followed by addition of NaNO2 solution was to
every test tube. AlCl3 solution was later added after 5 min.
The samples were kept for six minutes and 1 M NaOH was added. Total volume of the mixture was made to 5 mL by addition of distilled water and the tubes were vigorously stirred. The resulting solution was pink-colored and its ab-sorbance determined using spectrophotometer at 510 nm against the blank. Catechol was used to construct the cali-bration curve and the flavonoids in the sample were ex-pressed as mg Catechol equivalents per gram of dry weight (mg CE/g DW).
2.2.8 Mineral determination
Cabinet drier operating at 70℃ was used to dry the seeds to constant weight. Microwave(Cem-MARS Xpress) was used to digest about 0.5 g of the ground seed samples using 5 ml of 65% HNO3 and 2 ml of 35% H2O2. The volume
of the digested samples was made to 20 ml using deionized water. The minerals in the sample was then quantified using ICP-AES(Varian-Vista, Australia)20)
. 2.2.9 Statistical analyses
Analysis of variance(ANOVA)was conducted using JMP version(SAS Inc., Cary, N.C U.S.A). Analyses were carried out three times and the results are mean±standard devia-tion(MSTAT C)of independent several seed samples21).
3 Results and Discussion
3.1 Proximate composition of millet, sorghum and lupin seeds
The proximate properties of sorghum, millet and lupin seeds are given in Table 1. Moisture contents of samples changed between 5.84%(Bablone)and 8.42%(Yellow Sorghum). The moisture contents showed slight differenc-es which were ldifferenc-ess than the moisture contents of maize, wheat, rice, pear millet and were determined as 14%, 12%, 9%, 10% and 14% respectively under similar condi-tions2). The ash contents of samples were found between
1.5%(Yellow Sorghum)and 2.2%(Bablone). Protein Table 1 Proximate analysis of millet, sorghum and lupin seeds(%, Dry weight basis; n:3).
Moisture Ash Protein Oil Starch Seeds Millet 6.99±1.01*c 1.74±0.17b 11.7±1.23d 13.3±1.67a 65.8±2.69d Yellow sorghum 8.42±0.99a** 1.50±0.21e 8.6±1.12f 9.8±1.74d 74.5±2.85a White sorghum 7.10±0.87b 1.68±0.32c 10.9±1.28e 11.7±1.89b 70.7±1.69bc Red sorghum 7.00±0.89b 1.61±0.2cd 12.6±1.72d 9.5±0.79e 71.4±2.93b Lutop (Lupin) 6.01±0.98cd 1.97±0.21a 37.7±1.28a 8.3±0.76f 0.5±0.09e Bablone (Lupin) 5.84±0.56d 2.23±0.32a 32.9±1.19c 11.7±1.13b 0.4±0.06ef Deşdiğin (Lupin) 5.99±0.73d 1.58±0.28de 35.5±2.08b 10.9±1.21c 0.4±0.08ef
*mean±standard deviation;** Values within each row followed by different letters are significantly different (p < 0.05)
1066
content changed between 8.6%(yellow sorghum)and 37.7%(lutop), while oil contents of samples change between 8.3%(Lutop)and 13.3%(Millet). In addition, starch contents of samples ranged from 0.4%(Deşdiğin)to 74.5%(Yellow Sorghum). Lupinus albus contained 3% starch5). The oil contents of sorghum and millet seeds were
determined as 3.95 to 5.63%, respectively22). The oil
content of sorghum obtained in this study were greater than the values obtained by Osman et al.22). Several lupin
varieties contained 30.6-37.9% protein and 8.54-14.64% oil; 1.21-3.09 g/100 g sucrose, 2.81-4.53 g/100 g starch23). The starch content of lupin seeds varied between 12 and 15% and larger amounts of dissolvable non-starch polysac-charides(30-40%)24)
. Some varieties of lupin contained 6.55-7.03% moisture and 29.33-37.07% protein25)
. Marti-nez-Villaluenga et al.23)and Guemes-Vera et al.25)reported that lupin serves as a good source of vitamins, minerals, lipids, proteins and dietary fibres. Ullah et al.26)reported that proximate compositions of some maize varieties ranged between 9.201-10.90% moisture content, 0.7-1.3% ash, 3.21-7.71% fats, 7.71-14.60% proteins, and 0.80-2.32% crude fibre and 69.659-74.54% carbohydrates. Chukwu et al.1)reported that Brown and white guinea corn
contained 5.03% and 3.03% oil, 10.80% and 10.00% (encent yellow sorghum)crude protein and 1.87% and
1.97% ash, respectively. The oil and protein content re-ported in this study for all samples are higher than those of brown and white guinea corn. However, the ash contents are lower than those of both guinea corns and rice, wheat and maize1).
3.2 Bioactive compounds in millet, sorghum and lupin seeds
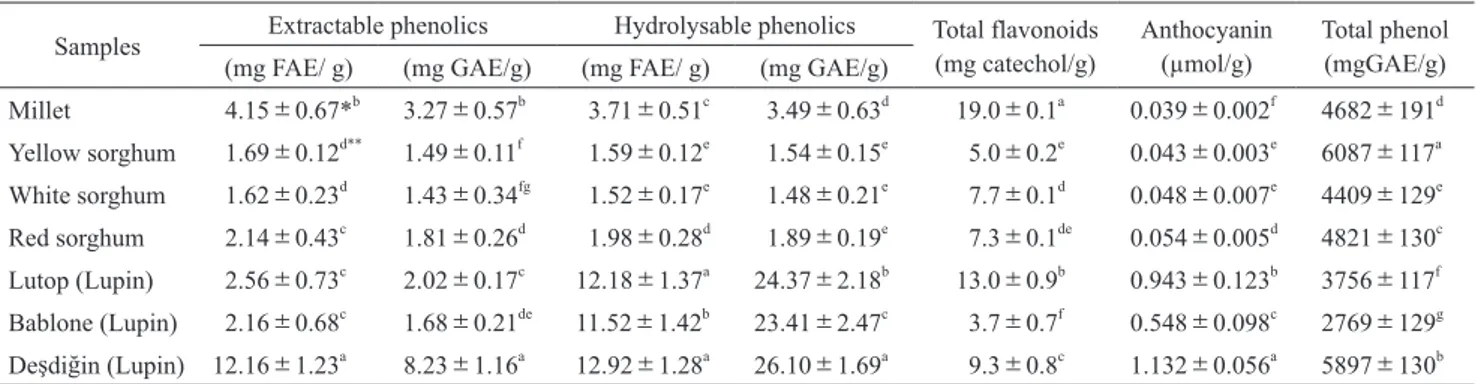
Table 2 shows the extractable and hydrolysable pheno-lics, total phenopheno-lics, total flavonoid and anthocyanin con-tents of millet, sorghum and lupin seeds. The table showed that the lupin seeds had higher extractable and hydrolsable phenolics than sorghum and millet seeds. While extractable phenolics contents for FAE and GAE of grains change
between 1.62 mg FAE/g(White Sorghum)to 12.16 mg FAE/ g
(Deşdiğin)and 1.43 mgGAE/g(white sorghum)to 8.23 mgGAE/g(Red Sorghum), and hydrolysable phenolics con-tents for FAE and GAE of grains varied between 1.52 mg FAE/g(White Sorghum)and 12.92 mg FAE/g(Red Sorghum)and 1.48 mgGAE/g(White Sorghum)to 26.10 mgGAE/g(Red Sorghum). It was observed statistically sig-nificant differences among bioactive compounds of seed”s (p<0.05). While total phenolic contents of seeds change
between 2769 mgGAE/g(Bablone)and 6087 mgGAE/g (Yellow Sorghum), total flavonoid contents of seed samples
ranged from 3.7 mg catechol/g(Bablone)to 19.0 mg cate-chol/g(Millet). In addition, anthocyanin contents of seed samples were found between 0.039 μmol/g(Millet)and 1.132 μmol/g(Deşdiğin).
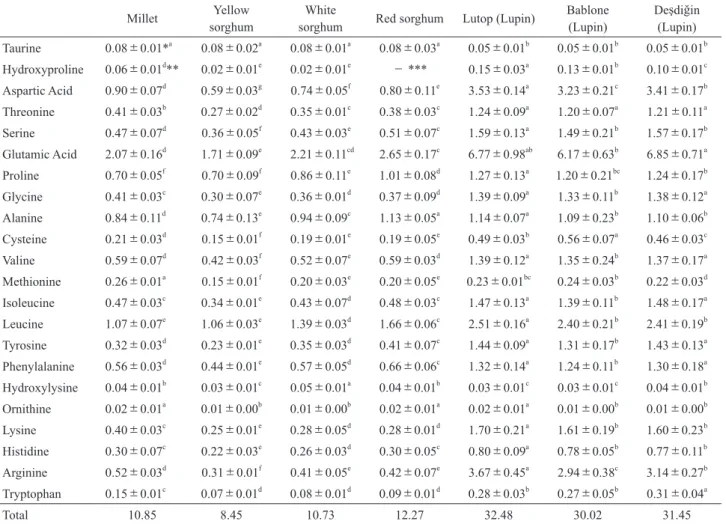
3.3 Amino acid composition of millet, sorghum and lupin seeds
Amino acid contents of millet, sorghum and lupin seeds are given in Table 3. Amino acid contents of millet changed between 0.02%(ornithine)and 2.07%(glutamic acid), while amino acid contents of yellow sorghum range from 0.02%(hydroxyproline)to 1.71%(glutamic acid), amino acid values of white sorghum changed between 0.02%(hy-droxyproline)and 2.21%(glutamic acid), amino acid values of lutop seed changed between 0.02%(ornithine)and 6.77%(glutamic acid). While amino acid contents of red sorghum changed between 0.02%(ornithine)to 2.65% (glutamic acid), lupin(Deşdiğin)seed changed between
0.01%(ornithine)and 6.85%(glutamic acid). Glutamic acid was established as the most abundant amino acid in all samples. The amino acids values obtained varied between 8.45%(Yellow Sorghum)to 32.48%(lutop). Chukwu et al.1)
reported that nutritionally, proteins in sorghum and other cereals are deficient in some essential amino acids such as lysine, threonine and tryptophan. However, the amino acids in lupin seeds have better amino acid profile27). Lupin
contains significant amount of lysine, but lack the essential amino acids methionine and cysteine. They are considered Table 2 Extractable, hydroly sable phenolics, total flavonoid, phenol and anthocyanin contents of millet, sorghum and
lupins(n:3).
Samples Extractable phenolics Hydrolysable phenolics Total flavonoids (mg catechol/g) Anthocyanin (µmol/g) Total phenol(mgGAE/g)
(mg FAE/ g) (mg GAE/g) (mg FAE/ g) (mg GAE/g)
Millet 4.15±0.67*b 3.27±0.57b 3.71±0.51c 3.49±0.63d 19.0±0.1a 0.039±0.002f 4682±191d Yellow sorghum 1.69±0.12d** 1.49±0.11f 1.59±0.12e 1.54±0.15e 5.0±0.2e 0.043±0.003e 6087±117a White sorghum 1.62±0.23d 1.43±0.34fg 1.52±0.17e 1.48±0.21e 7.7±0.1d 0.048±0.007e 4409±129e Red sorghum 2.14±0.43c 1.81±0.26d 1.98±0.28d 1.89±0.19e 7.3±0.1de 0.054±0.005d 4821±130c Lutop (Lupin) 2.56±0.73c 2.02±0.17c 12.18±1.37a 24.37±2.18b 13.0±0.9b 0.943±0.123b 3756±117f Bablone (Lupin) 2.16±0.68c 1.68±0.21de 11.52±1.42b 23.41±2.47c 3.7±0.7f 0.548±0.098c 2769±129g Deşdiğin (Lupin) 12.16±1.23a 8.23±1.16a 12.92±1.28a 26.10±1.69a 9.3±0.8c 1.132±0.056a 5897±130b
1067
to be a good source of lysine, and are generally poor in the sulfur-containing amino acids(methionine and cystein)5)
. Gross et al.28)that the seed of Lupinus mutabilis con-tained 51.0-52.6% protein and 16.0-16.2% lipids. Also these seeds contained 9.8-10.3(g amino acid/16 g N)aspar-tic, 5.1-5.3 serine, 22.8-23.8 glutanic acid, 9.1-9.3 organine, 6.8-6.9 leucinne, 3.9-3.7 glycine, 3.8-3.7 proline and 5.2-5.3 lycine28). Our results were found partially different
com-pared to literatüre values. These differences can be peoba-bly due to location, growing conditions, maturation and harvest time.
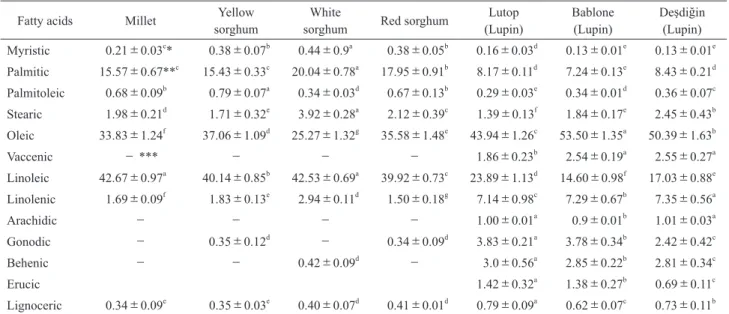
3.4 Fatty acid composition of millet, sorghum and lupin seeds
Fatty acid compositions of millet, sorghum and lupin seed oils are presented in Table 4. Palmitic, stearic, oleic, linoleic and linolenic acids were major fatty acids of seed samples. Palmitic acid contents of samples ranged from 7.24%(Yellow Sorghum)to 20.04%(white sorghum). While oleic acid contents change between 25.27%(white sorghum)and 53.50%(bablone), linoleic acid contents
ranged from 14.60%(Bablone)to 42.67%(millet). Linole-nic acid contents of samples were found between 1.50% (Red Sorghum)to 7.35%(Deşdiğin). Generally, oleic and
linolenic acid contents of lupin seed oils were found high compared to sorghum and millet seed oils, palmitic and lin-oleic acid contents were found low. It was observed statisti-cally significant differences among fatty acid compositions of seed oils(p<0.05). Unprocessed sorghum oil contains palmitic(12.10 to 13.41%), palmitoleic(0.47 to 1.31%), stearic(1.13 to 1.36%), oleic(33.64 to 40.35%), linoleic (42.33 to 49.94%), linolenic(1.53 to 1.72%), arachidic (0.10 to 0.18%)and eicosenoic acid(0.24 to 0.39% of total
lipid)29)
. However, the sorghum grain oils contain palmitic acid(11.73-20.18%)and stearic acid(1.09-2.59%)30)
. Pal-mitic acid(11.88-14.18%), stearic acid(1.09-1.64%)and arachidic acid(0.12-0.33%)were present in the grain oil of different sorghum varieties31). According to Asiedu et al.32) the oil content of sorghum was found to be palmitic acid (13.2%), stearic acid(1.30%)and arachidic acid(0.20%).
The content of linoleic acid of all sorghum varieties was between 38.29 and 45.74 where as oleic acid ranged from Table 3 Amino acid contents of seeds of millet, some sorghum and lupin varieties(%), (n:3).
Millet sorghumYellow sorghumWhite Red sorghum Lutop (Lupin) Bablone (Lupin) Deşdiğin (Lupin)
Taurine 0.08±0.01*a 0.08±0.02a 0.08±0.01a 0.08±0.03a 0.05±0.01b 0.05±0.01b 0.05±0.01b Hydroxyproline 0.06±0.01d** 0.02±0.01e 0.02±0.01e - *** 0.15±0.03a 0.13±0.01b 0.10±0.01c Aspartic Acid 0.90±0.07d 0.59±0.03g 0.74±0.05f 0.80±0.11e 3.53±0.14a 3.23±0.21c 3.41±0.17b Threonine 0.41±0.03b 0.27±0.02d 0.35±0.01c 0.38±0.03c 1.24±0.09a 1.20±0.07a 1.21±0.11a Serine 0.47±0.07d 0.36±0.05f 0.43±0.03e 0.51±0.07c 1.59±0.13a 1.49±0.21b 1.57±0.17b Glutamic Acid 2.07±0.16d 1.71±0.09e 2.21±0.11cd 2.65±0.17c 6.77±0.98ab 6.17±0.63b 6.85±0.71a Proline 0.70±0.05f 0.70±0.09f 0.86±0.11e 1.01±0.08d 1.27±0.13a 1.20±0.21bc 1.24±0.17b Glycine 0.41±0.03c 0.30±0.07e 0.36±0.01d 0.37±0.09d 1.39±0.09a 1.33±0.11b 1.38±0.12a Alanine 0.84±0.11d 0.74±0.13e 0.94±0.09c 1.13±0.05a 1.14±0.07a 1.09±0.23b 1.10±0.06b Cysteine 0.21±0.03d 0.15±0.01f 0.19±0.01e 0.19±0.05e 0.49±0.03b 0.56±0.07a 0.46±0.03c Valine 0.59±0.07d 0.42±0.03f 0.52±0.07e 0.59±0.03d 1.39±0.12a 1.35±0.24b 1.37±0.17a Methionine 0.26±0.01a 0.15±0.01f 0.20±0.03e 0.20±0.05e 0.23±0.01bc 0.24±0.03b 0.22±0.03d Isoleucine 0.47±0.03c 0.34±0.01e 0.43±0.07d 0.48±0.03c 1.47±0.13a 1.39±0.11b 1.48±0.17a Leucine 1.07±0.07e 1.06±0.03e 1.39±0.03d 1.66±0.06c 2.51±0.16a 2.40±0.21b 2.41±0.19b Tyrosine 0.32±0.03d 0.23±0.01e 0.35±0.03d 0.41±0.07c 1.44±0.09a 1.31±0.17b 1.43±0.13a Phenylalanine 0.56±0.03d 0.44±0.01e 0.57±0.05d 0.66±0.06c 1.32±0.14a 1.24±0.11b 1.30±0.18a Hydroxylysine 0.04±0.01b 0.03±0.01c 0.05±0.01a 0.04±0.01b 0.03±0.01c 0.03±0.01c 0.04±0.01b Ornithine 0.02±0.01a 0.01±0.00b 0.01±0.00b 0.02±0.01a 0.02±0.01a 0.01±0.00b 0.01±0.00b Lysine 0.40±0.03c 0.25±0.01e 0.28±0.05d 0.28±0.01d 1.70±0.21a 1.61±0.19b 1.60±0.23b Histidine 0.30±0.07c 0.22±0.03e 0.26±0.03d 0.30±0.05c 0.80±0.09a 0.78±0.05b 0.77±0.11b Arginine 0.52±0.03d 0.31±0.01f 0.41±0.05e 0.42±0.07e 3.67±0.45a 2.94±0.38c 3.14±0.27b Tryptophan 0.15±0.01c 0.07±0.01d 0.08±0.01d 0.09±0.01d 0.28±0.03b 0.27±0.05b 0.31±0.04a Total 10.85 8.45 10.73 12.27 32.48 30.02 31.45
1068
29.15 to 37.98%22). However, Mehmood et al.30)reported
that polyunsaturated fatty acid contents of sorghum are greater than monounsaturated fatty acids. Oleic acid con-tents of bitter and sweet lupin oils were found as 52.22% and 44.93, respectively33). In addition, bitter lupin oil
con-tained 9.41% palmitic, 20.51% linoleic, 13.30% linoleic and 2.13% arachidic acids, and sweet lupin oil contained 7.71% palmitic, 1.71% stearic, 26.25% linoleic, 15.81% linoleic and 2.74% arachidic acids33)
. Bhardwaj et al.34) re-ported that lupin oil contained 51% linoleic acid, 23% oleic acid, 10% palmitic acid and 7% linolenic acid. Lore-do-Dávila et al.35)reported that lupin seed oil contained 13.12% palmitic, 6.77% stearic, 14.24% oleic 50.59% lin-oleic and 7.81% linolenic acids. Results showed differences as quantitative vales compared to literature values. But, major fatty acids of seed oils were found similar with litera-ture values.
3.5 Sugar composition of millet, sorghum and lupin seeds Table 5 shows the sugar content of the seed samples. Glucose contents of samples varied between 0.18%
(Deşdiğin)to 2.90%(Millet). While fructose was found in millet and sorghum seeds, sucrose was detected only in lupin seeds. Sucrose amounts in lupin seeds changed between 1.57%(Lutop)and 2.66%(Deşdiğin). Fructose was determined between 0.72%(Yellow Sorghum)and 1.26%(Millet). Generally, stachyose is main sugar of lupin seeds, fructose and glucose were major sugar of millet and sorghum samples. The sucrose content of lupin ranged between 1.5 to 3.5%, why stachyose ranged between 6.0 and 7.5%. Raffinose contents which was found to be 33.2 g/kg was significantly higher than verbascose(8.49 g/kg)in lupin seeds36). According to Muzquiz et al.11), lupin(L.
mariae-josephi)seeds contain 79.1 g/kg oligosaccharides. However, little amount of fructose was found in lupin seeds and Lupinus albus seeds contained 1.8% sucrose, 0.4% raffinose, 2.8% stachyose, 0.3% verbascose5). Gross et al.28)detected 9.0-9.9% sucrose, 16.9-16.6% raffinose,
68.3-67.7% stachyose and 5.8-5.8% verboscose in seeds of two strains(Inti and line 2150)of Lupinus metabilis, re-spectively.
Table 4 Fatty acid composition of seed oils of millet, some sorghum and lupin varieties(%), (n:3).
Fatty acids Millet sorghumYellow sorghumWhite Red sorghum (Lupin)Lutop Bablone (Lupin) Deşdiğin (Lupin)
Myristic 0.21±0.03c* 0.38±0.07b 0.44±0.9a 0.38±0.05b 0.16±0.03d 0.13±0.01e 0.13±0.01e Palmitic 15.57±0.67**c 15.43±0.33c 20.04±0.78a 17.95±0.91b 8.17±0.11d 7.24±0.13e 8.43±0.21d Palmitoleic 0.68±0.09b 0.79±0.07a 0.34±0.03d 0.67±0.13b 0.29±0.03e 0.34±0.01d 0.36±0.07c Stearic 1.98±0.21d 1.71±0.32e 3.92±0.28a 2.12±0.39c 1.39±0.13f 1.84±0.17e 2.45±0.43b Oleic 33.83±1.24f 37.06±1.09d 25.27±1.32g 35.58±1.48e 43.94±1.26c 53.50±1.35a 50.39±1.63b Vaccenic - *** - - - 1.86±0.23b 2.54±0.19a 2.55±0.27a Linoleic 42.67±0.97a 40.14±0.85b 42.53±0.69a 39.92±0.73c 23.89±1.13d 14.60±0.98f 17.03±0.88e Linolenic 1.69±0.09f 1.83±0.13e 2.94±0.11d 1.50±0.18g 7.14±0.98c 7.29±0.67b 7.35±0.56a Arachidic - - - - 1.00±0.01a 0.9±0.01b 1.01±0.03a Gonodic - 0.35±0.12d - 0.34±0.09d 3.83±0.21a 3.78±0.34b 2.42±0.42c Behenic - - 0.42±0.09d - 3.0±0.56a 2.85±0.22b 2.81±0.34c Erucic 1.42±0.32a 1.38±0.27b 0.69±0.11c Lignoceric 0.34±0.09e 0.35±0.03e 0.40±0.07d 0.41±0.01d 0.79±0.09a 0.62±0.07c 0.73±0.11b
**mean±standard deviation; ** Values within each row followed by different letters are significantly different (p < 0.05); ***undetermined
Table 5 Sugar composition of seeds of millet, some sorghum and lupin varieties(%), (n:3).
Samples Millet sorghumYellow sorghumWhite Red sorghum (Lupin)Lutop Bablone (Lupin) Deşdiğin (lupin)
Fructose 1.26±0.13*a 0.72±0.09c 1.12±0.15b 0.73±0.03c - - - Glucose 2.90±0.47a** 2.22±0.58c 2.23±0.21c 2.50±0.69b 0.36±0.03d 0.20±0.01e 0.18±0.03fe Sucrose - *** - - - 1.57±0.09c 1.87±0.09b 2.66±0.11a Raffinose 0.03±0.01d 0.04±0.01d 0.01±0.01e 0.01±0.01e 0.61±0.03b 0.65±0.07a 0.56±0.09c Stachyose 0.01±0.01d - 0.02±0.01d 0.02±0.01d 2.07±0.21c 2.15±0.17b 2.22±0.13a Verbascone - - - - - 0.12±0.01a 0.05±0.01b
1069
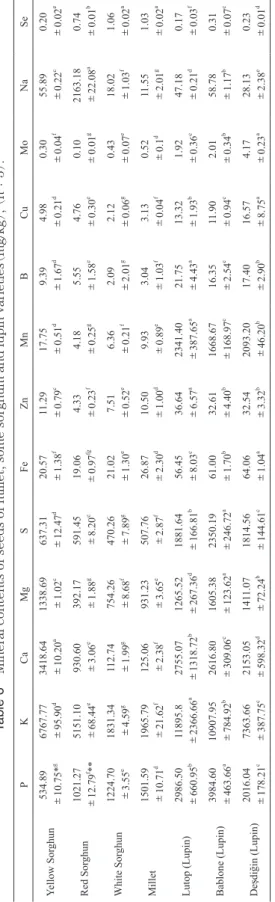
3.6 Mineral contents of millet, sorghum and lupin seeds Mineral contents of sorghum, milet and lupin seeds are shown in Table 6. Generally there is a wide variation in mineral contents of sorghum, millet and lupin seeds. While P contents of sorghum ranged between 534.89 mg/kg (Yellow Sorghum)to 3984.60 mg/kg(Bablone), K contents
ranged from 1831.34 mg/kg(While Sorghum)to 11895.8 mg/kg(Lutop). Ca contents were found between 112.74 mg/kg(White Sorghum)and 3418.64 mg/kg(Yellow Sorghum). However, Mg contents ranged from 392.17 mg/ kg(Red Sorghum)and 1605.38 mg/kg(Bablone). Fe con-tents ranged from 19.06 mg/kg(Yellow Sorghum)to 64.06 mg/kg(Deşdiğin). Zn contents ranged from 4.33 mg/kg (Red Sorghum)and 36.64 mg/kg(Lutop). Mn was found
between 4.18 mg/kg(Red Sorghum)to 2341.40 mg/kg (Lutop). Na contents of samples were found between
18.02 mg/kg(While Sorghum)to 2163.18 mg/kg(Red Sorghum). It was observed statstically significant differ-ences among mineral contents of seed”s(p<0.05). In general, lupin seeds contained more minerals than millet and sorghum seeds.
Chukwu et al.1)reported that Brown and white Guinea
corn grains contained 0.14 and 0.27% Ca, 0.19 and 0.21% K and 0.16 and 0.12% P, respectively. Previous studies showed that the proximate composition of some maize grains varied between 9.201-10.908% moisture content, (0.7-1.3%)ash,(3.21-7.71%)fat and(7.71-14.60%)protein
26). In maize grains, the amount of sodium is 540.30-620.41 ppm, K(2915-3471 ppm), Ca(410-590 ppm), Fe (38.02-56.14 ppm), Zn( 37.05-52.4 ppm), Mg(985.2-1125.3
ppm)and Cu(11.02-14.25 ppm)26)
. Mo contents of samples were found at the low levels(1.92-4.17 mg/kg. There were statistically differences in the mineral contents among the sorghum varieties, lupin and millet grain(p<0.05). Results showed differences when compared to results of Ullah et
al.26).
Conclusion
Sorghum, lupin and millet seeds are important crop and contains important health promoting constituents. Gener-ally, protein, oleic acid, amino acid and mineral contents of lupin varieties were higher as compared to those of millet phenol, anthocyanin and sorghum seeds. The protein con-tents of lupin seeds were reported higher than those of millet and sorghum seed samples. Glutamic acid was estab-lished as the most abundant amino acid in all samples. Generally, amino acid contents of lupin seeds were found higher than thos of amino acid contents of millet and sorghum seeds. Palmitic, stearic, oleic, linoleic and linole-nic acids were major fatty acids of seed samples. Generally, stachyose is main sugar of lupin seeds, fructose and glucose were major sugar of millet and sorghum samples.
Tab
le 6
Mineral contents of seeds of millet, some sorghum and lupin varieties
( mg/kg ), ( n: 3) . P K Ca Mg S Fe Zn Mn B Cu Mo Na Se Yellow Sor ghun 534.89 ±10.75* g 6767.77 ±95.90 d 3418.64 ±10.20 a 1338.69 ±1.02 c 637.31 ±12.47 d 20.57 ±1.38 f 11.29 ±0.79 c 17.75 ±0.51 d 9.39 ±1.67 d 4.98 ±0.21 d 0.30 ±0.04 f 55.89 ±0.22 c 0.20 ±0.02 e Red Sor ghun 1021.27 ±12.79 f** 5151.10 ±68.44 e 930.60 ±3.06 e 392.17 ±1.88 g 591.45 ±8.20 e 19.06 ±0.97 fg 4.33 ±0.23 f 4.18 ±0.25 g 5.55 ±1.58 e 4.76 ±0.30 e 0.10 ±0.01 g 2163.18 ±22.08 a 0.74 ±0.01 b White Sor ghun 1224.70 ±3.55 e 1831.34 ±4.59 g 112.74 ±1.99 g 754.26 ±8.68 f 470.26 ±7.89 g 21.02 ±1.30 e 7.51 ±0.52 e 6.36 ±0.21 f 2.09 ±2.01 g 2.12 ±0.06 g 0.43 ±0.07 e 18.02 ±1.03 f 1.06 ±0.02 a Millet 1501.59 ±10.71 d 1965.79 ±21.62 f 125.06 ±2.38 f 931.23 ±3.65 e 507.76 ±2.87 f 26.87 ±2.30 d 10.50 ±1.00 d 9.93 ±0.89 e 3.04 ±1.03 f 3.13 ±0.04 f 0.52 ±0.1 d 11.55 ±2.01 g 1.03 ±0.02 a Lutop (Lupin) 2986.50 ±660.95 b 11895.8 ±2366.66 a 2755.07 ±1318.72 b 1265.52 ±267.36 d 1881.64 ±166.81 b 56.45 ±8.03 c 36.64 ±6.57 a 2341.40 ±387.65 a 21.75 ±4.43 a 13.32 ±1.93 b 1.92 ±0.36 c 47.18 ±0.21 d 0.17 ±0.03 f Bablone (Lupin) 3984.60 ±463.66 a 10907.95 ±784.92 b 2616.80 ±309.06 c 1605.38 ±123.62 a 2350.19 ±246.72 a 61.00 ±1.70 b 32.61 ±4.40 b 1668.67 ±168.97 c 16.35 ±2.54 c 11.90 ±0.94 c 2.01 ±0.34 b 58.78 ±1.17 b 0.31 ±0.07 c De şdi ğin (Lupin) 2016.04 ±178.21 c 7363.66 ±387.75 c 2153.05 ±598.32 d 141 1.07 ± 72.24 b 1814.56 ±144.61 c 64.06 ±1.04 a 32.54 ±3.32 b 2093.20 ±46.20 b 17.40 ±2.90 b 16.57 ±8.75 a 4.17 ±0.23 a 28.13 ±2.38 e 0.23 ±0.01 d *mean ± standard deviation; **V
alues within each column followed by dif
ferent letters are significantly dif
ferent (
1070
Generally there is a wide variation in mineral contents of sorghum, millet and lupin seeds. While linoleic acid con-tents of millet and sorghum seed oils are found higher than those of lupin oils, oleic acid contents of lupin seed oils were determined higher compared to results of millet and sorghum seed oils.
Acknowledgements
The authors would like to extend their sincere appreciation to the Deanship of Scientific Research at King Saud University for its funding the Research group no (RG-1435-049). Technical support of RSSU at King Saud University is also well appreciated.
References
1) Chukwu, O.; Orhevba, B.A.; Abubakar, I. Determina-tion of some physicochemical properties of Guinea Corn(Sorghum vulgare). J. Innov. Res. Eng. Sci. 2 (2), 62-66(2011).
2) Ihekoronye, A.I.; Ngoddy, P.O. Integrated Food
Sci-ence and Technology for the Tropics. Macmillan,
pp.249-252(1985).
3) Afzal, M.; Nazir, Z.; Bashir, M.H.; Khan, B.S. Analysis of host plant resistance in some genotypes of maize against Chilo partellus(swinhoe)(pyralidae: lepidop-tera). Pakistan J. Bot. 41, 421-428(2009).
4) Niaz, I.; Dawar, S. Detection of seed borne mycoflora in maize(Zea mays L.). Pakistan J. Bot. 41, 443-451 (2009).
5) Mohammed, A.A.; Rayas-Duarte, P. Composition of
Lupinus albus. Cereal Chem. 72, 643-647(1995). 6) Ballester, D.; Yanez Garcia, E.; Erazo, S.; Lopez, F.;
Haardt, E.O.; Cornejo, S.; Lopez A.; Pokniak, J.; Chich-ester, C.O. Chemical composition nutritive value and toxicological evaluation of two species of sweet lupine (Lupinus albus and Lupinus luteus). J. Agric.
Food Chem. 28, 402-405(1980).
7) Jimenez-Martinez, C.; Hernandez-Sanchez, H.; Alva-rez-Manilla, G.; Robledo-Quintos, N.; Martinez-Herre-ra, J.; Davila-Ortiz, G. Effect of aqueous and alkaloid and tanin contents of Lupinus campestris seeds. J.
Sci. Food Agric. 81, 421-428(2001).
8) Pollard, N.J.; Stoddard, F.L.; Popineau, Y.; Wrigley, C.W.; Macritchie, F. Lupin flours as additives: Dough mixing, breadmaking, emulsifying and foaming. Cereal
Chem. 79, 662-669(2002).
9) Khalil, J.K.; Sawaya, W.N. Mineral and vitamin con-tents of Saudi Arabian pearl millet flour and bread.
Cereal Chem. 61, 301-304(1984).
10) AACC International, Method 46-30.01. Crude Protein -
Combustion Method. in Approved Methods of
Analy-sis 11th AACC International. St. Paul, MN, USA
(1999).
11) AACC International, Method 76-13.01, Total Starch Assay Procedure(Megazyme Amyloglucosidase/alpha-Amylase Method). in Approved Methods of Analysis 11th AACC International. St. Paul, MN, USA(1999). 12) AOCS. Official methods and recommended practices
of the AOCS. American Oil Chemists’ Society Cham-paign, IL(1998).
13) Singleton, V.L.; Orthofer, R.; Lamuela-Raventos, R.M. Analysis of total phenols and other oxidation sub-strates and antioxidants by means of folin-ciocalteu reagent. Methods in Enzymol. 299, 152-178(1999). 14) Hartzfeld, P.W.; Forkner, R.; Hunter, M.D.; Hagerman,
A.E. Determination of hydrolyzable tannins (gallotan-nins and ellagitan(gallotan-nins)after reaction with potassium iodate. J. Agric. Food Chem. 50, 1785-1790(2002). 15) Kakehi, K.; Honda, S. Silyl ethers of carbohydrates. in
Analysis of Carbohydrates by GLC and MS. CRC
Press Inc., Boca Raton, FL, USA. pp. 43-85(1989). 16) International A. O. A. C.; Horwitz, W.; Latimer, G.W.
Official methods of analysis of AOAC international. AOAC International(2006).
17) Ticconi, C.A.; Delatorre, C.A.; Abel, S. Attenuation of phosphate starvation responses by phosphite in Arabi-dopsis. Plant Physiol. 127, 963-972(2001).
18) Madaan, R.; Bansal, G.; Kumar, S.; Sharma, A. Estima-tion of total phenols and flavonoids in extracts of
Ac-taeaspicata roots and antioxidant activity studies. In-dian J. Pharm. Sci. 73, 666-669(2011).
19) Dewanto, V.; Wu, X.; Adom, K.K.; Liu, R.H. Thermal processing enhances the nutritional value of tomatoes by increasing total antioxidant activity. J. Agric. Food
Chem. 50, 3010-3014(2002).
20) Skujins, S. Handbook for ICP-AES(Varıan-Vista). A short guide to vista series ICP- AES operation. Varian Int.(1998).
21) Püskülcü, H.; Ikiz, F. Introdiction to statistic. p. 333. Bilgehan Presss, Bornova, Izmir, Turkey(1989).(in Turkish).
22) Osman, R.O.; Abd El Gelil, F.M.; El-Noamany, H.M.; Dawood, M.G. Oil content and fatty acid composition of some varieties of barley and sorghum grains.
Gra-sas y Aceites 51, 157-162(2000).
23) Martinez-Villaluenga, C.; Frias, J.; Vidal-Valverde, C. Functional lupin seeds(Lupinus albus L. and
Lupi-nus luteus L.)after extraction of α-galactosides. Food
Chem. 98, 291-299(2006).
24) Erbaş, M.; Certel, M.; Uslu, M.K. Some chemical prop-erties of white lupin seeds(Lupinus albus L.). J.
Food Chem. 89, 341-345(2005).
25) Guemes-Vera, N.; Martinez-Herrera, J.; Hernandez-Chavez, F. Comparison of chemical composition and
1071
protein digestibility carotenoids tanins and alkaloids content of wild lupinus varieties flour. Pakistan J.
Nutr. 11, 676-682(2012).
26) Ullah, I.; Ali, M.; Farooq, A. Chemical and nutritional properties of some maize(Zea mays L.)varieties grown in NWFP, Pakistan. Pakistan J. Nutr. 9, 113-1117(2010).
27) Gross, R.; Hatzold, T.; Elmadafa, I.; Ruiz, O. Genetical-ly and environmentalGenetical-ly dependent variability of pro-tein and fat content in the seeds of Lupinus
mutabi-lis of Peruvian origin. Zeit. Pflanzenzuecht 90, 324-330(1983).
28) Gross, R.; Von Baer, E.; Koch, F.; Marquard, R.; Trugo, L.; Wink, M. Chemical composition of a New variety of the Andean Lupin(Lupinus mutabilis cv. Inti)with low-alkaloid content. J. Food Comp. Analysis 1, 353-361(1988).
29) Afify, A.M.R.; El-Beltagi, H.S.; Abd El-Salam, S.M.; Omran, A.A. Oil and fatty acid contents of white sor-ghum varieties under soaking, cooking, germination and fermentation processing for improving cereal quality. Not. Bot. Horti Agrobot. Cluj-Napoca 40, 86-92(2012).
30) Mehmood, S.; Orhan, I.; Ahsan, Z.; Aslan, S.; Gulfraz, M. Fatty acid composition of seed oil of different Sor-ghum bicolor varieties. Food Chem. 109, 855-859 (2008).
31) Pontieri, P.; Di Fiore, R.; Troisi, J.; Bean, S.R.; Roemer, E.; Okot, J.; Alifano, P.; Pignone, D.; Giudice, L.D.; Massardo, D.R. Chemical composition and fatty acid content of white food sorghums grown in different en-vironments. Maydica 56, 1-7(2011).
32) Asiedu, M.; Nilsen, R.; Lie, O.; Lied, E. Effect of pro-cessing(sprouting and/or fermentation)on sorghum and maize. I: proximate composition, minerals and fat-ty acids. Food Chem. 46, 351-353(1993).
33) Alamri, M.S. Characterization of lupin seed oils ex-tracted from bitter and sweet types. Pakistan J. Food
Sci. 22, 161-167(2012).
34) Bhardwaj, H.L.; Hamama, A.A.; Merrick, L.C. Genotyp-ic and environmental effects on lupin seed composi-tion. Plant Food Hum. Nutr. 53, 1-13(1998). 35) Loredo-Dávila, S.; Espinosa-Hernandez, V.;
Goytia-Jimenez, M.A.; Diaz-Ballote, L.; Soto-Hernandez, R.M.; Marrone, P.G. Fatty acid methyl ester profile from lu-pinus in the identification of sweet and bitter species from this pender with oil of Lupinus uncinatus Schlecht seeds. J. Nutr. Food Sci. 2, 158-161(2012). 36) Muzquiz, M.; Guillamon, E.; Burbano, C.; Pascual, H.;
Cabellos, B.; Cuadrado, C.; Pedrosa, M.M. Chemical composition of a new Lupinus species found in Spain,
Lupinus mariae-josephi H. Pascual(Fabaceae).