T. C.
ISTANBUL AYDIN UNIVERSITY INSTITUTE OF SOCIAL SCIENCES
JOB SATISFACTION MEASUREMENT IN THE PUBLIC AND PRIVATE SECTORS: A COMPARATIVE STUDY IN ERBIL, IRAQ
THESIS
HAZHAR BAHRAM MAHMOOD Y1412.130031
Department of Business Business Administration Program
I T. C.
ISTANBUL AYDIN UNIVERSITY INSTITUTE OF SOCIAL SCIENCES
JOB SATISFACTION MEASUREMENT IN THE PUBLIC AND PRIVATE SECTORS: A COMPARATIVE STUDY IN ERBIL, IRAQ
M.Sc. THESIS
HAZHAR BAHRAM MAHMOOD Y1412.130031
Department of Business Business Administration Program
Thesis Advisor: ASST. PROF. DR. UĞUR ŞENER
III FOREWORD
Every challenging work needs self-efforts as well as guidance of elders of elders especially those who were very close to our heart.
I dedicate this project to the following.
My beloved parents and spouse (who educated and enable me to reach at this level)
-Mr. Bahram Mahmood Mahmood -Mrs. Zulakha Abdulrazzaq Jano -Nadhimah Mohammed Abdulla Wonderful Supervisor:
-Asst. Prof. Dr. UĞUR ŞENER
Along with all hard working and respected teachers
I wish that this thesis will be useful for researchers in further study on fields related to this topic.
IV TABLE OF CONTENTS Page FOREWORD ... ix TABLE OF CONTENTS ... xi ABBREVIATIONS ... xiii LIST OF TABLES ... xv
LIST OF FIGURES ... xvi
OZET ... xvii
ABSTRACT ... 1
1 INTRODUCTION ... 1
1.1 Background to the study... 1
1.2 Job Satisfaction Overview ... 2
1.3 Employee dissatisfaction and employee satisfaction ... 3
1.4 Job Satisfaction in the Public Sector and Private Sector ... 5
1.5 Importance of the Research ... 5
1.6 Statement of the Problem ... 5
1.7 Organization of the Research ... 5
2 LITERATURE REVIEW AND THEORETICAL FRAMEWORK ... 7
2.1 Literature Review ... 7
2.2 Theories of Job Satisfaction ... 9
2.2.1 Abraham Maslow’s theory of needs ... 9
2.2.2 Frederick Herzberg’s two factor theory ... 11
2.2.3 Edwin Locke’s theory of value ... 12
2.3 Job Satisfaction Variables ... 12
2.3.1 Independent variables ... 13 2.3.2 Dependent variables ... 13 3 RESEARCH METHODOLOGY ... 14 3.1 Introduction ... 14 3.2 Research Design ... 14 3.3 Sampling Method ... 15 3.3.1 Population ... 15 3.3.2 Sample size ... 16
3.4 Data Collection and Analysis Procedure ... 16
3.5 Questionnaire Validity ... 17
3.6 Questionnaire Reliability ... 17
3.4 Correlation ... 32
V
3.6 Aim of the Research ... 18
3.4 Research Objectives ... 18
3.5 Research Questions ... 18
3.6 Hypothesis ... 19
4 DATA ANALYSIS AND RESULTS . ... 20
4.1 Introduction ... 20
4.2 Correlations ... 20
4.3 Descriptive Statistics of Survey Questions ... 20
4.4 Frequencies Statistics of Survey questions ... 22
4.5 Demographic Frequency Distribution ... 28
4.6 Frequency Distribution of Job Satisfaction and Job Performance Questions ... 29
4.7 Histogram of Demography, Job Satisfaction and Job Performance Frequencies ... 42
4.7.1 Histogram of demography frequency ... 42
4.7.1 Histogram of Job satisfaction and job performance frequencies ... 46
4.8 Mean and Standard Deviation Statistics for Demographic Frequencies ... 66
4.9 Reliability Statistics ... 67
4.10 Crosstabs ... 71
4.11 Crosstabs for Educational Qualification and Job Sector ... 73
4.12 Educational Qualification and Job Sector in the Public and Private Sector ... 73
4.13 Chi-Square Test Analysis ... 74
4.14 Regression ... 75
4.15 Model summary ... 76
4.16 ANOVA (Analysis of Variance) ... 76
4.17 General Linear Model ... 77
4.18 Results of data Analysis ... 81
5 CONCLUSION AND RECOMMENDATIONS ... 83
REFERENCES ... 86
APPENDIX ... 90
VI ABBREVIATIONS
ANOVA : Analysis of Variance STD : Standard Deviation
SPSS : Statistical Package for Social Science
HR : Human Resource
KRSO : Kurdish Regional Statistics Office GDP : Gross Domestic Product
VII LIST OF TABLES
Page
Table 4.1: Descriptive Statistics showing Mean and Standard Deviation ... 21
Table 4.2: Frequencies Statistics of Survey questions ... 22
Table 4.3: Frequencies Statistics of Survey questions ... 22
Table 4.4: Frequencies Statistics of Survey questions ... 23
Table 4.5: Frequencies Statistics of Survey questions ... 24
Table 4.6: Frequencies Statistics of Survey questions ... 25
Table 4.7: Frequencies Statistics of Survey questions ... 26
Table 4.8: Frequencies Statistics of Survey questions ... 27
Table 4.9: Demographic Frequency for Gender... 28
Table 4.10: Demographic Frequency for Educational Qualification ... 28
Table 4.11: Demographic Frequency for Job Sector... 29
Table 4.12: Job Satisfaction and Job Performance Frequencies ... 29
Table 4.13: Question 1 ... 29 Table 4.14: Question 2 ... 30 Table 4.15: Question 3 ... 31 Table 4.16: Question 4 ... 31 Table 4.17: Question 5 ... 32 Table 4.18: Question 6 ... 33 Table 4.19: Question 7 ... 33 Table 4.20: Question 8 ... 34 Table 4.21: Question 9 ... 34 Table 4.22: Question 10 ... 35 Table 4.23: Question 11 ... 36 Table 4.24: Question 12 ... 37 Table 4.25: Question 13 ... 37 Table 4.26: Question 14 ... 38 Table 4.27: Question 15 ... 39 Table 4.28: Question 16 ... 39 Table 4.29: Question 17 ... 40 Table 4.30: Question 18 ... 40 Table 4.31: Question 19 ... 41 Table 4.32: Question 20 ... 42
VIII
Table 4.34: Descriptive Statistics ... 66
Table 4.35: Mean and Standard Deviation of Item Statistics ... 68
Table 4.36: Summary Item Statistics ... 69
Table 4.37: Item-Total Statistics ... 70
Table 4.38: Case Processing Summary ... 71
Table 4.39: Crosstabs for Gender and Job Sector in the Public and Private Sector ... 72
Table 4.40: Symmetric Measures ... 72
Table 4.41: Educational Qualification Job Sector Cross tabulation... 73
Table 4.42: Chi-Square Tests ... 74
Table 4.43: Symmetric Measures ... 66
Table 4.44: Variables Entered/Removed ... 66
Table 4.45: Model Summary ... 68
Table 4.46: ANOVA (Analysis of Variance) ... 69
Table 4.47: Coefficient ... 70
Table 4.48: Between-Subjects Factors ... 71
Table 4.49: Descriptive Statistics ... 72
Table 4.50: Levene's Test of Equality of Error Variances ... 72
IX
LIST OF FIGURES Page
Figure 1.1: Factors of Employee Dissatisfaction and Employee Satisfaction ... 4
Figure 2.1: Maslow’s Hierarchy of Needs ... 10
Figure 4.1: Histogram of Demographic Frequency for Gender ... 43
Figure 4.2: Histogram of Demographic Frequency for Educational Qualification ... 44
Figure 4.3: Histogram of Demographic Frequency for Job Sector ... 45
Figure 4.4: Q1 ... 46 Figure 4.5: Q2 ... 47 Figure 4.6: Q3 ... 48 Figure 4.7: Q4 ... 49 Figure 4.8: Q5 ... 50 Figure 4.9: Q6 ... 51 Figure 4.10: Q7 ... 52 Figure 4.11: Q8 ... 53 Figure 4.12: Q9 ... 54 Figure 4.13: Q10 ... 55 Figure 4.14: Q11 ... 56 Figure 4.15: Q12 ... 57 Figure 4.16: Q13 ... 58 Figure 4.17: Q14 ... 59 Figure 4.18: Q15 ... 60 Figure 4.19: Q16 ... 61 Figure 4.20: Q17 ... 62 Figure 4.21: Q18 ... 63 Figure 4.22: Q19 ... 64 Figure 4.23: Q20 ... 65
X
KAMU VE ÖZEL SEKTÖR’DE İŞ MEMNUNİYET ÖLÇUMÜ: KUZEY İRAK’TA ERBİL ÖRNEĞİ
ÖZET
Bu çalışmanın amacı, Erbil’deki kamu ve özel sektörlerde iş memnuniyeti ölçümünü yapmaktır. Bu çalışmanın araştırma sorularını inceledikten sonra, bu araştırma çalışması için veri toplamak ve verileri analiz etmek için kullanılan yöntem, veri toplamak üzere katılımcılara anketin dağıtılması olan kantitatif araştırma metodolojisidir. Katılımcıların cevapları araştırma kullanışlı olan yeterli bilgi ve verileri sağlamıştır.
Korelasyon analizi ve iki yönlü ANOVA, kantitatif verileri analiz etmek için kullanılan yöntemlerdir. Bu durum, iş memnuniyeti ve iş verimliliği arasındaki korelasyonu oluşturmuştur. İş memnuniyeti ve iş verimliliği, Kuzey Irak’ta Erbil’deki kamu ve özel sektörlerde iş memnuniyetini ölçmeyi incelemek üzere kullanılan bu çalışmadaki iki değişkendir.
Bulgulardan elde edilen sonuçlar, kamu sektörüne nazaran özel sektörde iş memnuniyetinin ve iş verimliliğinin önemli ölçüde daha yüksek seviyesini göstermişlerdir. Özel sektör, doğru insanları işe almak ve onlara çok daha iyi çalışma koşulları sunmak için işe alım politikalarında çok büyük ilerleme göstermektedir. Bu durum, özel sektördeki iş verimliliğini büyük ölçüde arttırmıştır. Her ne kadar, siyasi kriz nedeni ile Irak’ta ekonomik bağlamda düşüş olsa da özel sektördeki iş verimliliğindeki artışı takiben iş verimliliğinin seviyesi de özel sektörde artmıştır.
Kuzey Irak’taki özel sektör, finansal kazançlar elde ederek ve büyük yatırımlar yaparak karlı hale gelmiştir ve Kuzey Irak hükümetinin gelecek yıllarla ilgili olarak büyük beklentileri bulunmaktadır, özel sektöre tapılan yatırım çok daha fazla kazanç sağlayacaktır ve Kuzey Irak ekonomisinin gelişmesine muazzam bir katkıda bulunacaktır. Özel sektör, iş memnuniyetini ve iş verimliliğini aşağıdan yukarı doğru itmek için iş yerlerini daha da konforlu hale getirmeye devam etmek istemektedir ve Kuzey Iran hükümeti de Kuzey Irak’taki yatırım ortamını daha da elverişli hale getirme konusunda isteklidir.
Çalışmanın bulguları, özel sektördeki iş memnuniyetinin ve iş verimliliğinin seviyesinin kamu sektörüne göre daha yüksek olduğunu söylemek için yeterli değildirler. Erbil’deki gerek özel ve gerekse kamu sektörünün ekonomik performansını değerlendiren süreç içindeki oyuncular, bu sektörlerin kar eden kısımlarını görmeye ve bu faaliyeti desteklemeye devam edebilirler. Ayrıca, akademisyenler, kamu ve özel sektörlerdeki iş memnuniyeti ölçümleri konusundaki araştırmalarına yoğunlaşabilirler.
XI
XII
JOB SATISFACTION MEASUREMENT IN THE PUBLIC AND PRIVATE SECTORS: A COMPARATIVE STUDY IN ERBIL, IRAQ
ABSTRACT
The aim of this study was to examine job satisfaction measurement in the public and private sectors in Erbil. After examining the research questions of this study, the method used to collect data and analyze data for this research work was quantitative research methodology where questionnaire was distributed to collect data from respondents. Respondents’ answers provided adequate information and data useful for the research. Correlation analysis and two-way ANOVA were the methods used to analyze quantitative data. This comprised the correlation between job satisfaction and job performance. Job satisfaction and job performance are the two variables in this study that were used to examine job satisfaction measurement in the public and private sectors in Erbil in North of Iraq.
The results obtained from the findings showed that there is significant higher level of job satisfaction and job performance in the private sector than in the public sector. The private sector is making huge progress in its recruitment policies to get the right people hired and give them better working conditions. This has relatively increased job performance in the private sector. Although there was economic slowdown in Iraq caused by political crisis, the level of job satisfaction in the private sector has increased followed by an increase in job performance in the private sector.
The private sector in North of Iraq is profitable, making financial gains and great investing and the government of North of Iraq have high expectations that in the years to come, investment in the private sector will yield more profits and enormously contribute to booming the economy of North of Iraq. The private sector wants to continue making the workplaces more comfortable to push up job satisfaction and job performance from below and the government of North of Iraq is eager to make the investment environment in North of Iraq more conducive.
The findings from the study were not enough to say that the level of job satisfaction and job performance are higher in the private sector than in the public sector. Actors in the process of evaluating the economic performance of both the private and public sectors in Erbil may continue to see the profit making side of these sectors and uphold this activity. Also, academicians may not become less intense in their researches on job satisfaction measurement in the private and public sectors.
XIII
Keywords: Job Satisfaction, Job Performance, Measurement, Public Sector, Private
1 1. INTRODUCTION
The focus of this thesis is to measure the concept of Job Satisfaction in the private and public sectors. Many scholars have argued that Job Satisfaction plays the most important role in the life of employees in every public and private sector. Yet, the level of job satisfaction is different in both the public and private sectors.
When employees are satisfied with their job, they can prefer to work for the company for a longer period of time. On the contrary, employees would tend to abandon their job if job satisfaction policies and practices in the company are not well performed by the Human Resource department and other levels of management in the company. In addition, people will leave their jobs because they don't like their boss, don't see opportunities for promotion or growth, or are not offered an often higher pay (Garland 2017).
Over the past decades, a number of studies have demonstrated that the levels of job satisfaction vary widely in the public and private sectors. The effect of age, tenure, salary, job level, job type, work environment on employee job satisfaction has been discussed by many scholars.
In terms of marital status, age, pay, and other benefits, employees in the both public and private sectors have different job satisfaction levels (Noordin & Kamaruzaman 2017). To have a better understanding of this thesis, keywords like job satisfaction, public sector, and private sector would be defined.
1.1 Background to the Study
The most important people in every company are the employees. They are important because they play the important roles in given the company a good shape and helping the company to main this shape. This means that management of companies has the express duty to keep employees working on their job and even to influence the employees in many
2
ways to remain with the company. If management succeeds to keep employees steadily on the job it means that employees have been greatly satisfied.
To be a satisfied employee, shows that a company’s policies and practices on satisfaction are well upheld. This will again mean that job satisfaction which is a widely used concept in the process of company’s management and operation is well handled. Job satisfaction element can be well handled but the degree to which it is handled matters more and this greatly determines the retention of every employee. If the degree of handling job satisfaction is high, this will obviously attract and keep employees on the job. But if the degree is low, employees will tend to leave the job. This explains why in measuring job satisfaction, companies should strive to achieve high degree of job satisfaction.
The aspect of job satisfaction measurement comes in because in every economy like that of Erbil, there are basically two kinds of companies, companies of the public sector and companies of the private sector. As their names differ, the way their employees are handled and their levels of job satisfaction differ as well. Some scholars argue that in the public sector, job satisfaction level is higher than job satisfaction level in the private sector.
1.2 Job Satisfaction Overview
All companies in Erbil in North Iraq and elsewhere belong to either the public sector or the private sector. Although recruitment and selection process of their employees could be same, their way they handle their operations, manage and control their employees is different. Whether the company operations and employee management and control in the public and private sectors are different or not, employees who play the most important role are interested in knowing which sector has the higher job satisfaction level. Generally speaking, employees will prefer to perform their tasks effectively and efficiently in the sector with a higher level of job satisfaction than in the sector with a lower job satisfaction level. If job satisfaction level is higher in the public sector, this will attract and keep more employees than in the private sector where job satisfaction level is lower.
3
Redmond, (2016) defined job satisfaction to be the positive attitudes or emotional dispositions people may gain from work or through aspects of work. Employees’ job satisfaction becomes a central attention in the researches and discussions in work and organizational psychology because it is believed to have relationship with the job performance.
Basically, there are two types of job satisfaction based on the level of employees' feelings regarding their jobs.
1. Global job satisfaction: This refers to employees' overall feelings about their jobs. For example overall, I love my job.(Mueller & Kim, 2008).
2. Job facet satisfaction: This refers to feelings regarding specific job aspects, such as salary, benefits, work hierarchy, growth opportunities, work environment and the quality of relationships with one's co-workers. For instance overall, I love my job, but my schedule is difficult to manage. (Mueller & Kim, 2008).
According to Kerber& Campbell (1987), measurements of job facet satisfaction helps identify specific aspects of a job that require improvement. These findings may help organizations in improving overall job satisfaction or in understanding organizational issues such as high turnover rates (Kerber& Campbell, 1987).
The sector with the higher job satisfaction level will leave an employee happier and this lead to productivity shifting from productivity to satisfaction (Basset 1994). On the workplace and in the society as a whole, employee happiness affects productivity positively and this increases organizational performance and brand image.
1.3 Employee Dissatisfaction and Employee Satisfaction
While working for the public sector or for the private sector, employees are fond of evaluating their work experiences which they base them on their feelings of dissection or satisfaction regarding the tasks they perform as well as the sector for which they work whether it is the private or public (Jex, 2002). Jex (2002) argues that the nature of an employee’s job and the characteristics of the company determine whether the employee
4
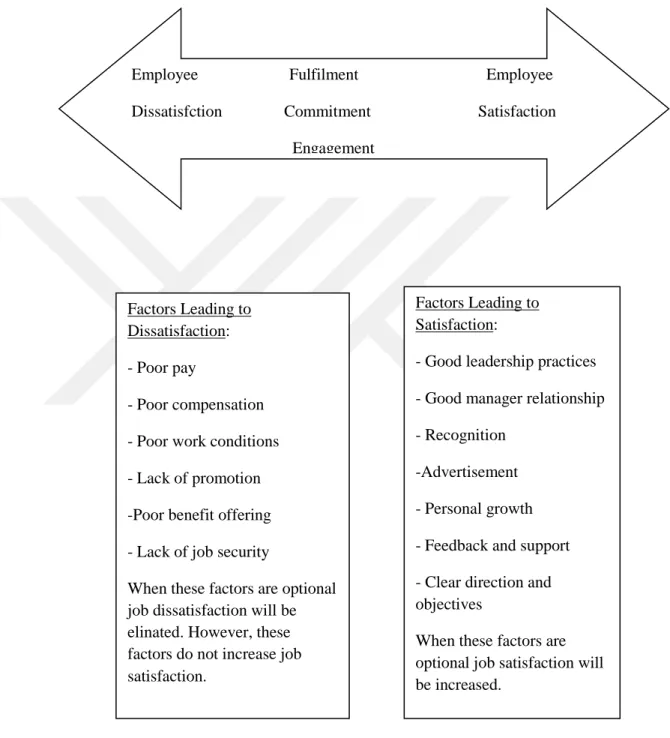
is dissatisfied or satisfied. Dissatisfaction and satisfaction are could be caused by a number of factors portrayed in the figure below.
Figure 1.1: Factors of Employee Dissatisfaction and Employee Satisfaction. Source:Job Satisfaction Model (Field, 2008).
These factors are positive factors and so increase satisfaction and organizational performance.
Employee Fulfilment Employee Dissatisfction Commitment Satisfaction Engagement
Factors Leading to Satisfaction:
- Good leadership practices - Good manager relationship - Recognition
-Advertisement - Personal growth - Feedback and support - Clear direction and objectives
When these factors are optional job satisfaction will be increased.
Factors Leading to Dissatisfaction: - Poor pay
- Poor compensation - Poor work conditions - Lack of promotion -Poor benefit offering - Lack of job security
When these factors are optional job dissatisfaction will be elinated. However, these factors do not increase job satisfaction.
5
1.4 Job Satisfaction in the Public Sector and Private Sector
Actually, job satisfaction in the public sector and private differ from one another in the way in which the effects of age, tenure, salary, job type, job level, and work environment on an employee’s job satisfaction are handled in the public sector and in the private. Therefore, to remake jobs, reward systems, human resource management policies that will result in optimum job satisfaction and productivity, managers need to know employees value absolutely well.
1. 5 Importance of the Research
The importance of this research is to investigate the sector with the higher degree of Job Satisfaction in Erbil in North of Iraq. Is it public sector or private sector?
1.6 Statement of the Problem
Job satisfaction a great motivational factor for the employees to decide whether to work for the public sector or for the private sector. The public sector argues that job satisfaction level is higher and job seekers are encouraged to come and work for them, while the private sector holds the opinion that working for them, employees will have no reasons to regret because job satisfaction level higher with their sector.
1.7 Significance of the Research
This study will contribute significantly to knowing the sector with the higher job satisfaction level. The greater demand for research in this field of study justifies the need for measuring the job satisfaction in the public and private sectors. Institutions that apply the recommended approach derived from the results of this study will be able to make better researches and contribute their own quota of job satisfaction measurement in Erbil. For the academics, this study will help them discover critical areas in job satisfaction measurement that many researchers were unable to explore. Thus, a new approach on the measurement of job satisfaction in the public and private sectors may be arrived at.
6 1. 8 Organization of the Study
This study is organized as follow:
Chapter 1: General introduction and background to the study of job satisfaction measurement in the public and private sectors.
Chapter 2: Literature review and theoretical frame. Here, relevant literature will be reviewed and some theories about job satisfaction measurement in the public and private sectors will be discussed.
Chapter 3: Methodology of the research mentioning the aim, objectives, research questions, and hypotheses of the research. The research method is quantitative research methodology where questionnaire will be distributed to collect data from respondents. Respondents’ answers will provide adequate information and data that will be analyzed in chapter four.
Chapter 4: Data collected from the designed questionnaire will be analyzed and results derived will be in this part of the research. This chapter will dwell on the analysis and results of the adequate data provided by respondents. Correlation analysis and two-way ANOVA will be the method used to analyze quantitative data. This will comprise the correlation between job satisfaction and job performance.
Chapter 5: Chapter five consists of conclusion and recommendations for further research. Conclusion gives a summary of what the research examined, results derived, and comparisons with other fields of study. Recommendations for further research will give academics more information on investigating into Job Satisfaction measurement in the two sectors and to establish facts and reach new results.
7
2. LITERATURE REVIEW AND THEORETICAL FRAMEWORK
2.1 Literature Review
Definitely, the sector with a higher level of job satisfaction will attract and keep its employees working for a longer period of time whereas employees will not be satisfied to work for the sector with a lower level of job satisfaction.
Job satisfaction of employees depends on the nature of the job and the sector in which the employees work. One of the significant roles of human resource department is to maintain employee satisfaction in the organization. But this has become a challenge for the HR department to maintain the highest level of satisfaction for employees. Job satisfaction of employees is determined by the various factors in an organization and it is the employee’s sense of achievement.
Looking at the concept many studies have been carried out to give job satisfaction the importance it deserves. Khan & Praveen (2014) studied that those working in the public banks are more satisfied than those working in the private banks.
This implies that job satisfaction level is higher in the public sector than in the private sector. As a result, employees who desire to work under higher job satisfaction conditions will prefer the public sector to the private sector. This because employees in the private banks are not satisfied with their job security, lack of promotion and the absence of recognition for the efficient and effective work done.
Employees of the public sector show a stronger service ethic than employees of the private sector (Wittmer 1991). Public service satisfaction elements comprise of opportunity to have an impact on public affairs, commitment to serving the public interest, and an interest in achieving social justice (Naff and Crum 1999).
8
In their study, Work motivation differences between public and private sector, Rashid & Rashid, (2012) examined that employees in the private sector are more motivated by the career development opportunities, rewards, and the supportive work environment. Comparatively, the level of job satisfaction of employees in the private sector in slightly lower than the level of job satisfaction in the public sector. Job satisfaction variables such as job security, salary and lack of recognition of the work in the organization are highlighted as the main cause of dissatisfaction for employees in private sector (Bora, 2014).
Focusing on job satisfaction measurement in the public sector and the private sector in Erbil region of North of Iraq, job satisfaction from salary and job security is likely to be lower in the private sectors because as a developing country facing economic crisis and political instability, the private sectors are weak are unstable. Therefore, this research will include the study of security of jobs and satisfactory salary for the employees in private sectors and public sectors in Erbil.
Kaya (1995) found that the level of job satisfaction of librarians in developing countries was lower than that of developed countries and is related to the need of information in society. The major reasons behind this were. This is because of lack of need for information and the society did not give indispensable value to the information experts and to the librarians. The case is same in Erbil where the private universities still lag behind in getting information. As a result, employees in the private sector universities especially the librarians are not satisfied with their job.
In their study, Togia, Koustelios, &Tsigilis (2014) used the Employee Satisfaction Inventory (ESI) scale and examined job satisfaction among Greek academic librarians and found that their job satisfaction level was higher with job supervision, working conditions, job itself, and their job satisfaction level was lower with promotion and pay. These discoveries are in accordance with earlier studies and particularly valuable for providing a comparative and comprehensive understanding of job satisfaction in all areas of both the private sector and the public sector.
9
In comparing Turkish public and private sector employees’ job and life satisfaction levels, Özsoy, Uslu, & Üztürk (2014), examined that, both job and life satisfaction of the employees working in public sector scored higher than employees working in private sector. In Erbil, employees of the public sector are more satisfied than those of the private sector owing to stability and security working with the public sector as in Erbil; the government is making more efforts to revive the private sector.
According to the studies of Volkwein & Parmley (2014), teachers in the public sectors are paid low as compared to teachers in the private sectors and also employees in the public sectors have fewer career development opportunities, hence increasing the level job satisfaction for teachers in the private sectors.
In his 2010 study, Ayub looked into the difference in the level of satisfaction between private and public university teachers. He found out that private university teachers are more satisfied than public university teachers in terms of pay. In Erbil, employees teaching in private universities get more pay than their counterparts of the public sector. Public schools in Erbil and in other parts of Iraq and in others countries are almost tuition-free. Still in his study, Ayub (2010), that the employee-employee relationship and the communication within the organizations have no difference for private sector and public sector employees. There is also clear evidence that public sector employees are less motivated than private sector employees (Khojasteh, 1993).
In their 2013 joint study, Pannu& Gupta examined that employees in both private sector and public sector are satisfied with their job. Organizational culture and flexibility of time schedule are two factors which contribute to the higher level of job satisfaction for the public sector workers than the private sector workers.
If the organizational environment is conducive employees will feel very comfortable at work and employees will not be comfortable when the organizational environment is really not conducive. In their study, Sabri, Ilyas & Amjad (2011) argued that the private sector work environment is more attractive and more conducive than the public sector
10
work environment. This implies that the level of job satisfaction is higher in the private sector and lower in the public sector.
Motivation is also an aspect of job satisfaction. When an employee is motivated on the job, the employee will perform his tasks effectively and efficiently and this will lead to increase in organization’s productivity. Sinha (2013) highlighted that factors such as economic, social, and organizational culture motivate employees and these factors need to be addressed.
Chen, (2005), suggested that the public sector should give good pay, provide favourable working conditions, good communication, safe working place, equal and effective reward system, work recognition and transparent promotion.
The levels of job satisfaction in the public sectors and in the private sectors are different and difficult to measure. Therefore, the sectors which need improvement should be improved and the employees in the public sectors and in the private sectors will enjoy same amount of job satisfaction. Looking at job satisfaction to be the focus of this study, some theories have been advanced to add more importance to job satisfaction of the employees in both public and private sectors.
2.2 Theories of Job Satisfaction The theories are available below
2.2.1 Maslow’s Theory of Needs
Abraham Maslow provided for the humanitarian needs of his theory and arranged it in a hierarchy according to the degree runway satisfy. The psychologist Abraham Maslow's interpretation of human behavior on the basis of its needs. According to this theory, the unmet needs become the main determinant of individual behavior until they are satisfied. Based on Maslow's hierarchy theory, the hierarchy of needs is divided into five levels.
11
Figure 2.1: Maslow’s Hierarchy of Needs
Source: Finkelstein, Maslow’s Hieratchy of Needs, 2006
Physiological needs: it is the basic human needs for survival live, such as the needs for air, food, water, sex, sleep, homeostasis and excretion. Maslow stressed that these circumstance needs that were not saturated with the needs of the rest of the slow, that is, these needs capture the interest of rights and overwhelm all other needs that were not saturated.
The needs of safety: once the satisfaction of physiological needs dominates the human needs of safety, and the needs of security and reassurance of risk and fear, and need of security and reassurance of risk and fear, and the manifestations of these health insurance and insurance needs manifestations of these health insurance and insurance needs life against the disease or accident. Job safety, resources and the safety for morality,
Love/Belonging or Social needs: once that’s done to satisfy the physiological needs and security, according to Maslow, they remain the consuming in stimulating behavior, and become social needs here are incentives for stimulant-like behavior need and social interaction, family, friendship, and sexual intimacy do not satisfy these needs will result in the inability to adaptation in society.
The needs of self-esteem: It includes the needs for respect of others and respect by others, self-esteem, confident, achievement, and the needs to develop a sense of self-confidence,
Self-Actualization Esteem Love/Belonging Safety Psychological Psychological SafeSS
12
and can achieve these circumstance needs by successfully completing certain tasks and others to estimate the capabilities of the individual and the performance of a stunt for impressive.
The needs of self-actualization: It represent the highest stages of saturation which is also referred to as express need which the individual needs to be, or is able to access it, including the need to develop the capabilities of the individual. Self-actualization includes; morality, spontaneity, creativity, problem solving, lack of prejudice, innovation and the achievement of maximum ambition.
2.2.2 Frederick Herzberg two factors theory
Frederick Irving Herzberg was an American psychologist (Herzberg, Mausner & Snydermam 2010). The two factor theory also known as Herzberg’s Motivation-hygiene theory and dual-factor theory states that there are certain factors in the workplace that cause job satisfaction, while there are a separate set of factors that lead to job dissatisfaction.
Herzberg’s theory analysis is contrary to the theory of Maslow about job satisfaction and the basis on contents that the factors that lead to job satisfaction are different from those factors that lead to the removal of the case of dissatisfaction. There are two factors in this theory which include hygiene factor and driving factor.
Hygiene factors: It is responsible for the demise of the state of dissatisfaction factors and availability well lead to avoid feelings of dissatisfaction. But these health factors do not lead to create momentum and enthusiasm of the individual. When the employees on the job think of a situation in the workplace where they felt really bad, they will often mention factors like company policy and administration, supervision, the physical working conditions, personal life, social status, relationship with colleagues, the relationship with superiors and subordinates, pay, and security (Smerek & Peterson 2006).
Driving factors: This factor represents the sum of the factors that lead to the creation of an impetus to the behavior of workers the cause of job satisfaction and on their way to exert more effort to achieve the desired goals, achievement, recognition from colleagues,
13
management, work itself, advancement, responsibility, are better motivators than money or pay (Shannon 2005).
2.2.3 Edwin Locke's theory of value
In his theory, Edwin Locke believed that the main cause of job satisfaction is the ability of position to provide returns of value and benefit to any individual factor foundation. This is because goal-setting is a powerful people especially employees. The theory of goal-setting is highly valued and recognized that the entire management system like Management by Objectives (MBO) (Thomas, 1998) have goal setting ethics within them. From this point, it can be seen that whether the individual is satisfied or not the theory reflects two things: Firstly, the importance of returns earned by an individual from his job and secondly, the incompatibility between what the individual wants and gets is done. Goal setting indicates and gives direction to the employees about what needs to be done and how much efforts are required to be put in (Management Study Guide, 2017).
The important elements of Locke’s goal theory are that the goals should be specific and clear. Also, the goals should realistic and challenging. Specific and clear goals lead to better performance and greater output. Talking about reality and challenge, the employee will feel proud and triumph when he attains his goals and he will set for he himself even more challenging goals. This so because the more challenging the goal, the greater the reward and the more the love for achieving the goals.
2.3 Job Satisfaction Variables
In this study of job satisfaction measurement, two types of variables will be examined. There will be independent variables and dependent variable(s).
14 2.3.1 Independent variables
Independent variables include: Salary
Time schedule
Working environment Relationship with supervisor Relationship with coworkers Job security
Recognition Schemes Promotion Schemes
Participation in decision making processes Personnel development
These variables are independent variables in every organization. This is because as they are called factors of job satisfaction, they play significant roles in the functioning of every public and private organization. One variable can cause employee satisfaction or employee dissatisfaction in the organization.
2.3.2 Dependent variables
There is only one dependent variable in this study. That dependent variable is job satisfaction. As a dependent variable, job satisfaction depends on the independent variables. How an independent variable is handled in the organization will determine the degree of job satisfaction of employees. For example, if there is no job security and personnel development plan in an organization, its employees will become dissatisfied and the level of job satisfaction of employees in that organization will be less.
15
3 RESEARCH METHODOLOGY
3.1 Introduction
This part of the research explains the methods used in finding the significance of independent variable which is job satisfaction and the level of job satisfaction of employees in the public and private sectors. This research is focused on public and private sector employees in Erbil in North of Iraq.
3.2 Research Design
This research mainly uses quantitative designs for which data was collected through survey questionnaires. As this study intends to examine job satisfaction measurement in the public and private sectors in Erbil and quantitative method was used to collect information. The survey questionnaire is divided into two main parts. That is part A and part B.
Part A
This part contains 20 questions of job satisfaction and performance and includes the overall satisfaction of the employees explaining the dependent variable level of job satisfaction of the public and private sector employees. The two variables; job satisfaction and job performance are to be rated at 5-points likert scale format response scale. That include:
1 Strongly Disagree 2 Disagree
16 4 Agree
5 Strongly Agree
Part A contains 20 questions. These are the correlated two variables. These correlated variables include:
1. Job Satisfaction 2. Job Performance. Part B
This part is demographic questions or personal questions that give details of respondents’ personal information. These details include:
Gender Education Kind of job 3.3 Sampling Method
The population and sample size of the study will be used as sampling method of the research.
3.3.1 Population
The research was carried out within the area of Erbil, North of Iraq and the sampling method was used amongst public and private sector employees in Erbil, North of Iraq. The samples in the study basically involve two categories of employees.
1. Public employees 2. Private employees
17
According to North of Iraq Statistical Office (2016) there are 235,761 public employees only in Erbil. This number includes the civil service, other government agencies and public owned companies.
Also, there are 191,521 employees working in private sector in Erbil. The population size of this research is:
Public Sector Employees = 235,761 Private Sector Employees = 191,521
Therefore the population size of this research ► 235,761 + 191,521 = 427,282 The reasons to choose the region and sectors are as follow.
Erbil is the summer capital of Iraq and the governorate of north Iraq.
Economy in north of Iraqi consists of the autonomous economy in Northern Iraq.
Erbil is the economic capital of Iraq.
Erbil has been ranked the first in North of Iraq in life stock breeding and the abundance animal products.
Erbil city is the center for trade North of Iraq and the imported materials from abroad to Iraq pass through Erbil.
Majority of the population working in trade, agriculture, and industry sectors are government employees.
According to the economy of North of Iraqi fiscal year (2015), the Gross Domestic Product (GDP) of Erbil stands at $ 26.5 billion. The GDP per capita is $ 7.000. The GDP by sector (petroleum industry) stands at % 80 of revenues. Inflation (Consumer Price Index) is % 97 (2016). Population below poverty line is % 12 (2016). The Labor force in Erbil is 1.300.000 (2016), while unemployment is just
18
% 14 (2016). Externally, the Gross External debt stands at $ 22 billion. Public finance statistics (2016) shows that the total revenue of Erbil is $ 54 billion. 3.3.2 Sample Size
For the purpose of simplicity and circumstances such as respondents’ refusal to fill in the questionnaire and working outside their offices, only 385 of them participated in survey. Therefore, the sample size of the research was 385. That is 179 employees from the public sector and 206 employees from the private sector.
3.4 Data Collection and Analysis Procedure
Secondary data was collected through extensive use of books, journals, magazines, and statistics from government, articles, and web pages appropriate to the research.
Primary data was also collected through the structured questionnaire which was equally distributed to public and private sector employees in Erbil. The data collected from the structured questionnaire were summarized and tabulated through the means of Statistical Package for Social Science (SPSS). SPSS, software that allows the researcher to interpret, summarize and operate statistical tests if necessary.
The method used to analyze quantitative data for this research will be correlation and two-way ANOVA will be applicable. This will comprise the correlation between the two variables;
A. Job Satisfaction B. Job Performance 3.5 Questionnaire Validity
A research becomes actually valid when it measures what it claims to measure and if there are no logical mistakes in making judgments from the facts and statistics.
19
Do the 20 questions on the questionnaire actually measure job satisfaction and level of performance in the two sectors?
To answer the question above, it will be obligatory to take a look at the various questions and determines their relation to the two variables; job satisfaction and performance. 3.6 Questionnaire Reliability
Results obtained from the survey should only be interpreted within the context of job satisfaction and performance measurement in the two sectors.
How the correlation between job satisfaction and performance produces stable and consistent results is said to be reliability.
If this same study is done in a different setting it should give the same results. In spite of that, it is obvious that the number of respondents in this research is limited and the survey questions in these organizations are different.
Therefore, it is apparent that the data interpretation of this same research will produce different results if applied to same organizations after a particular period of time.
3.7 Correlation
Correlation is defined as the integration between more variables. In this research study, there are two significant variables. These variables include job satisfaction and job performance. There is a correlation between these two variables. The correlation shows that:
A higher level of job satisfaction determines a higher level of job performance in the public and private sectors
A lower level of job satisfaction signifies a lower level of job performance in the public and private sectors
20 3.8 Two-way ANOVA
ANOVA will be used in this study which shows two independent variables. Two-way ANOVA is analysis is used where groups of variables are defined on two independent variables. There are basically two independent variables in this study. There is job satisfaction and there is job performance.
Two-way ANOVA analysis was used to assess whether there was any important correlation between the two variables.
The null hypothesis for the two-way ANOVA will be, for example the integration of the human resource policies and getting employees satisfied will not have any significant difference with the correlation consequence of job satisfaction and job performance. Conversely, the alternative hypothesis for the two-way ANOVA will be that the integration of human resource policies and getting employees satisfied will have significant difference with the correlation consequence of job satisfaction and job performance.
3.9 Aim of the Research
The aim of this research is to investigate job satisfaction measurement in the public and private sectors.
3.10 Research Objectives
To identify the determinants of job satisfaction among employees of the public and private sectors in Erbil.
To identify the challenges of job satisfaction in the public and private sectors. To identify the impact of job satisfaction on the performance of employees in the
21 3.11 Research Questions
What are the determinants of job satisfaction among employees of the public and private sectors in Erbil?
What are the challenges of job satisfaction in the public and private sectors in Erbil?
How does job satisfaction influence the performance of employees in the public and private sectors in Erbil?
3.12 Hypothesis
H1: Job satisfaction is positively correlated with job performance. H2: Job satisfaction is negatively correlated with job performance.
22
4 DATA ANALYSIS AND RESULTS
4.1 Introduction
Data collected from the designed questionnaire will be analyzed and results derived will be in this part of the research. This chapter will dwell on the analysis and results of the adequate data provided by respondents. Correlation analysis and two-way ANOVA will be the method used to analyze quantitative data. This will comprise the correlation between job satisfaction and job performance. Job satisfaction and job performance are the two variables in this study that will examine job satisfaction measurement in the public and private sectors in Erbil in North of Iraq.
4.2 Correlations
Correlation is defined as the integration between more variables. In this research study, there are two significant variables. These variables include job satisfaction and job performance. There is a correlation between these two variables. See Inter-Item Correlation Matrix table in the appendix.
4.3 Descriptive Statistics of Survey Questions
Descriptive statistics showing mean and standard deviation of survey questions can be seen in tabulated description below.
Table 4.1: Descriptive Statistics showing Mean and Standard Deviation.
N Minimum Maximum Mean Std. Deviation
23 Educational qualification 385 1,00 4,00 1,7922 ,79283 Job Sector 385 1,00 2,00 1,4649 ,49942 1 385 1,00 5,00 2,7377 1,48649 2 385 1,00 5,00 2,7506 1,33079 3 385 1,00 5,00 3,6649 1,19654 4 385 1,00 11,00 2,8935 1,54670 5 385 1,00 5,00 3,7065 1,16126 6 385 1,00 5,00 3,9766 1,18012 7 385 1,00 5,00 2,9506 1,29106 8 385 1,00 5,00 3,5662 1,19739 9 385 1,00 5,00 3,0000 1,28290 10 385 1,00 5,00 2,7558 1,34731 11 385 1,00 5,00 3,1455 1,23518 12 385 1,00 5,00 3,2805 1,27649 13 385 1,00 5,00 3,7714 1,15457 14 385 1,00 5,00 3,0026 1,27781 15 385 1,00 5,00 3,3974 1,12523 16 385 1,00 5,00 3,1039 1,25814 17 385 1,00 5,00 3,5922 1,18253
24
18 385 1,00 5,00 3,8545 1,11085
19 385 1,00 5,00 3,9065 1,17552
20 385 1,00 5,00 3,4104 1,32794
Valid N (list wise) 385
Descriptive statistics shows mean and standard deviation of survey questions can be seen in the description above. The total number of respondents was 385, minimum stayed at 1, 00 meanwhile maximum registered a score of 5, 00 and mean and standard deviation saw fluctuation in the results.
4.4 Frequencies Statistics of Survey questions
The table below shows frequency statistics of survey questions Table 4.2: Frequencies Statistics of Survey questions
Gender
Educational
qualification Job Sector 1 2
N Valid 385 385 385 385 385 Missing 0 0 0 0 0 Mean 1,4026 1,7922 1,4649 2,7377 2,7506 Median 1,0000 2,0000 1,0000 2,0000 3,0000 Mode 1,00 1,00 1,00 1,00 1,00 Std. Deviation ,49106 ,79283 ,49942 1,48649 1,33079
25 Variance ,241 ,629 ,249 2,210 1,771 Range 1,00 3,00 1,00 4,00 4,00 Minimum 1,00 1,00 1,00 1,00 1,00 Maximum 2,00 4,00 2,00 5,00 5,00 Percentiles 25 1,0000 1,0000 1,0000 1,0000 2,0000 50 1,0000 2,0000 1,0000 2,0000 3,0000 75 2,0000 2,0000 2,0000 4,0000 4,0000
Table 4.2.1 examines the frequency statistics of survey questions where the sample size is 385 and the missing number of cases is 0. The mean fluctuated from 1, 4026 at the 1st category being gender to 2, 7506 being the 2nd question on the questionnaire. The Mean for educational qualification is 1,7922 and Median is 2,0000. In regards to job sector, the mean is 1,4649 while the median is 1,0000. Question 1 has a mean of 27377 and the Median is 2,0000 while the Mean for question 2 is 2,7506 and the median is 3,0000. The minimum range for gender is 1 and maximum range is 2, that of educational qualification and the maximum range is 4. For job sector the minimum range is 1 and maximum 2. Question 1 and 2, have the same minimum and maximum scale of 1 and 5 respectively. Table 4.3: Frequencies Statistics of Survey questions
3 4 5 6
N Valid 385 385 385 385
Missing 0 0 0 0
26 Median 4,0000 3,0000 4,0000 4,0000 Mode 4,00 1,00 4,00 5,00 Std. Deviation 1,19654 1,54670 1,16126 1,18012 Variance 1,432 2,392 1,349 1,393 Range 4,00 10,00 4,00 4,00 Minimum 1,00 1,00 1,00 1,00 Maximum 5,00 11,00 5,00 5,00 Percentiles 25 3,0000 1,0000 3,0000 4,0000 50 4,0000 3,0000 4,0000 4,0000 75 5,0000 4,0000 5,0000 5,0000
In continuation of the above questions, it continues in the above table from question 1 to 6. The result shows that all the questions have similar minimum scale of 1 and a maximum scale of 5. The mean fluctuate from 3, 6649 in the 3rd question to 3, 9766 in the 6th question on the questionnaire. The change in the result for median was between 4, 0000 to 3, 0000 and mode is increases from 1, 00 to 5, 00.
Table 4.4: Frequencies Statistics of Survey questions
7 8 9 10
N Valid 385 385 385 385
Missing 0 0 0 0
27 Median 3,0000 4,0000 3,0000 3,0000 Mode 3,00 4,00 3,00 3,00 Std. Deviation 1,29106 1,19739 1,28290 1,34731 Variance 1,667 1,434 1,646 1,815 Range 4,00 4,00 4,00 4,00 Minimum 1,00 1,00 1,00 1,00 Maximum 5,00 5,00 5,00 5,00 Percentiles 25 2,0000 3,0000 2,0000 2,0000 50 3,0000 4,0000 3,0000 3,0000 75 4,0000 4,0000 4,0000 4,0000
Questions 7, 8, 9 10 follows the previous questions though having its own mean, median and mode scale. Out of the 385 valid numbers of responses from respondents, results show that the mean for the 7th question is 2.9506 that of question 8 are 3.5662, for question 9 it is 3.0000 and 2.7558 for question 10. The Median follows suits as follows; 3.0000, 4.0000, 3.0000 and 3.0000 (questions 7-10 respectively). The minimum and maximum scale for all the questions ranges between 1 and 5 respectively. The standard deviation for question 7 shows 1.29106 and that of question 8 is 1.19739, then 1.28290 for question 9 and 1.34731 for question 10.
Table 4.5: Frequencies Statistics of Survey questions
11 12 13 14
28 Missing 0 0 0 0 Mean 3,1455 3,2805 3,7714 3,0026 Median 3,0000 3,0000 4,0000 3,0000 Mode 4,00 4,00 4,00 3,00 Std. Deviation 1,23518 1,27649 1,15457 1,27781 Variance 1,526 1,629 1,333 1,633 Range 4,00 4,00 4,00 4,00 Minimum 1,00 1,00 1,00 1,00 Maximum 5,00 5,00 5,00 5,00 Percentiles 25 2,0000 2,0000 3,0000 2,0000 50 3,0000 3,0000 4,0000 3,0000 75 4,0000 4,0000 5,0000 4,0000
The table above shows frequency statistics of survey questions where the sample size is 385 and the missing number of cases is 0. The mean of question 11 is 3, 1455 while 3, 0026 is the mean for 14th question on the questionnaire. The change in the result for median was between 3, 0000 to 4, 0000 and mode is increases just from 3, 00 to 4, 00. The minimum scale for questions 11, 12, 13 and 14 is 1 while the maximum scale is 5. The standard deviation for the above questions are; 1.23518, 1.27649, 1.15457 and 1.27781 respectively.
29
Table 4.6: Frequencies Statistics of Survey questions
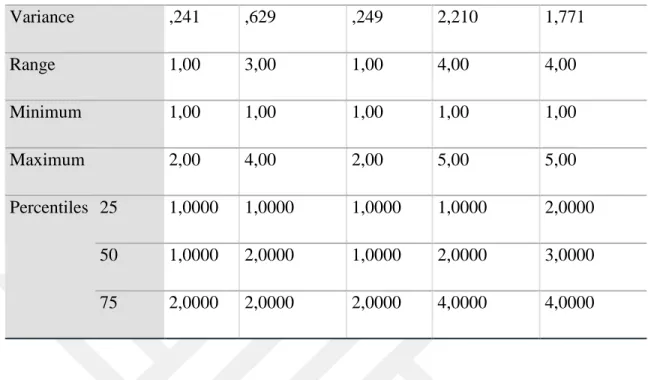
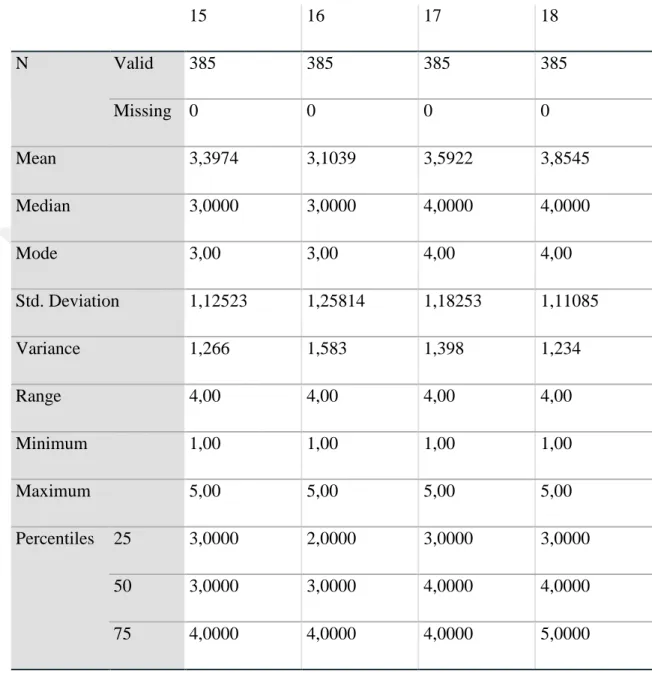
15 16 17 18 N Valid 385 385 385 385 Missing 0 0 0 0 Mean 3,3974 3,1039 3,5922 3,8545 Median 3,0000 3,0000 4,0000 4,0000 Mode 3,00 3,00 4,00 4,00 Std. Deviation 1,12523 1,25814 1,18253 1,11085 Variance 1,266 1,583 1,398 1,234 Range 4,00 4,00 4,00 4,00 Minimum 1,00 1,00 1,00 1,00 Maximum 5,00 5,00 5,00 5,00 Percentiles 25 3,0000 2,0000 3,0000 3,0000 50 3,0000 3,0000 4,0000 4,0000 75 4,0000 4,0000 4,0000 5,0000
Table 4.2.5 clearly presents the results of questions 15, 16, 17 and 18. It shows that the mean is 3,3974, 3,1039, 3,5922, and 3,8545 respectively. The mode is 3.00 and 4.00, while the std is 1,12523, 1,25814, 1,18253, 1,11085 for all the questions. The range is 4.00 while the minimum scale is 1 and the maximum is 5.00.
30
Table 4.7: Frequencies Statistics of Survey questions
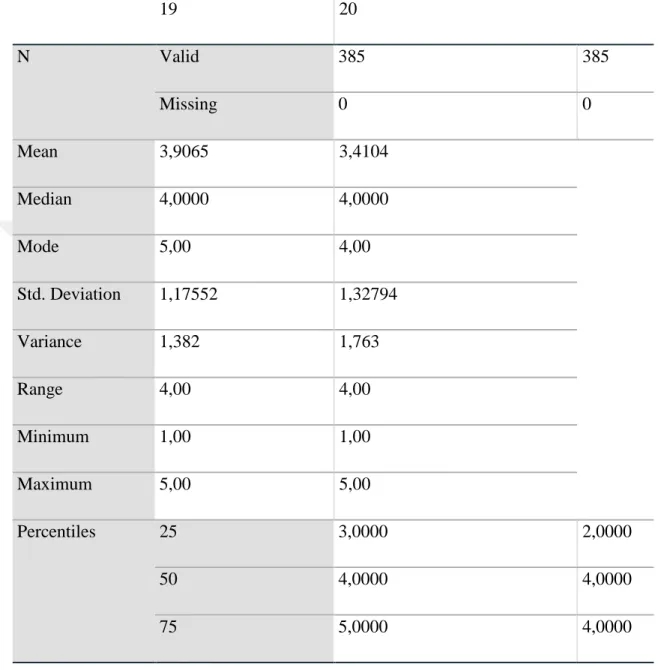
19 20 N Valid 385 385 Missing 0 0 Mean 3,9065 3,4104 Median 4,0000 4,0000 Mode 5,00 4,00 Std. Deviation 1,17552 1,32794 Variance 1,382 1,763 Range 4,00 4,00 Minimum 1,00 1,00 Maximum 5,00 5,00 Percentiles 25 3,0000 2,0000 50 4,0000 4,0000 75 5,0000 4,0000
The above table equally continues with the results of the questionnaires. The mean is 3,9065 and 3,4104 for question 19 and 20 respectively. The median is 4,0000 and the mode is 5.00. The standard deviation is 1,17552 and 1,32794. The minimum scale for both questions is 1 and the maximum scale is 5.
31 4.5 Demographic Frequency Distribution
Demographic frequency distribution for demographic questions can be seen in the tables below.
Table 4.8: Demographic Frequency for Gender.
Frequency Percent Valid Percent
Cumulative Percent
Valid Male 230 59,7 59,7 59,7
Female 155 40,3 40,3 100,0
Total 385 100,0 100,0
The Demographic frequency for gender presents a total sampling size of 385, with the frequency for male being 230, and that of female 155. The percentage for male is 59.7 while that of male is 40.3. This is a clear indication that more male are employ than females.
Table 4.9: Demographic Frequency for Educational Qualification
Frequency Percent Valid Percent
Cumulative Percent
Valid High School 162 42,1 42,1 42,1
Bachelor 148 38,4 38,4 80,5
Master 68 17,7 17,7 98,2
PhD 7 1,8 1,8 100,0
32
The results for demographic frequency for educational qualification indicates that from the 385 sample size of 385, the number of employees with high school qualification is 162 with 42,1%, Valid percent 42,1% and Cumulative percent 42,1 %. Number of employees with bachelor degree qualification is 148 with 38, 4%, valid percent 38, 4% and Cumulative percent 80, 5%. The number of employees with mater degree qualification is 68 with 17, 7%, Valid percent of 17, 7% and Cumulative percent of 98, 2%. Employees with PhD degree are just 7 with 1, 8%, Valid percent of 1, 8% and cumulative percent 100, 0%.
Table 4.10: Demographic Frequency for Job Sector.
Frequency Percent Valid Percent
Cumulative Percent
Valid Private 206 53,5 53,5 53,5
Public 179 46,5 46,5 100,0
Total 385 100,0 100,0
From the table above, the Demographic frequency for job sector shows a total number of valid cases is385 with the private sector having a percentage of 53, 5% and the public sector having 46.5%. The result shows that the frequency for Private is 206 while that of public sector is 179. This gives a clear fact that majority of people are employ in private sectors than in public sectors.
4.6 Frequency Distribution of Job Satisfaction and Job Performance Questions Job satisfaction and job performance are two correlated variables in this study and the survey questionnaire can be analysis in the following tables.
33
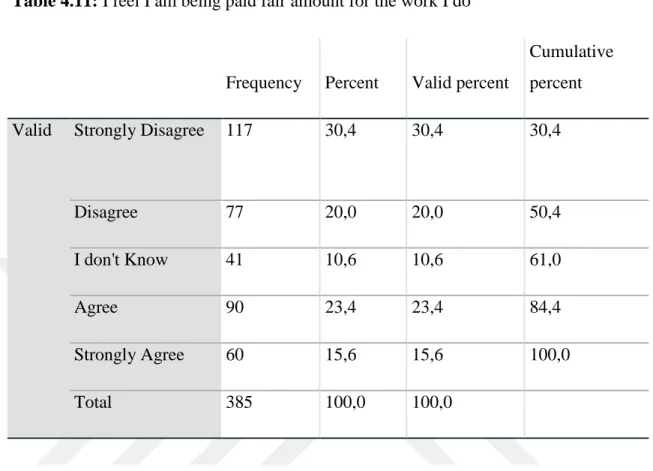
Table 4.11: I feel I am being paid fair amount for the work I do
Frequency Percent Valid percent
Cumulative percent
Valid Strongly Disagree 117 30,4 30,4 30,4
Disagree 77 20,0 20,0 50,4
I don't Know 41 10,6 10,6 61,0
Agree 90 23,4 23,4 84,4
Strongly Agree 60 15,6 15,6 100,0
Total 385 100,0 100,0
From the first question of the questionnaire, it was found that a frequency of 117 respondents strongly disagree they fell they are being paid fair amount for the work they do. This gives a percentage of 30.4, valid percentage of 30,4 and a cumulative percent of 30,4.77 (20%) respondents Disagree to the question, 41(10.6%) responded said they didn't know, 90 (23.4%) respondents Agree and 60 (15.6%) strongly agree. Majority of the respondents strongly disagree that they are being paid fare amount for the work they do.
Table 4.12: There is really too little chance for promotion on my job
Frequency Percent Valid percent
Cumulative percent
34 Disagree 84 21,8 21,8 45,2 I don't Know 89 23,1 23,1 68,3 Agree 76 19,7 19,7 88,1 Strongly Agree 46 11,9 11,9 100,0 Total 385 100,0 100,0
For the chance to promotion, out of 385, 90 respondents scoring a 23.4% strongly disagree there is really too little chance for promotion on their job. This implies that most employees have the chance to promotion in the organization and this keeps them satisfied with their job. The result also illustrates that the frequency of 84(23.4%) respondents disagree to the fact that there is really too little chance promotion on their job. Also, 89 (23.1%) responded didn't know, 76(19.7%) agree, and 46(11.9%) strongly agree.
Table 4.13: My supervisor is quite competent in doing his/her job
frequency Percent Valid percent
Cumulative percent
Valid Strongly Disagree 26 6,8 6,8 6,8
Disagree 44 11,4 11,4 18,2
I don't Know 73 19,0 19,0 37,1
Agree 132 34,3 34,3 71,4
Strongly Agree 110 28,6 28,6 100,0
35
The supervisor is competent in doing his/her job as majority of the respondents, that is, 132 respondents with a 34.3% agree to this question. In addition to this, it was found that the frequency of 26 (6.8%) strongly disagree to the fact that their supervisor is competent in their job, 44 (11.4%) respondents disagree, 73 respondents didn't know and 110 (28.6%) strongly agree.
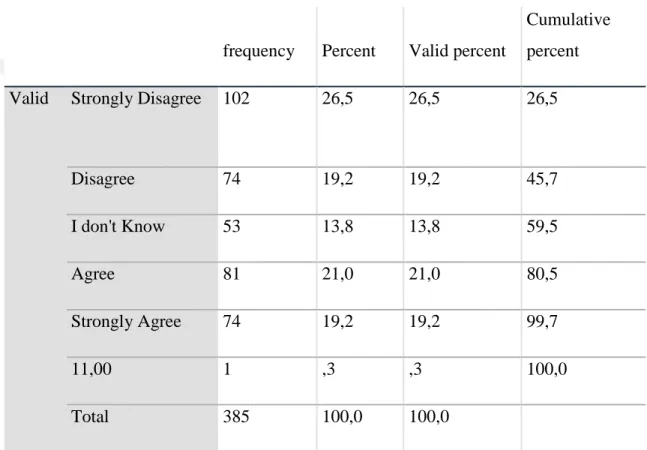
Table 4.14: I am not satisfied with the benefits I receive
frequency Percent Valid percent
Cumulative percent
Valid Strongly Disagree 102 26,5 26,5 26,5
Disagree 74 19,2 19,2 45,7 I don't Know 53 13,8 13,8 59,5 Agree 81 21,0 21,0 80,5 Strongly Agree 74 19,2 19,2 99,7 11,00 1 ,3 ,3 100,0 Total 385 100,0 100,0
Results of the table above shows that the frequency of 102 respondents (26.5%) strongly disagree to the fact that they are not satisfied with the benefits they receive from their companies.74 (19.2%) respondents disagree to the question, 53 respondents didn't know if they satisfied with the benefits they receive or not, 81 (21%) respondents agree and 74 (19.2%) respondents strongly agree. Majority of the respondents stood for the fact they strongly disagree with the satisfaction of their benefits.
36
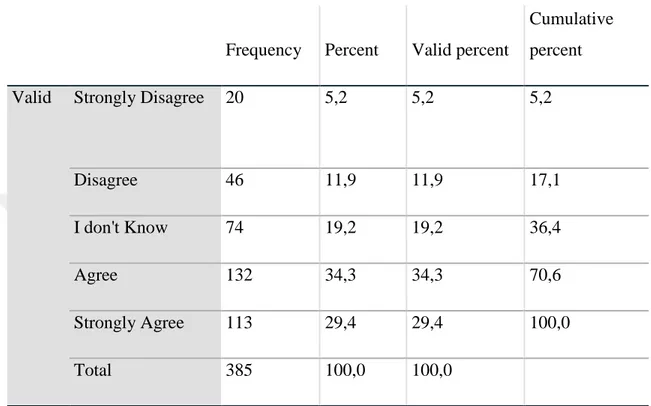
Table 4.15: When I do a good job I receive the recognition for it that I should receive
Frequency Percent Valid percent
Cumulative percent
Valid Strongly Disagree 20 5,2 5,2 5,2
Disagree 46 11,9 11,9 17,1
I don't Know 74 19,2 19,2 36,4
Agree 132 34,3 34,3 70,6
Strongly Agree 113 29,4 29,4 100,0
Total 385 100,0 100,0
According to the table above, agree received more answers to the question ‘When I do a good job, I receive the recognition for it that I should receive’. This shows that 132 respondents given a 34.3 % receive recognition when they do a good job. 20 (5.2%) respondents strongly disagree, 46 (11.9%) respondents disagree, 74 respondents didn't know if when they do good job, they receive recognition for it. A good number of respondents strongly agree to this fact. That is 113 (29.4%).
Table 4.16: I like people I work with
Frequency Percent Valid percent
Cumulative percent
37 Disagree 30 7,8 7,8 14,0 I don't Know 38 9,9 9,9 23,9 Agree 132 34,3 34,3 58,2 Strongly Agree 161 41,8 41,8 100,0 Total 385 100,0 100,0
From the first question of the questionnaire, it was found that a frequency of 24 respondents strongly disagree they fell they are being paid fair amount for the work they do. This gives a percentage of 6.2.30 (7.8%) respondents Disagree to the question, 38(9.9%) responded said they didn't know, 132(34.3%) respondents Agree and 161 (41.8%) strongly agree. Majority of the respondents strongly agree that they like the people they work with.
Table 4.17: I sometimes feel my job is meaningless
frequency Percent Valid percent
Cumulative percent
Valid Strongly Disagree 62 16,1 16,1 16,1
Disagree 86 22,3 22,3 38,4
I don't Know 104 27,0 27,0 65,5
Agree 75 19,5 19,5 84,9
Strongly Agree 58 15,1 15,1 100,0
38
Majority of employees do not really know if they sometimes feel their job is meaningless. 104 of the employees do not know about this question. 62 (16.1%) respondents strongly disagree that they sometimes feel their job is meaningless. 86 (22.3%) respondents disagree to this fact, 75 (19.5%) respondents agree, and 58 (15.1%) respondents strongly agree.
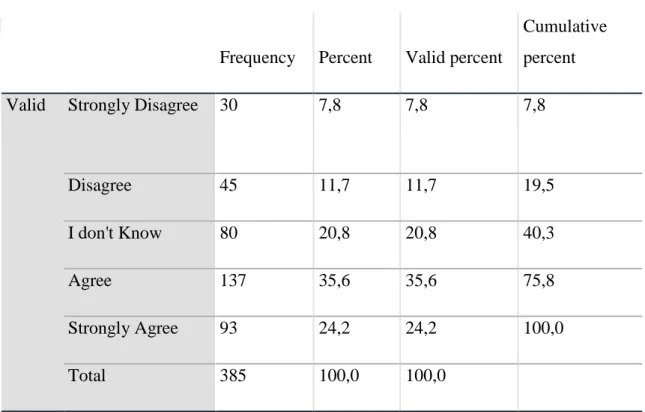
Table 4.18: Communications seem good within this organization
Frequency Percent Valid percent
Cumulative percent
Valid Strongly Disagree 30 7,8 7,8 7,8
Disagree 45 11,7 11,7 19,5
I don't Know 80 20,8 20,8 40,3
Agree 137 35,6 35,6 75,8
Strongly Agree 93 24,2 24,2 100,0
Total 385 100,0 100,0
The results of the table above shows that majority of the respondents strongly disagree to the fact that communication seem good within their organization. For instance, 137 (35.6%) employees agree that communication seems good in the organization. 45 (11.7%) respondents disagree, 80 (20.8%) respondents didn't know and 93 (24.2%) respondents strongly agree.
39
Table 4.19: Those who do well on the job stand a fair chance of being promoted
Frequency percent Valid percent
Cumulative percent
Valid Strongly Disagree 54 14,0 14,0 14,0
Disagree 91 23,6 23,6 37,7
I don't Know 104 27,0 27,0 64,7
Agree 73 19,0 19,0 83,6
Strongly Agree 63 16,4 16,4 100,0
Total 385 100,0 100,0
The answer to the question ‘those who do well on the job stand a fair chance of being promoted’ attracted 104 employees who said ‘I don’t know’ as majority. 104 respondents scoring a % 27.0 don’t know about this question. 54(14%) respondents strongly disagree, 91 (23.6%) respondents disagree, 73 (19%) respondents agree and finally, 63(16.4) respondents strongly agree.
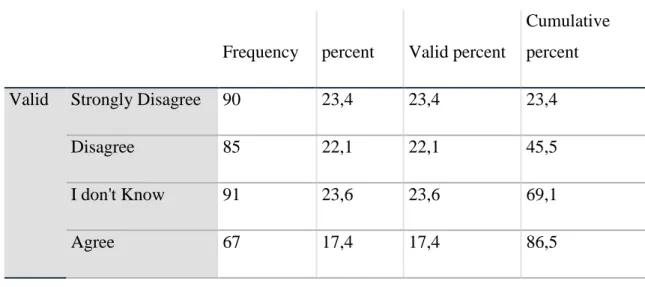
Table 4.20: My supervisor is unfair to me
Frequency percent Valid percent
Cumulative percent
Valid Strongly Disagree 90 23,4 23,4 23,4
Disagree 85 22,1 22,1 45,5
I don't Know 91 23,6 23,6 69,1
40
Strongly Agree 52 13,5 13,5 100,0
Total 385 100,0 100,0
Results from the question ‘my supervisor is unfair to me’ shows that 91 employees said ‘I don’t know’. This number of 91 scores a % 22.6. in addition to this, 90 (23.4%) respondents strongly disagree, 85 (22.1%) respondents disagree, 67(17.4%) respondents agree and 52 (13.5%) respondents strongly agree.
Table 4.21: The benefits we receive are as good as most other organization
Frequency percent Valid percent
Cumulative percent
Valid Strongly Disagree 49 12,7 12,7 12,7
Disagree 67 17,4 17,4 30,1
I don't Know 103 26,8 26,8 56,9
Agree 111 28,8 28,8 85,7
Strongly Agree 55 14,3 14,3 100,0
Total 385 100,0 100,0
The answer to the question ‘the benefits we receive are as good as most other organization’ attracted 111 employees who said ‘I agree. 111 respondents scoring a % 28.8 agreed to this question. Results of the table above also shows that the frequency of 49 respondents (12.7%) strongly disagree to the fact that the benefits they receive are as good as most other organization. 67 (17.4%) respondents disagree to the question, 103 respondents didn't know if they satisfied with the benefits they receive or not, 55 (14.3%) respondents strongly agree.