INVESTIGATING THE EFFECT OF
CATALYSTS IN SODIUM-OXYGEN
BATTERIES
a thesis submitted to
the graduate school of engineering and science
of bilkent university
in partial fulfillment of the requirements for
the degree of
master of science
in
materials science and nanotechnology
By
Mohammad Fathi Tovini
November 2017
INVESTIGATING THE EFFECT OF CATALYSTS IN SODIUM-OXYGEN BATTERIES
By Mohammad Fathi Tovini November 2017
We certify that we have read this thesis and that in our opinion it is fully adequate, in scope and in quality, as a thesis for the degree of Master of Science.
Eda Yılmaz(Advisor)
Damla Ero˘glu Pala
Burak ¨Ulg¨ut
Approved for the Graduate School of Engineering and Science:
Ezhan Kara¸san
ABSTRACT
INVESTIGATING THE EFFECT OF CATALYSTS IN
SODIUM-OXYGEN BATTERIES
Mohammad Fathi Tovini
M.S. in Materials Science and Nanotechnology Advisor: Eda Yılmaz
November 2017
The unique electrochemical and chemical features of sodium oxygen (Na-O2)
bat-teries distinguish them from the lithium-oxygen (Li-O2) batteries. NaO2, which
is the main discharge product, is unstable in the cell environment and its disso-lution in the electrolyte triggers side products formation and charging potential increment. In the first part of this thesis, RuO2 nanoparticles (NPs) dispersed on
carbon nanotubes (CNTs) are used as a catalyst for Na-O2 batteries to elucidate
the effect of catalyst on this complex electrochemical system. RuO2/CNT
con-tributes to the formation of a poorly crystalline and coating like NaO2 structure
during oxygen reduction reaction (ORR) which is drastically different from the conventional micron sized cubic NaO2 crystals deposited on CNT. Our findings
demonstrate a competition among NaO2 and side products decompositions for
RuO2/CNT during oxygen evolution reaction (OER). We believe that this is due
to the lower stability of coating like NaO2 because of its non-crystalline nature
and high electrode/electrolyte contact area. Although RuO2/CNT catalyzes the
decomposition of side products at a lower potential (3.66 V) compared to CNT (4.03 V), it cannot actively contribute to the main electrochemical reaction of the cell during OER (NaO2 −−→ Na++ O2 + e–) due to the fast chemical
de-composition of film NaO2 to side products. Even though the long term effect of
RuO2 catalyst during cycling and resting tests seems to be positive in terms of
lower overpotential, no benefits of catalyst is observed for stability and efficiency of the cell for the first cycles. Therefore, tuning the morphology and crystallinity of NaO2 by catalyst is detrimental for Na-O2 cell performance and it should be
taken into account for the future applications.
In the second part of this thesis, a 3D RuO2/Mn2O3/carbon nanofiber (CNF)
composite has been prepared as a bi-functional electrocatalyst towards oxygen re-duction reaction (ORR) and oxygen evolution reaction (OER) in Na-O2 batteries.
iv
CNF (1395 mAh.gcarbon-1), Mn2O3/CNF (3108 mAh.gcarbon-1) and RuO2/CNF
(4859 mAh.gcarbon-1), which is believed to be due to its higher active surface area
than its counterparts and its unique morphology. Taking the benefit of RuO2
and Mn2O3 synergistic effect, the decomposition of inevitable side products at
the end of charge occurs at 3.838 V vs. Na/Na+ by using RuO
2/Mn2O3/CNF,
which is 388 mV more cathodic compared with CNF.
Keywords: Catalyst, Na-O2 battery, NaO2dissolution, oxygen evolution reaction,
¨
OZET
SODYUM-OKSIJEN PILLERDE KATALIZ ¨
ORLERIN
ETKILERININ ARAS
¸T˙IR˙ILMAS˙I
Mohammad Fathi Tovini
Malzeme Bilimi ve Nanoteknoloji, Y¨uksek Lisans Tez Danı¸smanı: Eda Yılmaz
Kasım 2017
Sodyum-oksijen (Na-O2) pillerin ¸ssiz elektrokimyasal ve kimyasal ¨ozellikleri
on-ları lityum-oksijen (Li-O2) pillerden ayrı kılmaktadır. Ana de¸sarj ¨ur¨un¨u olan
NaO2, h¨ucre ortamında kararsızdır ve bu ¨ur¨un¨un elektrolit i¸cerisinde ¸c¨oz¨unmesi
yan ¨ur¨un olu¸sumunu tetiklemekte ve ¸sarj potansiyelinin artmasına sebep olmak-tadır. Bu tezin ilk kısmında, karbon nanot¨upler (KNT) ¨uzerinde da˘gıtılmı¸s RuO2
nanopar¸cacıkları Na-O2 piller i¸cin kataliz¨or olarak kullanılmı¸s ve kataliz¨or¨un
bu kompleks sistem ¨uzerindeki etkileri aydınlatılmaya ¸calı¸sılmı¸stır. RuO2/KNT
katotların oksijen indirgenme reaksiyonu (ORR) sırasında sadece KNT katot-ları kullanıldı˘gı zaman olu¸san mikron boyuttaki k¨ubik NaO2 kristalleri yerine,
d¨u¸s¨uk kristalin ¨ozellikli ve kaplama ¸sekilde NaO2 yapısı olu¸sumunu sa˘gladıkları
g¨ozlemlenmi¸stir. Bulgularımız bizlere oksijen y¨ukseltgeme reaksiyonu (OER) sırasında NaO2 ve yan ¨ur¨un par¸calanmas¸s arasında bir yarı¸sın s¨oz konusu
oldu˘gunu g¨ostermi¸stir. Bu durumun amorf yapıdaki ve kaplama ¸seklinde olu¸san NaO2 ur¨¨ un¨un¨un d¨u¸s¨uk kararlılı˘gının ve y¨uksek elektrot/elektrolit temas alanının
bir neticesi oldu˘gu d¨u¸s¨un¨ulmektedir. RuO2/KNT katotlarının (3.66 V) yan
¨
ur¨unlerin par¸calanmasının KNT katotları (4.03 V) ile kar¸sıla¸stırıldı˘gında katal-ize ettikleri g¨or¨ulm¨u¸s olsa da, bu katotların NaO2’nin yan ¨ur¨unlere ¸cok hızlı bir
¸sekilde d¨on¨u¸smesinden dolayı ¸sarj sırasında olu¸san ana reaksiyon olan OER’a (NaO2 −−→ Na+ + O2 + e–) aktif olarak katkı sa˘glayamadıkları g¨or¨ulm¨u¸st¨ur.
Her ne kadar RuO2 kataliz¨orlerin uzun vadede ¸cevrim ve dinlenme i¸slemlerinde
h¨ucre y¨uksek gerilimini d¨u¸s¨urme ¨uzerinde pozitif etkisi oldu˘gu s¨oylenebilir olsa da kataliz¨or¨un ilk ¸cevrimlerde h¨ucre kararlılı˘gına ve verimine bir faydasıı ol-madı˘gı g¨ozlemlenmi¸stir. Bu a¸cıdan bakıldı˘gında NaO2’nin morfolojisinin ve
kristal ¨ozelli˘ginin kataliz¨or tarafından ayarlanmasının Na-O2 h¨ucre performansına
zararlı bir etkisinin oldu˘gu ortaya konmu¸stur ve bunun gelecekteki uygulamalarda g¨oz ¨on¨unde bulundurulması gerekmektedir.
vi
Tezin ikinci kısmında, 3 boyutlu (3D) RuO2/Mn2O3/karbon nanofiber
(KNF) kompozitler hazırlanmı¸s ve bi-fonksiyonel elektrokataliz¨orler olarak ORR ve OER proseslerine y¨onelik olarak Na-O2 pillerde kullanılmı¸slardır.
RuO2/Mn2O3/KNF?nin (9352 mAh.gcarbon-1) di˘ger KNF (1395 mAh.gcarbon-1),
Mn2O3/KNF (3108 mAh.gcarbon-1) ve RuO2/KNF (4859 mAh.gcarbon-1)
katot-larına g¨ore ¸cok daha y¨uksek spesifik kapasite sa˘glamı¸stır ve bunun sebebinin di˘ger malzemelerden daha y¨uksek aktif y¨uzey alanı ve e¸ssiz morfolojisi oldu˘gu d¨u¸s¨un¨ulmektedir. RuO2 ve Mn2O3 malzemelerinin sa˘gladıkları sinerjistik etki ile
¸sarj sırasında yan ¨ur¨unlerin par¸calanması KNF’ye g¨ore 388 mV daha katodik olan 3.838 V’da ger¸cekle¸smi¸stir.
Anahtar s¨ozc¨ukler : Kataliz¨or, Na-O2 Piller, NaO2 C¸ ¨oz¨unmesi, Oksijen
Acknowledgement
Hereby, I want to thank my supervisor Dr. Eda Yilmaz for her inspiring sup-ports during my study and her trust to give me the golden opportunity of being involved in this project. I also thank my adorable friends who are my biggest achievement during this time for being always around. My biggest love to my family at the end. . .
I acknowledge TUBITAK for the financial support with the project number 115M375.
Contents
1 INTRODUCTION 1
1.1 Energy of Future . . . 1
1.2 Brief History . . . 2
1.3 Working Mechanism of Na-O2 Battery . . . 5
1.4 Critical Issues . . . 9
1.4.1 Cathode Electrode Reactions . . . 9
1.4.2 Battery Components Stability . . . 12
1.5 Cathode Materials for Na-O2 Battery . . . 14
1.5.1 Carbon Materials . . . 15
1.5.2 Catalysts . . . 16
1.6 Motivation . . . 17
2 EXPERIMENTAL 19 2.1 RuO2/CNT and CNT Cathodes Preparation . . . 19
CONTENTS ix
2.2 Fabrication of CNF . . . 20 2.3 Preparation of Mn2O3/CNF, RuO2/CNF and RuO2/Mn2O3/CNF 20
2.4 Na-O2 Cell Assembly . . . 22
2.5 Electrochemical Characterizations . . . 22 2.6 Further Characterization Methods . . . 23
3 RESULTS AND DISCUSSION 24 3.1 RuO2/CNT Cathode . . . 24
3.2 RuO2/Mn2O3/CNF Cathode . . . 46
List of Figures
1.1 Comparison of the energy density of different battery types [8]. . . 3 1.2 Schematic of the four different architectures of metal-O2 batteries.
(a) aprotic, (b) aqueous, (c) solid state and (d) hybrid [13]. . . . 7 1.3 Working mechanism of a rechargeable Na-O2 battery [19]. . . 8
1.4 Schematic illustration of solution mediated route (route 1) and surface mediated route (route 2) for NaO2 deposition during
Na-O2 battery discharge [23]. . . 10
2.1 Schematic illustration of 3D RMC composite preparation. Electrospun-CNF was used as the backbone for Mn2O3 nanorods
deposition in the first hydrothermal step. Then, RMC was pre-pared during the second hydrothermal step by using MC as the template for RuO2 nano-particles deposition. . . 21
3.1 (a) TEM image of RuO2/CNT and RuO2 particle size distribution
over CNTs (scale bar indicates 10 nm). (b) First DC/RC curves of CNT (blue) and RuO2/CNT (red) at a current density of 100
LIST OF FIGURES xi
3.2 Characterization of RuO2/CNT by XPS (a) Ru3d, (b) O1s and (c)
Raman spectroscopy. The inset in (c) is the enlarged graph of the shaded spectrum. . . 25 3.3 SEM images of pristine (a) CNT and (b) RuO2/CNT. Both of
the samples show same pore size and distribution. The scale bars represent 500 nm. . . 26 3.4 The stepwise DC/RC cycling of RuO2/CNT and CNT with a
lim-ited capacity of 5000 mAhg-1 at a current density of 100 mAg-1. After each step (a: DC, b: RC to 2.6 V and c: RC), the cells were disassembled and the cathodes were rinsed with acetonitrile for post mortem characterizations by XPS, SEM and NMR (Figures 3.5-3.8) in order to recognize the identity of products responsible for each plateau. . . 28 3.5 XPS C1s spectra of the stepwise cycled (a) CNT and (b)
RuO2/CNT in Figure 3.4. . . 29
3.6 XPS O1s spectra of the stepwise cycled (a) CNT and (b) RuO2/CNT in Figure 3.4. . . 30
3.7 SEM images of the stepwise cycled (a-c) CNT and (d-f) RuO2/CNT in Figure 3.4, (a and d) DC, (b and e) RC 2.6 V
and (c and f) RC. Scale bars represent 2 µm. . . 31 3.8 1HNMR spectra of the stepwise cycled (a) CNT and (b)
RuO2/CNT in Figure 3.4. 1H chemical shifts (δ) of HDO,
tetraglyme, acetate and formate are observed at 4.78, 3.35-4, 1.92 and 8.46 ppm [49], respectively, compatible with the XPS results. 32
LIST OF FIGURES xii
3.9 Galvanostatic charge of fresh CNT and RuO2/CNT cathodes
with-out pre-discharge. No significant plateau is observed in the charg-ing curves of CNT and RuO2/CNT up to 4.2 and 4 V,
respec-tively, indicating that the plateaus observed in charging curves of cathodes in Figure 3.1 and Figure 3.13 are not corresponding to electrolyte decomposition. . . 32 3.10 NaO2 crystal and morphology characterization on CNT and
RuO2/CNT. (a) XRD patterns of CNT (blue) and RuO2/CNT
(red) at different states of: as prepared (bottom), first discharged (DC, middle) and first recharged (RC, up), with a limited capacity of 1.5 mAh. The symbol of * denotes NaO2 reflection. (b-e) SEM
images of CNT-DC (b and d) and RuO2/CNT-DC (c and e). Scale
bars indicate (b and c) 2 µm and (d and e) 500 nm. (f-h) TEM images of DC (f) CNT and (g and h) RuO/CNT cathodes. Scale
bars indicate (f) 50 nm, (g) 10 nm and (h) 5 nm. . . 34 3.11 Raman spectra of pristine, DC and RC (a) CNT and (b)
RuO2/CNT. The presence of a sharp signal at 1155 cm-1 in DC
spectra which is corresponding to the O-O stretch bonding of NaO2
and its absence in RC spectra demonstrates NaO2 deposition as
the main discharge product and its decomposition during RC [12]. 35 3.12 TEM images and electron diffraction patterns of (a, b) DC CNT
and (c, d) DC RuO2/CNT cathodes. Scale bars indicate (a) 200
LIST OF FIGURES xiii
3.13 Electrochemical measurements of CNT and RuO2/CNT. (a and b)
Galvanostatic DC/RC of RuO2/CNT and CNT at 100 mAg-1with
a limited capacity of 1000 mAhg-1 (a) without and (b) with 30
days resting between DC and RC. Inset in (a) shows the magnified graph of the beginning 350 mAhg-1 of DC, in which NaO2
decom-poses at lower potential in RuO2/CNT compared to CNT during
OER. (c) The results of charging potentials versus resting spans for the samples rested 0-30 days between DC and RC, extracted from Figure 3.14. The time domain is divided to short and long terms, in which RuO2/CNT cathode exhibits higher and lower RC
average potentials, respectively. (d) Cycling performance of CNT and RuO2/CNT with a current density of 100 mAg-1 and limited
capacity of 1000 mAhg-1. The black triangles (linked to the left
y-axis) show the capacity of both cathodes during cycling and the blue squares and red circles (linked to the right y-axis) indicate the average RC potential during cycling for CNT and RuO2/CNT,
re-spectively. . . 40 3.14 Galvanostatic DC/RC curves of (a) CNT and (b) RuO2/CNT at
100 mAg-1 and limited capacity of 1000 mAhg-1, with 0-30 days
resting between DC and RC. Obviously, the relative length of low-est potential plateau decreases by increasing rlow-esting days, indicat-ing that the side products formation by NaO2degradation is a time
dependent chemical process. . . 41 3.15 Galvanostatic DC/RC measurements of (a) CNT and (b)
RuO2/CNT at different current rates of 50-500 mAg-1 with a
lim-ited capacity of 1000 mAhg-1. It is apparent that by increasing the current rate, the relative lengths of lowest potential plateaus cor-responding to NaO2 decomposition increase. This may be due to
the shorter NaO2/electrolyte exposure time at higher current rates
LIST OF FIGURES xiv
3.16 SEM images of (a, b) CNT and (c, d) RuO2/CNT cathodes
dis-charged to 1000 mAhg-1 and rested for 30 days. The scale bars
indicate (a-c) 1µm and (d) 500 nm. The roughen surface of NaO2
is indicative of surface side reactions during resting time without applying any current in OCP. The effect of side reactions is more severe on the morphology of smaller cubes in (b) and film NaO2 in
(c, d) due to their higher exposed surface area to the electrolyte. . 42 3.17 Cycling performance of (a) CNT and (b) RuO2/CNT with a
lim-ited capacity of 1000 mAhg-1 at a current density of 100 mAg-1. . 43 3.18 (a and b) SEM images and (c and d) XPS C1s spectra of (a and c)
CNT and (b and d) RuO2/CNT after 20 DC/RC cycles. Scale bars
in (a and b) represent 500 nm. According to the SEM images, the accumulation of side products on the surface of CNT is more severe than RuO2/CNT after 20 cycles, which is further approved by the
XPS C1s spectra, in which the ratio of C-C: functional groups signal is lower in CNT than that of RuO2/CNT. Therefore, it can
be realized that RuO2 actively contributed to the decomposition
of side products during cycling. . . 44 3.19 SEM images of the separators after 20 DC/RC cycles, (a) CNT and
(b) RuO2/CNT. The scale bars represent 2.5 µm. The separators
surface coverage by some products is indicative of the presence of dissolved species in the electrolyte, as a result of O2- dissolution,
which can migrate and deposit on different cell components. . . . 45 3.20 Schematic illustration of NaO2 nucleation and growth on (a) CNT
and (b) RuO2/CNT cathode. . . 46
3.21 SEM images of (a) CNF, (b) MC, (c) RMC and (d) RC (Scale bars, 200 nm). . . 47
LIST OF FIGURES xv
3.22 TEM (a and c) and HRTEM (b and d) images of MC (a and b) and RMC (c and d). Inset in b and d is the corresponding SAED pattern. Inset in c represents the EDS elemental line scan of RMC (Scale bars, a: 50 nm, b and d: 5nm, c and inset: 50 nm). . . 48 3.23 HAADF-STEM images of (a) MC and (b) RMC. Inset in b is
higher magnification STEM image of the selected rectangular area. Additional HRTEM images of (c) MC and (d) RMC. Inset in d represents the particle size distribution of RuO2 nanoparticles on
Mn2O3 nano-rods. (e and f) TEM images of RC (Scale bars, a and
b: 100 nm, b inset: 20 nm, c and d: 5 nm, e: 50 nm and f: 20 nm). 50 3.24 (a) XRD patterns and (b) Raman spectra of CNF, RC, MC and
RMC. . . 51 3.25 (a) Galvanostatic discharge/charge plots of CNF, MC, RC and
RMC at a current density of 0.05 mA.cm-2, (b) corresponding
Ra-man spectra of the samples at the end of discharge. The dom-inance of the strong peaks in the Raman spectra at 1156 cm-1
(highlighted spectrum) indicates deposition of NaO2 as the main
discharge product at the end of discharge. SEM images of (c) CNF, (d) MC, (e) RC and (f) RMC discharged cathodes. Scale bars represent: (c) 1.5µm and (d-f) 500 nm. Conformal distribu-tion of NaO2 on MC, RC and RMC indicates the catalytic reaction
throughout the whole structures. . . 53 3.26 SEM images of charged CNF (a and e), MC (b and f), RC (c and
g), and RMC (d and h) at low (a-d) and high (e-h) magnifications. Scale bars indicate: (a-d) 1µm and (e-h) 250 nm. . . 54
Chapter 1
INTRODUCTION
1.1
Energy of Future
Fossil fuels are reported as the source of more than 85% of the world’s energy supply during last years. According to experts, this need will grow dramatically in which by 2040, the world’s energy demand will increase 56% because of human population growth and the inevitable world wide industrialization. In this way, fossil fuels reservoirs can only satisfy the energy demand only for another 20 years due to the non-renewable nature and restricted sources of fossil fuels. In addition, it has been more than 15 years that the world is concerned about the accelerating rate of green house gas emission, whose the primary source is directly related to the energy production [1].
The alternative renewable energy sources such as hydro, solar, wind and geother-mal are developed in order to replace fossil fuels. There are several pros of re-placing fossil fuels with renewable energy sources: decrement of green house gases emission to the environment, the creation of new job opportunities in the field of green technologies by developing of diverse energy supplies and etc. Although the sun and wind energies are the most common renewable energy sources for electricity production, the solar energy can be supplied during the daylight and the wind energy is circumstantial. Therefore, these energies are not continuously
supplied when they are needed and consequently, proper energy storage systems are required. Although there are currently many energy storage technologies used in the large scale, they all have some cons including price, capacity, power and mobility. For example, pumped hydro is one of the commonly used techniques in order to store energy, but it requires a large capital expense and proper geo-graphical condition. As a result, energy storage devices with high efficiencies are highly required and batteries are one of the most appropriate candidates for this demand. Batteries can store chemical energy through electrochemical reactions and convert it back into electrical energy and Li batteries are the most applicable ones among the current technologies [2, 3].
1.2
Brief History
The battery was invented by Alessandro Volta in 1800 and since then, it has been the commonly used energy storage device for many applications. Hypo-thetically, there are two main categories of batteries: primary and secondary (rechargeable) batteries. Primary batteries are designed for only one-time usage and then discarded, but the secondary batteries can be used several times by recharging the battery once it is discharged. There are different types of com-mercialized secondary batteries like lead acid, nickel metal hydrate and lithium ion (Li-ion) batteries, however, Li-ion batteries got more attention regarding their better performance compared to the other systems. Lithium batteries were firstly introduced by M.S. Whittingham in 1970s and many distinct contributions were made by John B. Goodenough afterward [4, 5]. Since 1991, when Li-ion batteries were firstly commercialized by Sony, many fundamental and practical advances have been achieved in this field and today, these devices attain the highest capac-ity among the available commercial batteries, which makes them the most proper energy storage systems for diverse applications. However, they suffer from a lim-ited energy density and specific energy (energy per unit volume and unit mass, respectively) for implementation in electric vehicles, even if the theoretical ca-pacity of cathode material is achieved [2]. Accordingly, many efforts have been focused on developing new energy storage technologies beyond Li-ion batteries in
order to overcome these constraints [6]. Metal-O2 batteries (Li-O2, Na-O2 and
etc.) are the best candidates in order to their extremely higher energy density compared to Li-ion batteries and their energy storage mechanism is based on the reaction of metals and O2 and the deposition of solid state discharge products on the porous cathode electrode (Figure 1.1) [7].
Figure 1.1: Comparison of the energy density of different battery types [8].
The first spark of metal-O2 batteries was kindled in 1979 by Blurton and
Sam-mels, publishing the first review on primary metal-O2 batteries [9]. Since primary
metal-O2 batteries exploit atmospheric oxygen as the cathode and eliminate
tra-ditional intercalation ion-based approach, they acquire comparatively higher the-oretical specific energy density. Although the electric vehicle applications of Li-O2
cells were not seen plausible by the authors at the time, the systems achieved high theoretical gravimetric energy density (11148 Wh kg-1 based on Li
2O2 discharge
product) which was close to that of gasoline (13000 Wh kg-1). The subject was
revived in 1990’s by Abraham and Jiang by introducing the first nonaqueous Li-O2 battery which composed of lithium as the anode, a gel polymer electrolyte
and a carbonaceous cathode [10]. In the cathode side, oxygen diffuses through the permeable electrode and gets reduced during the discharge process in order to generate electric power, however, the systems lost the attention during next decade in order to technical difficulties of attaining high energy densities and cycle life. Later on 2006, a Li-O2 cell was made by Bruce et al. in which the
poly-mer electrolyte was replaced by an organic electrolyte and the deposited Li2O2
on cathode electrode during discharge was decomposed to Li and O2 during the
charging process [11]. After this study, a huge attention was drawn to these cells around the world and a tremendous number of studies were dedicated to make these systems more feasible. Nevertheless, it was realized that the insulating na-ture of Li2O2 discharge product imposes high charging over-potential ( typically
> 1V) and low energy efficiency to the system and the limited natural resources of Li encouraged substituting this metal by the mostly abundant alkaline metal on the earth crust, i.e. Na. In 2013, Janek and Adelhelm introduced the first NaO2 based Na-O2 battery, in which comparatively lower charge overpotential (<
0.2 V) was achieved due to the facilitated decomposition kinetics of superoxide species [12]. This behavior motivated much research on these systems and ever since there have been several investigations in order to get a better understanding of the working mechanism and improve the performance of the systems.
In this part, a brief explanation of the different terminologies used to describe bat-teries and their performance is presented. Anode- This electrode reverses during discharge and charge. Anode is the negative electrode during discharge and the positive electrode during charge and it reversibly dissolves inside the electrolyte and gives the load (electron) to the circuit.
Cathode- Like the anode electrode, the cathode electrode reverses and it is the positive electrode during charge and the negative electrode during discharge and it causes oxidation of the anode by taking the electron from it through the circuit.
Electrolyte- It is the chemical compound which provides electrically conducting solution by dissociating or fusing inside a polar solvent like water. When dis-sociated, it separates into cations and anions to conduct the electric current. Battery Cell- It is composed of mainly three compartments including negative
and positive electrodes and electrolyte. The whole setup is made in order to store electrochemical energy.
Discharge- It is known as the conversion of the chemical energy of the battery into the electrical energy and withdrawing it to the load.
Charge- It is the conversion of the electrical energy coming from the external source into the chemical energy inside the battery.
Cycle- A complete sequence of discharge followed by charge or vice versa is called a cycle.
Battery Capacity- The total number of ampere-hours or watt-hours that can be withdrawn from the battery during discharge process before it reaches to the specified ending condition of discharge.
Current Rate- The amount of current which is applied to the battery during dis-charge or dis-charge.
Cycle Life- The number of cycles under a specified condition that battery can perform before its capacity is considerably reduced. It is influenced by the depth of cycles (shallow or deep) and the cutoff of the charge.
Energy Density- The ratio of the accessible energy from the battery to its weight or volume (watt-hours/kilogram or watt-hour/liter).
Overpotential- it is known as the difference between the thermodynamically de-termined potential of the half reduction reaction and the actual potential which is measured by the experiments. Since in reality, the required energy to perform a reaction is more than the theoretically calculated one, the term is directly corre-lated to the voltage efficiency of the cell. Therefore, all of the conditions including environmental effects, battery compartments and most of all, current density have their individual effects on over potential. Normally, the overpotential is reported by the current density in which the experiment is taken place.
1.3
Working Mechanism of Na-O
2Battery
Different types of electrolytes can be used to make a metal-O2 battery cell in
electrolyte type, there are four main cell architectures: (a) aprotic, (b) all-solid-state, (c) aqueous and (d) hybrid, as shown in Figure 1.2 [13]. The cathode active material is oxygen which should be supplied from the air or any other reservoir and metallic Na is the anode material for all types of the cells at the current stage. As can be seen in Figure 1.2 (b) and (c), a protective layer is required to make a hybrid or aqueous system in order to prevent the vigorous reaction between water and highly active Na metal. According to the many re-searches performed, the theoretical capacity of a non-aqueous system is higher than an aqueous system, since the chemical/electrochemical processes in aqueous systems include the reaction of O2 with water and consequently dropping the cell
capacity. There are very few studies about all-solid-state metal-O2 systems since
the metal conductivity of the solid state electrolytes is a limiting factor for these systems [14]. Since the non-aqueous Na-O2 batteries are the most investigated
systems among the others, we focus on non-aqueous Na-O2 batteries in this
the-sis.
The performance of Na-O2 batteries is dependent on many parameters
includ-ing the type of cathode material and the non-aqueous electrolyte, humidity, O2
pressure and CO2 content [15, 16]. Among all parameters, cathode materials and
non-aqueous electrolytes have attracted most of the research attention in Na-O2
batteries in the early step of their development. Today, pure metallic Na is the most used anode material but regarding its highly active nature and safety
Figure 1.2: Schematic of the four different architectures of metal-O2 batteries.
(a) aprotic, (b) aqueous, (c) solid state and (d) hybrid [13].
issues, it should be replaced by some appropriate alternatives for future large scale production. However, the main issue today is to find a suitable cathode material which can catalyze the both ORR and OER reactions during discharge and charge processes, respectively [17]. The working principle of the non-aqueous Na-O2 battery is schematically shown in Figure 1.3 [18]
Generally, the type of discharge product which is deposited on the cathode side during ORR has the main influence on the cell behavior during discharge/charge. To date, two main types of discharge products are reported in Na-O2battery
stud-ies including sodium superoxide (NaO2) and sodium peroxide (Na2O2), therefore
it is noteworthy to have a better understanding on how the thermodynamics and kinetics predict the formation of these products.
Figure 1.3: Working mechanism of a rechargeable Na-O2 battery [19].
Equations (1.1)-(1-7) show the all possible reactions between Na and O2
dur-ing discharge process in non-aqueous Na-O2 batteries [12].
Na++ e– −−*)−− Na E0–– – 2.71 vs · SHE (1.1)
2 Na++ 2 e– + O2 −−*)−− Na2O2E0–– – 0.38 V vs · SHE (1.2)
2 Na + O2 −−*)−− Na2O2E0Na2O2–– 2.33 V vs · Na/Na
+(overall reaction) (1.3)
Na++ e– + O2 −−*)−− NaO2E0–– – 0.44 V vs · SHE (1.4)
Na + O2 −−*)−− NaO2E0NaO2–– 2.27 vs · Na/Na +
(overall reaction) (1.5) 2 Na++ 2 e– +12 O2 −−*)−− Na2O E0–– – 0.76 V vs · SHE (1.6)
2 Na + 12O2 −−*)−− Na2O E0Na2O–– 1.95 V vs · Na/Na
+(overall reaction) (1.7)
Neither thermodynamics nor kinetics predicts the formation of Na2O during
dis-charge since it follows a two electron transfer reaction taking place at lower poten-tial compared to NaO2 and Na2O2. Although Na2O2 is thermodynamically more
stable compared to NaO2 (E0Na2O2>E0NaO2), the formation of NaO2 is kinetically
favored (1e-/O
2) compared to Na2O2 (2e-/O2). Therefore, one can expect to have
both of these products at the end of discharge. However, it seems that the cell architecture, cathode type, composition of the gas and humidity play the major roles to determine the discharge product type [20, 21]. The reaction can be writ-ten more specifically based on the formation and decomposition of peroxide or
superoxide during discharge/charge as following: O2+ e– −−*)−− O2– (1-8)
Na++ O2– −−*)−− NaO2(1-9)
2 O2– −−*)−− O2+ O22 – (disproportionation) (1-10)
2 Na++ O22 – −−*)−− Na2O2(1-11)
In fact, the discharge product growth mechanism in Na-O2 batteries is not
straightforward and several groups tried to correlate discharge product forma-tion to the mechanism underlying Li-O2 batteries, due to the similarities of these
two systems [22]. Since NaO2 possesses a more pronounced contribution as the
discharge product in Na-O2 cells in recent years, a detailed information on NaO2
formation/decomposition mechanism during battery cycling will be presented in the following section. Anyhow, more in-situ characterization techniques are re-quired to deeply understand the mechanism underlying Na-O2 batteries.
1.4
Critical Issues
considering that Na-O2 batteries are introduced for less than a decade and the
whole researches in this field are dedicated to get the basic knowledge about their mechanism and comparing these systems with state of the art Li-ion batteries and fuel cells, Na-O2 batteries are in their infancy state, therefore, we need to
address many parameters in order to achieve practical applications. The vague chemical and electrochemical reactions on the cathode side, improving the cell behavior by exploiting catalysts and stability of the battery compartments in the cell environment are the main critical challenges which are investigated in recent studies. In this section, we will discuss these three challenges in three parts.
1.4.1
Cathode Electrode Reactions
As mentioned in the previous section, discharge product formation mechanism in Na-O2batteries is quite reminiscent of that in Li-O2batteries. In both cases, there
and surface mediated routes [23]. However, it has been shown that both of the mechanisms play equivalently for the formation of NaO2 in Na-O2 batteries. As
shown in Figure 1.4, in solution mediated route (route 1), oxygen gets reduced on the surface of the bare electrode and migrates to the already nucleated product in order to react with Na+ and produce NaO2. On the contrary, all of the processes
including oxygen reduction and its reaction with Na+ to deposit as NaO2 takes
place on top of already deposited NaO2 in surface mediated route (route 2).
Figure 1.4: Schematic illustration of solution mediated route (route 1) and surface mediated route (route 2) for NaO2 deposition during Na-O2 battery discharge
[23].
According to Nichols et. al., the surface mediated route is constrained by the insulating nature of NaO2, therefore in the following steps of discharge, the
so-lution mediated route is dominating [24]. However, due to the higher intrinsic conductivity of superoxide species than peroxide species, the solution mediated mechanism is expected to be more pronounced when NaO2 is the main discharge
product. The properties of deposited discharge product including its morphology and chemical composition are the factors affecting the electrochemical profile of
the system. Sayed et al reported that smaller NaO2 particles can be deposited
during discharge at high current densities compared to that of lower current den-sities [25]. On the other hand, according to Nichols et al, a film like NaO2 is the
dominating morphology in Na-O2 batteries discharged at higher current densities,
compared to that of cubic particles at lower currents [24]. However, according to Kim et al. NaO2 is unstable in the cell environment and it dissolves inside
the electrolyte by releasing highly active O2-, which consequently results in the
formation of side products, specially Na2O2.2H2O, through the following
reac-tions [19]: Discharge/charge: Na++ O2+ e– −−*)−− NaO2(1-12) dissolution: NaO2 −−→ Na++ O2–(1-13) Proton abstraction: HA + O2– −−→ HO2+ A– (1-14) Disproportionation: 2 HO2 −−→ H2O2+ O2(1-15) Oxidative decomposition: A– + HO2 −−→ CO2, H2O, OH– (1-16) Peroxo-hydroxylation: 2 Na++ 2 OH– + H2O2 −−→ Na2O2· 2 H2O (1-17)
Since the decomposition potential of resulting Na2O2.2H2O during charge is
higher than the original NaO2 discharge product, this process results in an
un-wanted charging over potential increase. Liu et al. and Reeve et al. reported that the highly active nature of NaO2 not only causes decomposition of the
elec-trolyte, it also attacks the carbonaceous cathode and its additives to form more detrimental side products including Na2CO3, NaF, Na2O2, etc [26, 27]. In this
regard, a general trend was governed by a series of works investigating the effect of NaO2 ionization on the cell electrochemistry: increasing the exposure time of
NaO2 to the electrolyte results in the elevated side products formation and
conse-quently precipitous increase in charging over potential [19, 25, 28]. Therefore, the cell operating condition including the time interval between charge and discharge, charge and discharge current densities, the amount of water inside the electrolyte and etc. severely affect the properties of NaO2 and the behavior of battery.
1.4.2
Battery Components Stability
During the last years, numerous studies have been carried out in the development of using organic electrolytes in Li-ion batteries, but there are several concerns in order to use them in Na-O2 or Li-O2 batteries. Followings are the ideal
charac-teristics of an aprotic electrolyte to be exploited in Na-O2 batteries. The most
important issue of the aprotic electrolytes is their stability towards highly active reduced species (O2- and O22-) and anode material as well as the decent solubility
of O2 inside it to enhance the mass transport to the cathode. The volatility of
electrolyte is not desired in the cell environment due to concentration change, and lastly, a sufficient conductivity to maintain the high rate capability is desired. It is noteworthy that the stability of electrolyte is highly dependent on the stability of solvents, sodium anode and salts as well as the other additives.
Among the organic electrolytes, carbonate based electrolytes like propylene car-bonate (PC), dimethyl carcar-bonate (DMC) and ethylene carcar-bonate (EC) have been widely used in the early stage of the development of Li-O2 and Na-O2
batter-ies [11]. However, it was realized that decomposition of these electrolytes severely occurs in the presence of O2 during discharge process and the formation of poi-sonous side products is non-negligible. Na2CO3 and Li2CO3 are the main side
products which accumulate on the electrode surface and their decomposition po-tential during charge is higher than the main discharge products. On the other hand, LiOH and NaOH are the other decomposition side product by the reaction of moisture contaminant and the metallic anode or discharge products. As a result, the over potential increment during charge is inevitable. Therefore, many researches have been focused on finding proper electrolytes to replace in these cells.
Ether based electrolytes are the suitable candidates in order to substitute car-bonate based electrolytes in Na-O2 and Li-O2 batteries, regarding their numerous
advantages including higher stability towards discharge products and O2 reduced
species, higher decomposition potential (> 4 V vs. Li/Li+), low volatility, de-cent wetting property, safety and cheaper price. The most famous ether based
electrolytes are tetraethylene glycol dimethyl ether (TEGDME or 4G) and 1,2-dimethoxyethane (DME). Although Li2O2and NaO2 are the main discharge
prod-ucts in ether based batteries, it is shown that different side prodprod-ucts are identified alongside the main products [29–32]. Therefore, the lower round-trip efficiency, cycling stability and poor rechargeability can be induced by side products. How-ever, ether based electrolytes are the mostly used electrolytes in these systems currently, despite the formation of side products.
Na salt is the other main compartment of the electrolyte and its characteristic has a big influence on determining the reversibility and capacity of Na-O2 systems.
Although Na salt should possess a decent solubility in the solvent to supply Na+
to the system, its anion should be also stable in the cell environment in con-tact with the battery compartments (separators, Na anode, ...), solvents and the reduced O2 species. According to Lutz et al., although the type of anion does
not affect NaO2 deposition and the capacity, it severely changes solid electrolyte
interface (SEI) stability on the anode side and by decreasing the donor number of the anion, a more stable SEI layer can be formed. In this regard, ClO4- had
the most stable SEI layer and on the contrary, by using TFSi-, the degradation occurred in SEI layer [33].
Using a metallic Na anode is another concern in the application of Na-O2batteries
due to Na dendrite formation and safety issues, which constrains its commercial applications. However, since the stability of aprotic electrolyte and the cathode are the biggest issues in these systems which the recent studies have been strug-gling with, pure metallic Na is still being used as the anode electrode. Anyhow, during discharge/charge cycles with higher cycle numbers or deeper cut off ca-pacity, Na dendrite formation is a severe problem [34]. Dendrites in commercial Li-ion batteries can penetrate through the separators and cause the short cir-cuit inside the battery, which results in overheating of the cell and catching fire. As mentioned, the formation of a stable SEI layer is another issue for anode side which should be taken into account by choosing appropriate salts and electrolytes.
1.5
Cathode Materials for Na-O
2Battery
Although Na-O2 batteries benefit from the low cell over potential compared to
Li-O2 batteries due to the facilitated ORR/OER kinetics of superoxide species,
as mentioned in the previous sections, severe time dependent side products for-mation causes precipitous over potential increase during charge in these systems. Even if carbonaceous materials have been reported as a suitable cathode mate-rial for Li-O2 and Na-O2 batteries, they are unable to effectively facilitate OER
reaction. On the other hand, the intrinsically lower capacity of Na-O2 batteries
compared with Li-O2 batteries requires choosing a proper type of electro catalysts
to maximize the capacitance in these systems. Therefore, the new category of cathode materials is required for these purposes.
Various types of catalyst materials have been investigated for the application of fuel cells and other metal-O2 batteries in order to minimize the ORR/OER
over potentials. The catalyst should be designed to be optimized in the case of structure, morphology and phase to effectively increase the energy efficiency of the battery. In the following section, a detailed information about the selection criteria of a proper catalyst material has been presented.
Among all of the characteristics for better batteries, there are four major fac-tors which have the main role in determining the battery performance: specific capacity, round trip efficiency, cycling performance and rate capability, which all can be effectively improved by employing electrocatalysts in the battery [35]. As mentioned above, detrimental side products formation is one of the main reasons for increasing over potential in Na-O2 batteries. Also, the precipitated discharge
products can block the O2 diffusion pores and cause the discharge termination
and limited specific capacity [36]. Therefore, the material design to optimize suf-ficient pore distribution of the cathode and also satisfactory electrode-electrolyte interaction in order to supply ionic transfer are crucial parameters [37–39]. On the other hand, the cathode material should be able to catalyze ORR/OER effec-tively. Recently, many catalyst materials which have performed as the electrode in fuel cells and other metal-O2 batteries have been investigated for Na-O2 and
Li-O2 batteries and in this section, we will mention about carbonaceous
materi-als and transition metal oxides, which are the cathode materimateri-als employed in this study.
1.5.1
Carbon Materials
Among all types of materials employed in energy storage applications, carbon materials are the most common ones due to their superior properties including high surface area and electrical conductivity, low price, light weight and corrosion resistivity [40, 41]. Besides, they are easy to prepare as different cathode forms and shapes and possess acceptable ORR/OER catalytic activity [42].
Due to aforementioned reasons, carbon materials are widely used as catalyst for Li-O2 and Na-O2 applications. Commercial carbon materials like Vulcan XC72,
Ketjen Black and Super P have been used in Na-O2and Li-O2 systems [26, 43–45].
For the commercial carbon materials, defect density and pore size distribution are the important factors specifying the performance of these types of products, specially their specific capacity [46]. Recently, commercial carbon fibers are also exploited in Na-O2 batteries due to their unique structure [47]. Although these
materials present decent capacity when they are used in suitable electrolyte and combined with additives, still better materials are required in order to obtain capacities near to theoretical capacities of Na-O2 batteries.
Carbon nanotubes (CNTs) are very promising candidates as alternative for com-mercial carbon materials. Extremely high surface area and electron conductivity, mechanical strength, thermal and chemical stability and high elasticity make this material a suitable choice as cathode material for Na-O2 systems. Numerous
re-searches in Li-O2 and Na-O2 fields have been reported decent catalytic activity
and ease of handle and characterization of this material [32, 48–51]. Therefore, it has been chosen as the support material in this study.
1.5.2
Catalysts
Transition metal oxides (TMOs) are the most used catalysts for Li-O2 and Na-O2
applications due to their high activity to facilitate ORR/OER. Manganese ox-ide, cobalt oxox-ide, iron oxox-ide, palladium oxide and molybdenum oxide are among TMOs which are mostly reported for Li-O2 and Na-O2 applications, especially by
Bruce and co-authors [11, 52–55].
Cobalt oxide is one of the commonly used catalysts for Li-O2 and Na-O2
ap-plications. In Li-O2 case, it has been reported that this material can achieve a
low charging over potential and a decent capacity retention. Riaz et al. con-cluded that the morphology/architecture of cobalt oxide has a major effect on its catalytic performance by preparing different morphologies of this material in-cluding nano sheets and nano needles [56]. Wen et al. reported the discharge product morphology control by using Co3O4 in Na-O2 batteries and consequently
improved cycling performance of the cell [57]. Sun et al. prepared CNT@Co3O4
by atomic layer deposition of cobalt oxide on CNTs [58]. It was shown that a composition of NaO2/Na2O2 (NaOx) can be achieved by using CNT@Co3O4 and
it can provide the electrochemical decomposition of sodium superoxide, sodium peroxide and sodium carbonate at lower over potentials compared to bare CNT. Manganese based oxides (MnOx) are another types of TMOs which are actively
explored in Na-O2 and Li-O2 applications which can increase round-trip efficiency
and specific capacity. Yadegari et al. revealed ORR/OER mechanism in Na- and Li-O2 batteries by using a solid state Pd-Mn3O4 catalyst [59]. They proved that
ORR/OER catalytic reactions in these systems originate from the stabilization of O2- intermediate species on the surface of the catalyst. They correlated the
catalytic activity of TMOs to the bonding energy of O2species to these materials,
in which the higher bonding energy of O2 to the catalyst surface results in better
catalytic performance.
Recently, ruthenium oxide has taken great attention as the catalyst material for Li-O2 and Na-O2 batteries applications, especially due to its excellent catalytic
performance for OER. Yilmaz et al. prepared a RuO2 NP coated CNT as a
cata-lyst in Li-O2 batteries [49]. Although by using RuO2 NP the specific capacitance
73%. According to their results, a film like amorphous Li2O2is deposited by using
RuO2 NP during ORR, which its high electrolyte/electrode interface and
non-crystalline nature result in its decomposition at lower over potential during OER compared to crystalline toroidal Li2O2 particles. Micrometer sized RuO2/boron
doped graphene was used as a catalyst in Na-O2 batteries by Wu et al. [60]
It was shown that by using RuO2, the composition and structure of original
discharge product (NaO2) severely changes and an amorphous Na2-xO2 can be
deposited in cathode during ORR. Similarly, the amorphous discharge products can decompose at potentials lower than that of crystalline particles, which is due to the more thermodynamic stability of crystalline phases. Therefore, regarding RuO2 applicability in different systems and its ease of synthesis, as well as its
non-identified behavior in Na-O2 batteries, it has been chosen in this study as
the TMO catalyst for Na-O2 applications.
Shortly, TMOs possess several pros in order to be used for ORR/OER appli-cations in Na-O2 batteries such as their high activity of catalytic ORR/OER
reactions, ease of preparation in different phases and morphologies, their com-patibility with different support materials including carbon materials, low price, stability at high potentials and environmentally friendliness. However, the main disadvantage is their heavy nature and high price (like RuO2), which urges
sci-entists to make composite materials containing TMOs on different substrates. In this regard, both catalytic activity and electrical conductivity can be increased due to the synergistic effect of TMOs and the substrate material. However, new catalyst composites preparation methods are required in order to make them feasible for scaling up and commercial applications.
1.6
Motivation
Various materials have been used as cathode material for Na-O2applications, but
the exact mechanisms underlying catalytic reactions have not been reported yet, especially in the case of NaO2 as the main discharge product. As mentioned in
applications but in those researches, the nature of NaO2 discharge product
un-dergoes a composition evolution by using catalyst, therefore, the catalyst effect on the physical properties of NaO2 and its consequent effect on the cell
electro-chemistry is not realized yet. Due to NaO2 instability in the cell environment
and its dissolution in the electrolyte during storing span, the effect of catalyst on this behavior is also expected to be motivating.
Since the electrochemical and chemical processes underlying Na-O2 batteries are
pretty complicated, especially with NaO2 as the main discharge product, a very
well known catalyst should be chosen to make sure about its ORR/OER activity, in order to minimize the complication of the investigating parameters. RuO2 is
the best candidate in this regard since there are numerous researches about its excellent performance in different media (aqueous and non-aqueous) and systems (fuel cells and metal-O2 batteries). Also, this material can be easily synthesized
in different phases and morphologies. Therefore, it is a suitable catalyst candi-date for this study.
In order to minimize agglomeration effect of prepared RuO2 NP, increase its
elec-trical conductivity and stability, a backbone material is required. Today, CNT is one the most used support material for composite preparation in the catalysis field due to its aforementioned properties. So, it has been chosen as the substrate for RuO2 NP deposition by a microwave assisted hydrothermal method.
In the second part of this thesis, a 3-D structure of bi-functional RuO2/Mn2O3/carbon nanofiber (CNF) catalyst has been synthesized and used as a cathode for Na-O2 batteries. In this part, we tried to eliminate the intrinsic low specific capacity of Na-O2 batteries by incorporating Mn2O3 nanorods deco-rated with RuO2 NPs, as a strategy to increase activity and exposed surface area for ORR/OER. Our results in this part indicate that RuO2/Mn2O3/CNF shows a better battery performance (capacity and overpotntial) compared Several char-acterization techniques including scanning and transmission electron microscopy, Raman spectroscopy, X-ray diffraction, nuclear magnetic resonance, X-ray pho-toelectron spectroscopy and electrochemical investigations are employed in this study to confirm the proposed RuO2 catalytic mechanism in Na-O2 batteries.
Chapter 2
EXPERIMENTAL
2.1
RuO
2/CNT and CNT Cathodes
Prepara-tion
RuO2/CNT composite was prepared through a facile microwave assisted
hy-drothermal synthesis method. 20 mg pristine CNT (>95% purity, diameter 20 nm, Sigma Aldrich) was dispersed in 20 ml DI water by using 30 min bath sonica-tion. Then, 40 mg RuCl3.xH2O (99.9%, Alfa Aesar) was dissolved in the solution
by vigorous stirring for another 30 min. The resulting mixture was transferred to a vessel and microwave assisted hydrothermal reaction was performed at 180◦C for 30 min in microwave synthesis reactor (Anton Paar Monowave 300). After the reaction was performed, resulting powder was washed and centrifuged with DI water and ethanol for at least 5 times and dried in an oven at 60◦C for overnight. Finally, the resulting RuO2/CNT powder was annealed at 150◦C for 1 h in
ambi-ent atmosphere. For cathodes preparation, RuO2/CNT was ground with pristine
CNT with the mass ratio of 6:4 and dispersed in isopropanol by 15 min tip son-ication and 0.3 mg of the powder was deposited on top of the pressed Ni-foam (∼12 mm diameter) for battery measurements. The free standing and binder free film cathodes were prepared by vacuum filtration of the resulting slurries. After
drying at 60◦C, the films were peeled off from the glassy fiber C (GF/C, What-man) and dried under vacuum at 70◦C for overnight prior to use. CNT cathodes and free standing films were also prepared by the same procedures. The diameter and mass of the resulting films were 12 mm and ∼3.6-3.8 mg, respectively.
2.2
Fabrication of CNF
A mixture of PAN (Polyacrylonitrile, MW ∼150,000 g/mol-1, Scientific Polymers) and PMMA (poly(methyl methacrylate, MW ∼350,000 g/mol-1, Sigma Aldrich) solution (10 wt% in DMF (N,N-dimethylformide, ACS reagent, ≥ 99.8%, Sigma Aldrich) PAN:PMMA weight ratio of 95:5) was prepared by mechanically stirring for overnight to obtain homogeneous polymer solution for the electrospinning of nanofibers. Electrospinning of the solutions was carried out at 15 kV and 16 cm distance between the collector and the tip of the syringe. Carbon nanofibers (CNF) were prepared with a two-step heat-treatment of electrospun polymeric nanofibers in a high temperature furnace. The oxidative stabilization was carried out at 280◦C for 2 h with heating rate of 5◦C/min under air atmosphere and the carbonization was done at 800◦C under argon atmosphere for 2 h with a heating rate of 5◦C /min.
2.3
Preparation of Mn
2O
3/CNF, RuO
2/CNF
and RuO
2/Mn
2O
3/CNF
In the first step, Mn2O3/CNF (MC) composites were prepared by a facile
mi-crowave synthesis method. Typically, 20 mg of electrospun CNF (fabrication details in supplementary information) was dispersed in 20 ml DI water by 10 min sonication. Then, different amounts of KMnO4 were mixed with the CNF
dis-persion and stirred in the room temperature for 30 min. The above disdis-persions were added to the vessels and the microwave-assisted hydrothermal reactions were
performed at 180◦C for 30 min in the microwave synthesis reactor (Anton Paar Monowave 300). The amount of KMnO4 was adjusted to 0.25 mmol to result
MC sample. After the reaction was performed, MC sample was washed and cen-trifuged with DI water and ethanol for several times and dried in an oven at 60◦C for overnight. Finally, the sample was annealed for 1 h in 150◦C in the air atmosphere.
For RMC preparation, 20 mg MC was dispersed in 20 ml DI water by 5 min son-ication and 0.025 mmol of RuCl3.xH2O was mixed with the solution by stirring
for 30 min. Then, the resulting mixture was added into the vessels and put in the microwave synthesis reactor at 180◦C for 20 min to result RCM sample. Figure 2.1 shows the schematic illustration of RMC sample preparation sequence. Dur-ing the whole microwave synthesis preparation of MC and RMC, the mixers were stirred at 600 rpm. After the reaction was complete, the product was washed,
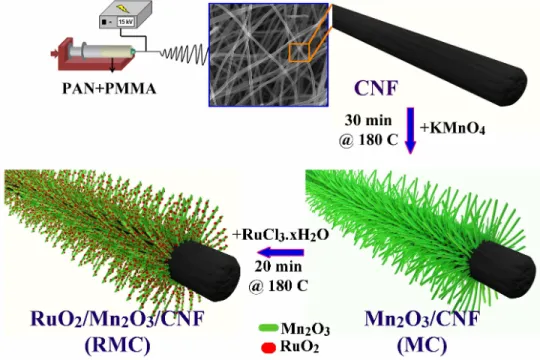
Figure 2.1: Schematic illustration of 3D RMC composite preparation. Electrospun-CNF was used as the backbone for Mn2O3nanorods deposition in the
first hydrothermal step. Then, RMC was prepared during the second hydrother-mal step by using MC as the template for RuO2 nano-particles deposition.
dried and annealed same as MC sample.
For the preparation of RC, the same procedure as RMC was applied, but MC was replaced by CNF as the substrate for RuO2 deposition.
The cathodes were prepared by drop-casting the active materials (20 wt.% C65 containing CNF, MC, RC and RMC) on both sides of Ni-foams (∼12 mm diam-eter). The mass of active materials on cathodes was ∼0.5 mg.
2.4
Na-O
2Cell Assembly
All the procedures during cell assemblies were carried out in an Ar filled glove box (O2 level <0.5 ppm, H2O level <0.5 ppm). The cathodes and Na-O2 cell
components were dried at 70◦C in a vacuum oven for the overnight before cell assemblies. The Na-O2 cells were composed of metallic Na (ACS Reagent, Sigma
Aldrich) covered stainless steel plate as the anode electrode, Celgard 2500 and GF/C as the separator, RuO2/CNT or CNT as the cathode electrodes and 280 µ
of the electrolyte. The electrolyte was prepared with tetraethylene glycol dimethyl ether (>99%, Sigma Aldrich) which contained 0.5 M NaCF3SO3 (NaOTf, 98%,
Sigma Aldrich). The salt was purified according to the procedure reported by McCloskey et al. [22] and the solvent was dried using 3 ˚Amolecular sieves for over 7 days. The water amount of the final electrolyte was <10 ppm according to Karl Fischer titration.
2.5
Electrochemical Characterizations
Electrochemical examinations of the Na-O2 cells were conducted using a battery
cycler (Landt Instruments, CT2001A) after at least 8 h relaxation under Ar atmosphere and 3 h relaxation under 1.5 atm of O2 pressure (40 ml of volume
capacity integrated O2 tank). The specific capacities and current densities were
2.6
Further Characterization Methods
Discharged or charged cathodes were extracted from disassembled Na-O2 cells
inside Ar filled glove box and washed with at least 3 ml acetonitrile (anhydrous, >99.9%, Sigma Aldrich) in order to remove residual electrolyte and dried un-der the vacuum without exposure to air. Morphological and structural charac-terizations were performed by scanning electron microscope (SEM, FEI-Quanta 200 FEG) operating at 5 kV and transmission electron microscope (TEM, FEI Tecnai G2 F30) operating at 100 kV. For the TEM sample preparation, fully discharged cathodes were scratched and resulting powders were applied on lacy carbon coated TEM copper grid. X-ray diffraction (XRD) patterns were col-lected using a Pananalytical instrument (X’pert Pro MPD, Cu-Kα radiation, λ= 1.5405 ˚A). The XRD patterns were collected over the 2θ range of 30◦-50◦ using Kapton tape for isolating the samples from air exposure. High-resolution X-ray photoelectron spectroscopy (XPS, Thermoscientific, K-Alpha, Al K-α radiation) was performed on pristine and cycled cathodes and Raman spectra were collected on a confocal Raman instrument (WITec alpha300) by using an air tight sam-ple holder. 1HNMR spectroscopy was performed using a 400 MHz Bruker NMR system. The samples after discharge or partial/complete charge were immersed in 0.6 ml D2O (Sigma Aldrich) under Ar atmosphere and the resulting solutions
Chapter 3
RESULTS AND DISCUSSION
3.1
RuO
2/CNT Cathode
The RuO2/CNT composite was synthesized through a one pot microwave-assisted
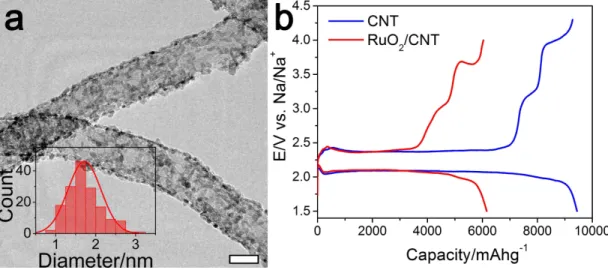
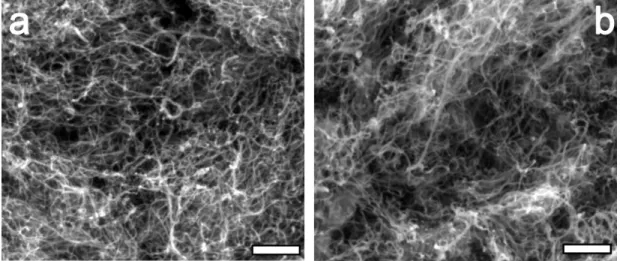
hydrothermal reaction. TEM images of the prepared composite show the uniform distribution of RuO2 NPs with an average diameter of 1.72 nm on CNT surface
(Figure 3.1a). The C1s X-ray photoelectron spectroscopy (XPS) spectrum of RuO2/CNT (Figure 3.2a and b) exhibited one pair of Ru3d doublet for RuO2,
alongside C1s peaks corresponding to CNT. The XPS Ru3d spectrum exhibits
three pairs of Ru3d doublets including RuO2 (∼281.8 eV), RuO2.xH2O (∼282.7
eV) and the satellite feature (∼283.6 eV) along with C1s species arising from CNT. The hydrated form of RuO2 (RuO2.xH2O) seen in this study is due to the
high affinity of RuO2to water which still remains under ultra high vacuum (UHV)
[61, 62]. The O1s spectra further confirms the presence of lattice oxygen (Ru-O
at ∼530.7 eV), hydroxyl group along with satellite feature (∼532.7 eV) and the oxygen containing carbon bonds (∼533.7 eV) [62, 63]. The Raman spectrum of RuO2/CNT consists of the well-known D-, G-, 2D- and D+G-bands of CNT
and two peaks at 520 cm-1 and 631 cm-1 relating to the first order E
g and A1g
phonon bands of rutile RuO2 (Figure 3.2c) [64]. According to XPS and Raman
RuO2/CNT electrodes presented same uniform pore size and distribution with
entangled micron sized CNTs (Figure 3.3).
Figure 3.1: (a) TEM image of RuO2/CNT and RuO2 particle size distribution
over CNTs (scale bar indicates 10 nm). (b) First DC/RC curves of CNT (blue) and RuO2/CNT (red) at a current density of 100 mAg-1 and discharge cutoff
potential of 1.5 V.
Figure 3.2: Characterization of RuO2/CNT by XPS (a) Ru3d, (b) O1s and (c)
Raman spectroscopy. The inset in (c) is the enlarged graph of the shaded spec-trum.
Figure 3.3: SEM images of pristine (a) CNT and (b) RuO2/CNT. Both of the
samples show same pore size and distribution. The scale bars represent 500 nm.
Binder free cathodes (CNT and RuO2/CNT) drop-casted on Ni-foam were
utilized in Na-O2 cells. Galvanostatic discharge/recharge (DC/RC)
measure-ment of the first cycles at 100 mAg-1 current density in Figure 3.1b shows that RuO2/CNT delivered a lower specific capacity (6157 mAhg-1) compared to CNT
(9444 mAhg-1) at the end of DC with the cutoff potential of 1.5 V. The film NaO2
growth on RuO2/CNT during DC and blocking the active surface sites may be the
reason for RuO2/CNT lower capacity (will be discussed in Figure 3.10). During
RC, three distinct regions were observed for both cathodes: i) a plateau around 2.38 V, corresponding to NaO2 decomposition [12], ii) a short slope between 3
and 3.3 V and iii) a plateau above 3.5 V, which regions (ii) and (iii) are cor-responding to the decomposition of side products, mainly Na2O2.2H2O, NaOH,
carbonate and carboxylates [65, 66]. A detailed analysis of identifying the prod-ucts responsible for each plateau is presented in Figures 3.4-3.8. For regions (ii) and (iii), respectively around 0.357 V and 0.336 V charging potential reductions were found in the RC curve of RuO2/CNT compared with CNT, implying that
RuO2 actively contributes to the decomposition of side products during OER. A
more detailed analysis of the effect of RuO2 on DC and RC behavior of Na-O2
region (iii) does not stand for electrolyte decomposition, as no plateau was ob-served under during RC of fresh cells (Figure 3.9) in which the extracted currents are believed to be due to the electrolyte decomposition.
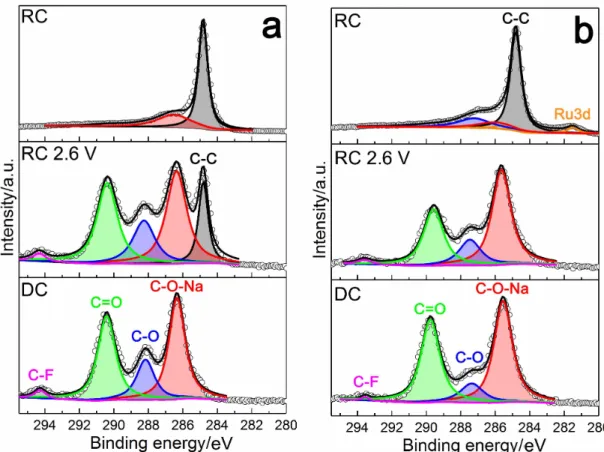
A stepwise DC/RC cycle was performed in order to recognize the nature of prod-ucts in each plateau, as shown in Figure 3.4. The C1s spectra of the DC and RC 2.6 V samples show the coverage of the samples by carboxylate decomposition products (Figure 3.5). The dominance of the peaks at ∼286 and ∼290 eV for these samples is respectively indicative of -C-O-Na (formate, acetate) and C=O (sodium acetate/formate, sodium carbonate) abundance on the samples, as well as C-F group at ∼294 eV corresponding to the anion decomposition products [33, 67]. It is noteworthy that C-C signal at ∼284.8 is not apparent in DC sam-ples and RuO2/CNT RC 2.6 V sample, due to the cathode surface coverage by
the products (Figure 3.7). According to C1s spectra it can be concluded that NaO2 surface is highly active towards the electrolyte decomposition and most of
the degradation products are decomposed after RC. After DC, XPS O1s spectra
of both samples (Figure 3.6) show a strong NaO2 peak at ∼532 eV, together with
a peak at ∼534 eV corresponding to C-O from carboxylate products, as observed in C1s spectra. Once the samples are recharged to 2.6 V, the ratio of C-O:NaO2
increases, indicating NaO2 decomposition during the lowest potential plateau.
After RC, NaO2 completely diminishes, suggesting its complete decomposition
after RC. The peak at ∼537 eV corresponds to the residual oxygen moieties on carbon [67]. According to SEM images of the stepwise samples (Figure 3.7), the surface of both electrodes is getting cleaner by continuing charge, and they recov-ered to the original morphology after complete RC. According to1HNMR results (Figure 3.8),1H chemical shifts (δ) of HDO, tetraglyme, acetate and formate are
observed at 4.78, 3.35-4, 1.92 and 8.46 ppm [49], respectively, compatible with the XPS results.
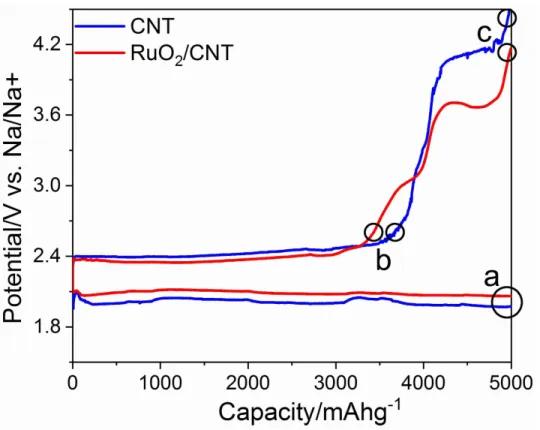
Figure 3.4: The stepwise DC/RC cycling of RuO2/CNT and CNT with a limited
capacity of 5000 mAhg-1 at a current density of 100 mAg-1. After each step (a: DC, b: RC to 2.6 V and c: RC), the cells were disassembled and the cathodes were rinsed with acetonitrile for post mortem characterizations by XPS, SEM and NMR (Figures 3.5-3.8) in order to recognize the identity of products responsible for each plateau.
Figure 3.5: XPS C1s spectra of the stepwise cycled (a) CNT and (b) RuO
2/CNT
Figure 3.6: XPS O1s spectra of the stepwise cycled (a) CNT and (b) RuO2/CNT
Figure 3.7: SEM images of the stepwise cycled (a-c) CNT and (d-f) RuO2/CNT
in Figure 3.4, (a and d) DC, (b and e) RC 2.6 V and (c and f) RC. Scale bars represent 2 µm.
Figure 3.8: 1HNMR spectra of the stepwise cycled (a) CNT and (b) RuO2/CNT
in Figure 3.4. 1H chemical shifts (δ) of HDO, tetraglyme, acetate and formate
are observed at 4.78, 3.35-4, 1.92 and 8.46 ppm [49], respectively, compatible with the XPS results.
Figure 3.9: Galvanostatic charge of fresh CNT and RuO2/CNT cathodes without
pre-discharge. No significant plateau is observed in the charging curves of CNT and RuO2/CNT up to 4.2 and 4 V, respectively, indicating that the plateaus
observed in charging curves of cathodes in Figure 3.1 and Figure 3.13 are not corresponding to electrolyte decomposition.
In the next step, we analyzed the identity, crystallinity and morphology of DC product in CNT and RuO2/CNT cathodes. The appearance of an intense
Raman band at 1156 cm-1in Raman spectra of DC samples, which was absent in
the RC cathodes, confirmed NaO2 deposition as the main product during ORR
and its decomposition during OER (Figure 3.11). The effect of RuO2 catalyst
on the crystallinity of NaO2 discharge product was explored by X-ray diffraction
(XRD) on pristine, DC and RC cathodes (Figure 3.10a). The patterns of DC cathodes consist of mainly two peaks at 2θ= 32.5◦ and 46.6◦ relating to (200) and (220) reflections of NaO2 (ICSD 98-008-7177), respectively, which vanish in
the RC cathodes. However, the crystallinity of NaO2 considerably differed in DC
CNT and DC RuO2/CNT. According to (200) reflection peak area of NaO2, the
relative amount of crystalline NaO2 in DC RuO2/CNT cathode was ∼31% of that
in DC CNT cathode. Estimating the same quantity of total NaO2 in both DC
cathodes (both cathodes were discharged to 1.5 mAh), it turned out that ∼69% of NaO2 is deposited in non-crystalline form by the effect of RuO2 catalyst.
In order to further probe the NaO2 morphology change triggered by RuO2
cat-alyst, DC cathodes were explored by SEM and TEM. The DC CNT cathode contained well defined micron-sized cubic NaO2 (Figure 3.10b and d), compatible
with the observation of Hartmann et al. [12]. Instead, drastic morphological changes were observed in DC RuO2/CNT with the formation of film-like NaO2
without any cubic particles (Figure 3.10c and e). TEM image of DC CNT cath-ode clearly shows bulk NaO2 particle anchoring on CNTs with clean side walls
(Figure 3.10f and 3.12). The crystalline nature of these particles was further ap-proved by the selected area electron diffraction (SAED) pattern (Figure 3.12b), in which all the diffraction d-spacing values can be assigned to NaO2 (ICSD
98-008-7177). This feature was distinguished from NaO2 observed in DC RuO2/CNT,
in which a conformal NaO2 film was observed on cathode without any exposed
bare electrode surface left (Figure 3.10g and 3.12). The high resolution TEM (HRTEM) image (Figure 3.10h) clearly indicates the amorphous nature of the deposited NaO2 film, which was also confirmed by observing no diffraction from
NaO2 in SAED pattern of DC RuO2/CNT (Figure 3.12d). The NaO2 deposited
during DC was completely decomposed after RC and the cathodes preserved their original morphology after the first DC and RC (Figure 3.7c and f).
Figure 3.10: NaO2 crystal and morphology characterization on CNT and
RuO2/CNT. (a) XRD patterns of CNT (blue) and RuO2/CNT (red) at different
states of: as prepared (bottom), first discharged (DC, middle) and first recharged (RC, up), with a limited capacity of 1.5 mAh. The symbol of * denotes NaO2
reflection. (b-e) SEM images of CNT-DC (b and d) and RuO2/CNT-DC (c and
e). Scale bars indicate (b and c) 2 µm and (d and e) 500 nm. (f-h) TEM images of DC (f) CNT and (g and h) RuO/CNT cathodes. Scale bars indicate (f) 50
Figure 3.11: Raman spectra of pristine, DC and RC (a) CNT and (b) RuO2/CNT.
The presence of a sharp signal at 1155 cm-1 in DC spectra which is corresponding
to the O-O stretch bonding of NaO2 and its absence in RC spectra demonstrates
NaO2 deposition as the main discharge product and its decomposition during RC
Figure 3.12: TEM images and electron diffraction patterns of (a, b) DC CNT and (c, d) DC RuO2/CNT cathodes. Scale bars indicate (a) 200 nm, (b) 50 nm,
(c) 20 nm, (d) 10 nm and (inset b and d) 2 nm-1.
To address the differences in electrochemical response of CNT and RuO2/CNT during DC and RC, we carefully assessed the effects of operating parameters on the cells behavior at a limited cut off capacity (1000 mAhg-1). Although the
aver-age DC potential for full capacity measurements (Figure 3.1b) was quite similar for both cathodes (∼2.05 V), RuO2/CNT provided higher DC potential (2.084
![Figure 1.1: Comparison of the energy density of different battery types [8].](https://thumb-eu.123doks.com/thumbv2/9libnet/5841079.119725/18.918.236.723.350.715/figure-comparison-energy-density-different-battery-types.webp)
![Figure 1.3: Working mechanism of a rechargeable Na-O 2 battery [19].](https://thumb-eu.123doks.com/thumbv2/9libnet/5841079.119725/23.918.211.745.166.468/figure-working-mechanism-rechargeable-na-o-battery.webp)
![Figure 1.4: Schematic illustration of solution mediated route (route 1) and surface mediated route (route 2) for NaO 2 deposition during Na-O 2 battery discharge [23].](https://thumb-eu.123doks.com/thumbv2/9libnet/5841079.119725/25.918.294.672.381.727/figure-schematic-illustration-solution-mediated-mediated-deposition-discharge.webp)