Full Terms & Conditions of access and use can be found at
https://www.tandfonline.com/action/journalInformation?journalCode=uesb20
Energy Sources
ISSN: 0090-8312 (Print) 1521-0510 (Online) Journal homepage: https://www.tandfonline.com/loi/ueso19
Comparison of Total Horizontal Solar Radiation
Measurements with Some Existing Models for
Turkey
Mustafa Güneş
To cite this article: Mustafa Güneş (2002) Comparison of Total Horizontal Solar Radiation Measurements with Some Existing Models for Turkey, Energy Sources, 24:8, 735-742, DOI: 10.1080/00908310290086644
To link to this article: https://doi.org/10.1080/00908310290086644
Published online: 10 Nov 2010.
Submit your article to this journal
Article views: 46
View related articles
0090-8312 /02 $12.00 C .00 DOI: 10.1080/0090831029008664 4
Comparison of Total Horizontal Solar
Radiation Measurements with Some
Existing Models for Turkey
MUSTAFA GÜNE ¸S
Department of Mechanical Engineering University of Balikesir
Cagis Campus Balikesir, Turkey
Three models developed for calculating the monthly average daily total horizontal solar radiation anywhere in Turkey have been comparatively studied with monthly averages of the values measured via pyranometer in 11 stations. Comparison study has been done according to the values of mean quadratic error, mean absolute error, and correlation coef cient. In the statistical tests, it has been seen that the most successful model belongs to one developed by Ogelman et al. It has been established that new models could be investigated on a basis of the data collected through 11 stations.
Keywords solar radiation, total horizontal radiation, pyranometer, correlation models, Turkey
Introduction
In Turkey, horizontal solar radiation measurements are conducted by the Turkish State Meteorological Service (DMI), the Scienti c and Technical Research Council of Turkey, the Electrical Works Research Directorate (EIEI), and by some universities’ stations. Some researchers using these measurement values investigated relations in the form of the Angstrom equation for horizontal solar radiation. Kilic and Ozturk (1983) developed correlations of total and direct horizontal solar radiation by making use of measurements conducted via metallic actinographs in DMI stations. Ogelman et al. (1984) tted a curve in quadratic form to the pyranometer measurements of 2 cities possessing diverse geographical and climatological features and maintained that the equations could be valid for Turkey. Aksoy (1997) analyzed the pyranometer measurements made in 5 DMI stations and proposed another correlation in quadratic form for Turkey on a basis of these measurements. Sahin et al. (2001) studied the monthly clearness index values of Turkey. Simple models of solar radiation data for the northwestern part of Turkey have been studied by Sen and Tan (2001). Some other researchers (Tiris et al., 1996; Kaygusuz and
Received 26 July 2001; accepted 17 September 2001.
Address correspondence to Dr. Mustafa Güne¸s, Department of Mechanical Engineering, Uni-versity of Balikesir, Cagis Campus, 10145 Balikesir, Turkey. E-mail: [email protected]
736 M. Güne¸s
Ayhan, 1999; Togrul and Onat, 1999) developed the correlations valid for a single city center in Turkey.
In recent studies (Ertekin and Yaldiz, 1999; Kaygusuz, 1999; Togrul and Onat, 2000), the comparison of estimated and measured values of solar radiation in a single city center has been done. In this study, models developed for calculating the monthly average daily total horizontal solar radiation anywhere in Turkey have been comparatively analyzed with monthly averages of the values gathered through pyranometers in 11 stations located in 9 cities.
Existing Models
Best-known models developed for calculating the monthly average daily total horizontal solar radiation anywhere in Turkey have been given as follows:
Kilic and Ozturk’s model (1983) H
H0 D 0:103 C 0:000017Z C 0:198 cos.Á ¡ ±/ C [0:533 ¡ 0:165 cos.Á ¡ ±/]
s S; (1) Ogelman et al.’s model (1984)
H H0 D 0:195 C 0:676 s S ¡ 0:142 ³s S ´2 ; (2) Aksoy’s model (1997) H H0 D 0:148 C 0:668 s S ¡ 0:079 ³s S ´2 : (3)
In these equations, H is the monthly average daily total radiation, H0 is the monthly
average daily extraterrestrial radiation, s is the monthly average daily hours of bright sunshine, S is the monthly average day length, Z is the altitude, Á is the latitude, and ± is the solar declination.
To determine the H0 and S values, the following equations were used (Duffy and
Beckman, 1974).
The monthly average daily extraterrestrial radiation H0 can be calculated by
H0D 24 ´ 3600 ´ GSC
¼
³
1 C 0:033 cos360n365 ´ ´ ³cos Á cos ± sin !sC
2¼!S
360 sin Á sin ± ´
;
(4)
where Gsc is the solar constant (D 1367 W/m2), n is the day of year starting from the
rst of January, and !S is sunrise hour angle. The declination ± is calculated using
and !S can be found from the following equation:
!S D cos¡1.¡ tan Á tan ±/: (6)
It also follows that the S is given by
SD2!15S: (7)
Measurement Data and Comparison
Stations where horizontal solar radiation data collected via pyranometer will be studied and some other information regarding these stations are given in Table 1. It is seen that both DMI and EIEI stations are in Ankara and Antalya. In DMI stations the time interval of measurements for Ankara is 42 months and for the rest it is 36 months. The measurement data period in EIEI stations for Isparta is 24 months and for Izmir it is 73 months, for Adana, Ankara, Antalya, and Aydin it is 48, 56, 57, and 51 months, respectively. Detailed analysis of the data can be found in the other study (Güne¸s, 2001). In order to compare the measurement values with existing models given in Equations (1)–(3), 3 statistical test values were used: mean quadratic error (MQE), mean absolute error (MAE), and correlation coef cients (R2). They are de ned as follows:
MQEiD ³
S
.H M¡ HC/2 ki ´1=2 ; (8) MAE DS
jHMk¡ HCj; (9) R2 D kS
HMHC¡ .S
HM/.S
HC/ {[kS
HM2 ¡ .S
HM/2][kS
HC2¡ .S
HC/2]}1=2 ; (10) Table 1Some geographical features of the stations
Latitude Longitude Elevation
Name Code (N) (E) (m)
DMI stations Ankara S1 39.6 32.5 890
Antalya S2 36.5 36.5 51
Konya S3 37.6 32.5 1031
Samsun S4 41.2 36.2 4
Urfa S5 37.1 38.8 549
EIEI stations Adana S6 36.6 35.3 20
Ankara S7 39.6 32.5 890
Antalya S8 36.5 36.5 51
Aydin S9 37.9 27.8 56
Isparta S10 37.4 30.5 997
738 M. Güne¸s
(a)
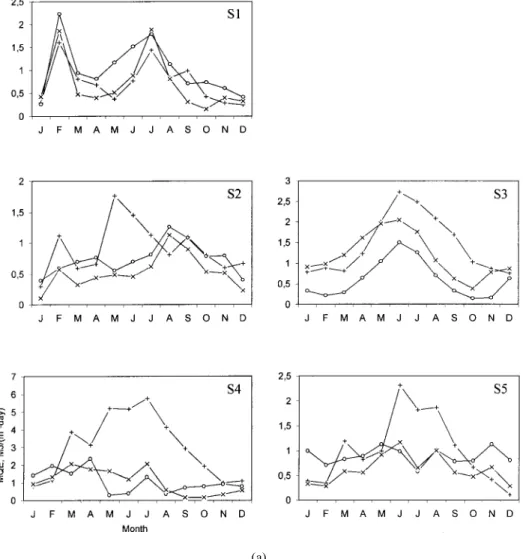
Figure 1. Monthly variation of MQE values of the models: (a) DMI stations (C: Equation (1);
o: Equation (2); x: Equation (3)).
where Hm is the measured value, Hc is the calculated value, and k is the data number.
Subscript i in Equation (8) shows the month.
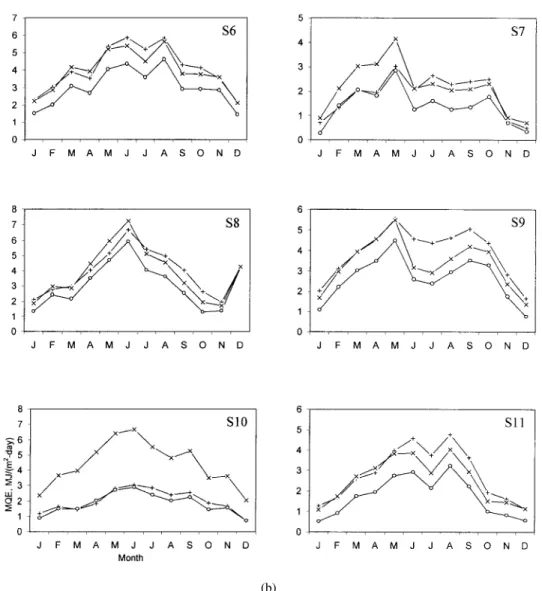
Variation of MQE values according to months in DMI and EIEI stations are shown in Figure 1. It is observed that MQE changing in DMI stations are irregular and changing in EIEI stations are regular. When numerical values of the axis are analyzed, the MQE values of DMI stations apart from Samsun (S4) are lower than those of EIEI stations. In all the stations the curves have maximum values in summer months. The MQE values calculated through Equation (1) in 4 DMI stations are higher than the other 2 equations. The MQE values of Equation (2) in EIEI stations are lower than the other 2 equations.
The MAE values obtained from Equation (9) are shown in Figure 2. In DMI stations the MAE values calculated through Equation (3) and in EIEI stations the MAE values obtained for Equation (2) are smaller. The numerical values of EIEI stations are higher than values of DMI stations.
(b)
Figure 1. Monthly variation of MQE values of the models: (b) EIEI stations (C: Equation (1);
o: Equation (2); x: Equation (3)).
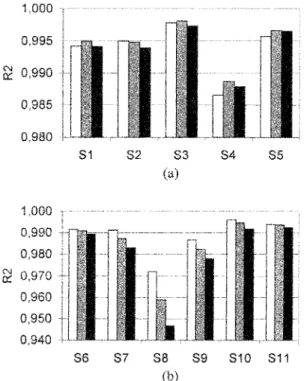
Changing of the R2 values calculated via Equation (10) in DMI and EIEI stations are given in Figure 3. In DMI stations the highest R2 values are observed in Konya (S3) and the lowest R2 values are seen in Samsun (S4). In EIEI stations, on the other hand, in Isparta (S10) the highest and in Antalya (S8) the lowest R2 values are calculated. In DMI stations, the R2 values calculated for Equation (2) and in EIEI stations the R2 values calculated through Equation (1) possess the highest values.
Conclusion
According to the MQE values, the most compatible model with the measurement values of EIEI stations is the model belonging to Ogelman et al. (1984). In 3 of the DMI stations Aksoy’s model and in 2 of the DMI stations Ogelman et al.’s model are better. In respect to the MAE values, Aksoy’s model in DMI stations and Ogelman et al.’s model in EIEI
740 M. Güne¸s
Figure 2. Comparison of the MAE values of the models: (a) DMI stations, (b) EIEI stations
( : Equation (1); Equation (2); : Equation (3)).
Figure 3. Comparison of the R2 values between models and measured values: (a) DMI stations,
stations is more compatible with measured data. The most compatible model with the measurement values regarding the R2 values in DMI stations is Ogelman et al.’s model, and in EIEI stations it is Kilic and Ozturk’s model.
Ogelman et al.’s model appears to be the most successful in all statistical tests. But these researchers derived their model by making use of only 2 cities’ measurement data. In later study, new models could be investigated on a basis of the data collected through 11 stations whose measurement data were analyzed in this study.
Acknowledgement
The author submits his gratitude to Mr. Yusuf Korucu, the Solar Energy Department Director of EIEI, for his help in obtaining the EIEI measurement data.
Nomenclature
Gsc solar constant (D 1367 W/m2)
H monthly average daily total radiation
H0 monthly average daily extraterrestrial radiation
k data number
n day of year starting from the rst of January s monthly average daily hours of bright sunshine S monthly average day length
Z altitude
± solar declination Á latitude
!S sunrise hour angle Subscripts
c calculated value i month of the year m measured value Abbreviations
DMI Turkish State Meteorological Service EIEI Electrical Works Research Directorate MAE mean absolute error
MQE mean quadratic error R2 correlation coef cients
References
Aksoy, B. 1997. Estimated monthly average global radiation for Turkey and its comparison with observations. Renewable Energy 10:625–633.
Duffy, J. A., and W. A. Beckman. 1974. Solar Energy Thermal Processes, chaps. 2–3. New York: John Wiley & Sons, pp. 8–60.
Ertekin, C., and O. Yaldiz. 1999. Comparison of some existing models for estimating global solar radiation for Antalya (Turkey). Energy Convers. Mgmt. 41:311–330.
742 M. Güne¸s
Güne¸s, M. 2001. Analysis of daily total horizontal solar radiation measurements in Turkey. Energy
Sources23:563–570.
Kaygusuz, K. 1999. The comparison of measured and calculated solar radiations in Trabzon, Turkey. Energy Sources 21:347–353.
Kaygusuz, K., and T. Ayhan. 1999. Analysis of solar radiation data for Trabzon, Turkey. Energy
Convers. Mgmt.40:545–556.
Kilic, A., and A. Ozturk. 1983. Solar Energy, chap. 3. ÇIstanbul: Kipas Press (in Turkish). Ogelman, H., A. Ecevit, and E. Tasdemiroglu. 1984. A new method for estimating solar radiation
from bright sunshine data. Solar Energy 33:619–625.
Sahin, A. D., M. Kadioglu, and Z. Sen. 2001. Monthly clearness index values of Turkey by harmonic analysis approach. Energy Convers. Mgmt. 42:933–940.
Sen, Z., and E. Tan. 2001. Simple models of solar radiation data for northwestern part of Turkey.
Energy Convers. Mgmt.42:587–598.
Tiris, M., C. Tiris, and I. E. Ture. 1996. Correlations of monthly-average daily global, diffuse and beam radiations with hours of bright sunshine in Gebze, Turkey. Energy Convers. Mgmt. 37:1417–1421.
Togrul, I. T., and E. Onat. 1999. A study for estimating solar radiation in Elazig using geographical and meteorological data. Energy Convers. Mgmt. 40:1577–1584.
Togrul, I. T., and E. Onat. 2000. A comparison of estimated and measured values of solar radiation in Elazig, Turkey. Renewable Energy 20:243–252.