See discussions, stats, and author profiles for this publication at: https://www.researchgate.net/publication/340344873
Computation of monthly runoff coefficients for Istanbul (Turkey)
Article in Thermal Science · January 2020DOI: 10.2298/TSCI191102147B CITATIONS 5 READS 57 3 authors:
Some of the authors of this publication are also working on these related projects:
Critical point of a sigmoidal curveView project
Exact solutions in General relativityView project Selmin Burak
Istanbul University 37PUBLICATIONS 387CITATIONS
SEE PROFILE
Ayse Bilge Kadir Has University 110PUBLICATIONS 449CITATIONS
SEE PROFILE Duygu Ülker
Instute of Marine Science and Management 11PUBLICATIONS 11CITATIONS
SEE PROFILE
All content following this page was uploaded by Duygu Ülker on 18 August 2020.
1
COMPUTATION OF MONTHLY RUNOFF COEFFICIENTS FOR ISTANBUL (TURKEY)
Selmin BURAK1. Ayşe Hümeyra BİLGE2 . Duygu ÜLKER1
*1Institute of Marine Sciences and Management, Istanbul University, 34134, Vefa, Fatih,
Istanbul, Turkey
2
Faculty of Engineering and Natural Science, Kadir Has University, 34083, Istanbul, Turkey
* Corresponding author; Email: [email protected]
W
ater demand for Istanbul is supplied both by impounded reservoirs located within its provincial boundaries and by water transfer from Western and Eastern regions in peripheral areas, located in South-West Black Sea region.The runoff
coefficient defined as the ratio of the streamflow to the precipitation, plays
a key role in the calculation of the surface water yield of water catchment
areas.
In this paper, we present the computation of monthly runoff coefficients foran accurate estimation of the yield of the catchment areas. We obtain statistical parameters for monthly temperatures and precipitation, based on 105-year data recorded at Istanbul Kandilli Observatory, modeled as Gaussian and Rayleigh distributed random variables, respectively. We run simulations to predict temperatures and precipitation over a horizon extending to 2100. We apply Turc’s formula and Thornthwaite method to obtain monthly runoff coefficients based on long-term data. The results are compared and discussed with the findings of previous researches.
Keywords: Istanbul, precipitation, runoff coefficient, temperature, water catchment areas
1. Introduction
Absence of precipitation over long periods in wet seasons may have environmental and societal impacts with increasing pressure on water resources. Assesment of water inflow to reservoirs is crucial for the planning and management of sustainable water supply schemes for urban water use.
Istanbul Metropolitan Area which has expanded to cover a surface area of 5400 km2 is shelter to 15 million people at present. The city is located at 41.01°N, 28.58°E. The southern parts of provincial Istanbul, where urban areas mostly lie, show the general characteristics of the Mediterranean climate. However, to the northward direction, the Mediterranean type climate is modified by the cooler Black Sea and northerly colder air masses of maritime and continental origins. This weather type is locally called ‘the Black Sea Climate’ and described as having cooler temperatures in both winter and summer, and usually with more rains from mid-Autumn to mid-Spring [1]. The city which has no perennial rivers
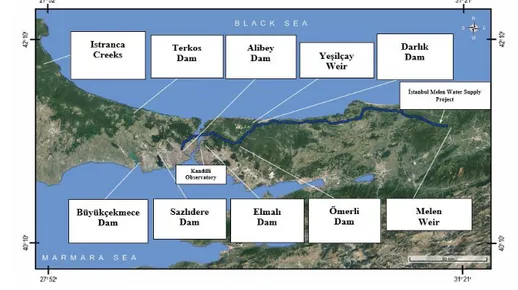
2 relies on stored water in impounded reservoirs as shown in fig. 1. After the 1990s, following a severe drought in Istanbul, water supply systems were re-considered in terms of yield and capacity and water transfer from adjacent basins was planned in order to meet the demand of the growing population [2]. The Istanbul region has experienced a rise of 0.94 °C in average yearly temperature between 1912 and 2016 due to anthropogenic climate change impacts [3]. This rise is slightly higher than the global average temperature increase over the period of 1800-2012 indicated as 0.85 °C in the 5th Assessment
Report by the Intergovernmental Panel on Climate Change (IPCC) [4]. Also, it is likely that this trend related to global warming will further increase during the 21st century under all representative pathways
scenarios [4]
.
In the light of both natural and anthropogenic adverse impacts, (i.e. climate change, urbanization)on the hydrological regime
, the yield of water catchment areas may change, resulting in decrease in water inflow to the reservoirs. For instance,reduction of rainfall in wet seasons with
lower-than-usual rainfall may cause winter drought resulting in decrease in runoff [5].
Loss in
pervious surfaces caused by urbanization reduces infiltration into soils and groundwater [6].
Changes in the features of Istanbul’s precipitation and temperature data were analyzed by a number of scientists [3,7]. Absence of rain over prolonged period especially in wet season may have strong environmental and societal adverse impacts [8]. These adverse impacts are likely to be more severe in heavily urbanized cities with congested population like Istanbul.
Figure 1. Water resources in Istanbul
The objective of the study is to compute monthly runoff, which is crucial for the optimum
management of water works in large cities like Istanbul where water supply is mainly provided
from surface water. Knowledge of monthly runoff is important because yearly averages hide
monthly fluctuations in hydrological processes that are more important for the operational
management of water works. For instance, when winter drought occurs, the reservoirs are very
likely to short fall in meeting the demand of the city. We based our work on 105-year data, the
longest available period of data provided from the national administration, the
KandilliObservatory, located in Istanbul (fig. 1).
The monthly runoff coefficients for Istanbul computed
from 105 years’ past data will provide statistically meaningful estimates for the
future. Nevertheless, it should be noted that increased urbanization is expected to worsen the
relationship between runoff and inflow to reservoirs. Our results should be thought of best-case
scenarios related to precipitation versus runoff under the initial (baseline) conditions of the
catchment areas that are protected by relevant regulations.
3 In the present work, we model the temperature and precipitation as Gaussian and Gamma distributed random variables, respectively, and obtain their parameters. We base our model for monthly precipitation to the records for the period between 1912 and 2016 [9]. The estimation of the monthly runoff coefficients is discussed in Section 2, where runoff coefficients are computed by Turc’s formula [10] and Thornthwaite’s method [11], using long-term temperature and precipitation values and the results are compared with in-situ measurements given by Kadıoğlu and Şen [12]. The overall results and discussion are given in section 3 followed by the conclusion remarks in Section 4.
2. Methodology
2.1. Statistical Models for Monthly Temperature and Precipitation
Daily temperature and precipitation data have been recorded by the Kandilli Observatory, Istanbul, since 1912. The observatory is located at the East shore of the Bosphorus, over a hill, relatively far from urban settlements, hence data collected at this location is representative of the South-East Black Sea region over the whole data collection period. We use the data over the period 1912-2016 obtained from the Kandilli Observatory, as described above.
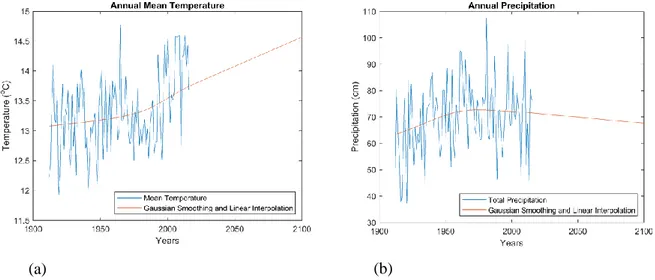
The graphs of annual mean temperature and annual precipitation are given on fig. 2. Gaussian smoothing was applied to the 105 years of temperature and precipitation data, as described by Jones [13] and prediction by linear interpolation up to the year 2100 is implemented (using MATLAB with N=100 parameters). These graphs indicate a clear increase from in annual temperatures by 0.82°C degrees (fig.2(a)) and a slight decrease in precipitation by 4.14 cm (fig.2(b)) between the period 2016 and 2100. These values are in agreement with global trends considering the geographical location of Istanbul under the influence of Mediterranean and Western Black Sea climate [14,15].
Figure 2. Prediction of annual mean temperature (a) and annual precipitation (b) with Gaussian smoothing and linear interpolation for Istanbul
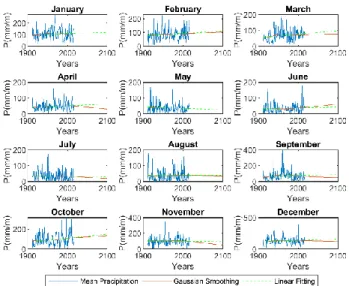
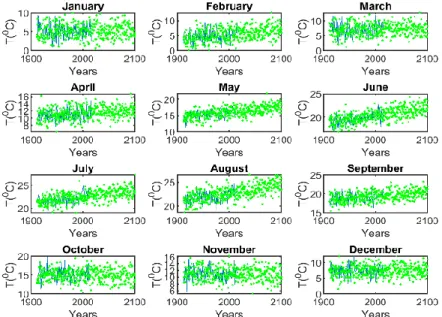
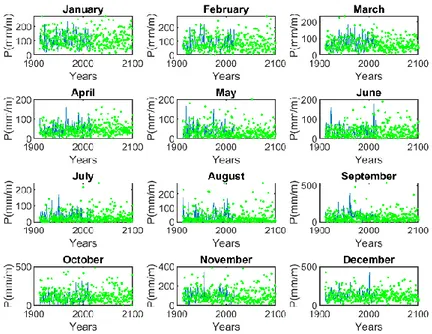
On fig. 3 and fig. 4, we present the graphs of temperature and precipitation for each month, together with linear fitting and Gaussian smoothing and interpolation up to 2100. From fig. 3, we can see that temperatures have a trend of increase in summer months, but no significant change is predicted in winter months, at least within the scope of the models we use. The linear projections for the precipitation, as shown on fig. 4, do not indicate strong trends; nevertheless, we can state that
4 precipitations are likely to increase in winter and spring and stay unchanged or decrease in summer and fall.
Figure 3. Monthly temperature over the period 1912-2016 and projections to 2100 via linear fitting and Gaussian smoothing and interpolation
Figure 4. Monthly precipitation (mm) over the period 1912-2016 and projections to 2100 via linear fitting and Gaussian smoothing and interpolation
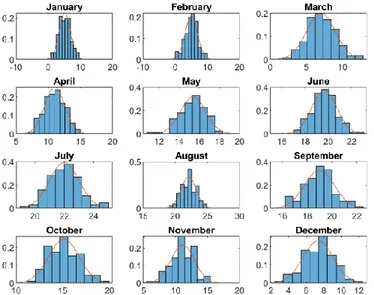
The histograms of daily mean temperatures recorded at Istanbul Kandilli Observatory over the period 1912-2016 are shown on fig. 5, for each month, together with a fitted Gaussian. The Gamma probability distribution is a generally accepted model for monthly precipitation data [16]. We compute the parameters of the best fitting Gamma distribution for each month, using the statistical toolbox of MATLAB and on fig. 6, we present histograms together with the corresponding fitted distribution.
5
Figure 5. Histograms of daily mean temperatures over the period 1912-2016. Horizontal axis units are in degree °C.
Figure 6. Histograms of monthly precipitation in Istanbul, 1912-2016 together with Gamma distribution fit
The Gamma distribution is characterized by its “shape” and “scale” parameters; the parameters of the Gamma distributions fitting to precipitation data for each month are presented in the first 2 columns of tab. 1. The mean and the standard deviation of the temperature distributions are given in the 3rd and 4th columns of the same table. In this table, in the last column, we also present the runoff
6
Table 1. Monthly parameters of the Gamma distribution (as computed with MATLAB)
Months A: Shape Parameter (P) B: Scale Parameter (P) Mean (T) Standard Deviation (T) Runoff coefficient 1 3.7553 27.8695 5.1436 1.7808 0.6325 2 2.9136 29.3994 4.9654 1.9340 0.5821 3 2.9700 23.0044 7.0052 1.9844 0.4636 4 2.7320 17.7674 11.0114 1.5745 0.2576 5 1.3302 27.9445 15.3777 1.2550 0.1530 6 1.1293 31.0962 19.6467 1.0719 0.0969 7 0.6984 45.7084 21.9906 1.0114 0.0732 8 0.5921 61.0171 22.0644 1.1764 0.1204 9 1.1590 58.9881 18.9749 1.2188 0.2715 10 1.8426 50.7605 15.1173 1.6129 0.4090 11 2.6023 38.8352 11.0951 1.8245 0.4980 12 3.8384 33.4749 7.3596 1.7079 0.6500
Based on these statistical models we generate simulations for the temperature and precipitation as shown below on fig. 7 and fig. 8.
7
Figure 8. Simulations for monthly mean precipitation in Istanbul.
From linear regression, Gaussian smoothing and interpolation curves, we have seen that there is no appreciable change in precipitation but there is an increase in temperatures with the exception of the ones for winter months.as given in fig. 7 and fig. 8. For a further evidence of this fact, we present the histograms of temperatures for different decades on fig. 9.
Figure 9. Histograms of monthly temperatures over different decades
2.2. Computation of Runoff Coefficients
The runoff coefficient is defined as the ratio of the surface runoff to the precipitation and it is dimensionless. In this section we present the computation of the runoff coefficient using two different methods. The first one is the Turc’s formula that uses temperature and precipitation information only. The second one is the Thornthwaite method, which is an algorithmic computation based on certain tabulated parameters.
Evaluation of runoff with Turc’s formula [10]: This method is based on the assumption that
the precipitation (P) is the sum of real evapotranspiration (E) and the runoff (R), hence E≤P. The real evapotranspiration E is given by the formula in eq. (1)
8 E = P
√0.9+[𝐿(𝑇)]2P2
, if [𝐿(𝑇)] P2 2> 0.1 and E=P, if [𝐿(𝑇)] P2 2= 0.1 (1) where P is the mean monthly precipitation in mm/month, T is the mean annual temperature in degrees Celsius and 𝐿(𝑇) = 300 + 25𝑇 + 0.05𝑇3. Runoff is defined as the difference between precipitation
and evapotranspiration, R=P-E.
We apply the Turc’s formula to the monthly precipitation data recorded at Kandilli Observatory, for each month, in order to obtain a monthly time series for E, hence for the runoff, over the period 1912-2016. Then, we compute average precipitation and average runoff for each month, to obtain the runoff coefficients for each month, as their ratio. Note that, in summer months, as precipitation is usually low, it can often happen that [P/L(T)]2=0.1, hence E=P, i.e, R=0. But as we take average over a 105-year period, the runoff coefficient turns out to be nonzero even in summer.
Evaluation of runoff with Thornthwaite method as applied by Gudulas et al. [17]: In this
scheme, monthly potential evapotranspiration, PEm, is computed in terms of monthly mean temperature
Tm, by the formula in eq. (2).
𝑃𝐸𝑚 = 16 [ 𝑇𝑚
𝐼 ] 𝑎
(2)
where I = ∑12m=1(𝑇𝑚/5)1,514 and a=0.018 I + 0.49. These monthly potential evapotranspiration values
are multiplied by the latitude correction coefficient λm=(hm/12) (dm/30), where hm is the average sunlight
hours at month m and dm is the number of days in that month. Then, lacking amount of water Um, and
excess water for vegetation Vm, are computed in terms of the precipitation Pm and PE,m by eq. (3).
Um=max{ λm PEm-Pm,0} and Vm=max{ Pm- λm PEm,0}. (3)
The ground water storage due to soil moisture is estimated to be equivalent to Smax=125 mm. The
amount of water lost from ground due to moisture reduction is given in eq. (4). Aw, 𝑚 = {
0 𝑖𝑓 𝑃𝑚 > λ𝑚 𝐸𝑝,𝑚
𝐴𝑤, 𝑚 − 1 + 𝑃𝑚− λ𝑚 𝐸𝑝,𝑚 if 𝑃𝑚 < λ𝑚 𝐸𝑝,𝑚 (4)
The soil moisture is then Sm= Smax - | Aw,m| and real evapotranspiration is found as in eq. (5).
E= λm Ep,m- Uw,m-(Sm-Sm-1) (5)
Finally, the runoff is defined as eq. (6) Rm={
0 𝑖𝑓 𝑉𝑚 = 0
𝑉𝑚− (𝑆𝑚− 𝑆𝑚−1) 𝑖𝑓 𝑉𝑚 > 0 (6)
We present the runoff coefficients computed by Turc’s formula, by the Thornthwaite method and the average of the measured values on fig. 10(b).
The mean of these monthly runoff coefficients for Istanbul is 0.33. We note that the mean runoff coefficient for Turkey has been computed as 0.37 [18–20]. Also, the runoff coefficients for each single catchment basin within Istanbul range from 0.35 to 0.59 [2] and the variability of the runoff coefficients among various basins is explained by the differences in basin feeding, geological formation, size, as well as form of precipitation.
9
3. Results and Discussion
Accuracy of the estimation of the yield of catchment areas is the basis for the design of water structures. Estimating the value of runoff coefficients is a key input in this respect. But the value of these coefficients depends on the features of the catchment areas (e.g. geography, topography, vegetation, land cover) and may change over time due to mainly anthropogenic impacts like urbanization. Therefore, uncertainty related to the runoff coefficient is a major concern in the prediction of the yield of catchment areas that are close to the urbanized areas, in particular. In fact, runoff can be observed and measured directly. Although runoff measurements for various basins in Istanbul area are given in [12], the time span of the available data is not suitable for developing a statistical model. The runoff coefficients calculated from their data are shown on fig. 10(a).
As seen from fig. 10(b), different methods applied to the same data may predict somewhat different runoff coefficients. In addition, the variabilities in precipitation and temperature make it difficult to represent the runoff coefficients by a single graph.
Figure 10. Runoff coefficients based on precipitation and runoff measurements generated from Kadıoğlu and Şen [12] (a) and Runoff coefficients computed by Turc’s formula, by the Thornthwaite method and the average of the measured values given by Kadıoğlu and Şen 2001
[12] (b)
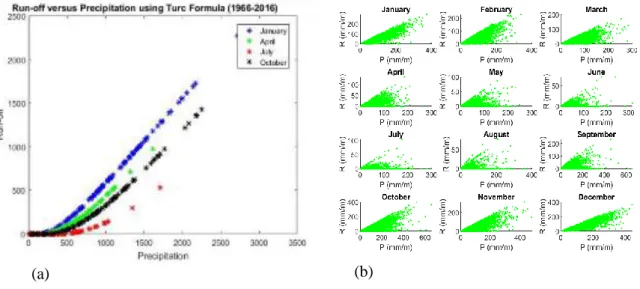
The variability of the runoff coefficients in time is tied to the variability of the precipitation and temperature. In addition to the runoff coefficients computed from time averages temperatures and precipitation, we computed runoff coefficients for each month, with Turc’s formula, using temperature and precipitation data for 1966-2016, which are considered to be more representative of the current temperature and precipitation levels as given in fig.9. Scatter plots of runoff versus precipitation for representative months are shown on fig. 11(a) whilst simulation results for each month are given on fig. 11(b). These graphs indicate that in summer, runoff is practically zero for moderate levels of precipitation while most of the precipitation is converted to runoff in winter.
10
Figure 11. Runoff versus precipitation for Istanbul, in representative months, as computed using Turc’s formula (a) and runoff versus precipitation for simulated values of the precipitation
based on the model (b)
As shown by the graphs in fig. 11(b),
the higher the precipitation, the higher the runoff in
winter. On the one hand, runoff is quantitatively interrelated to various natural factors such as
intensity of rainfall, seasonal distribution and type of rainfall, whether it is orographic,
convective or frontal. On the other hand, anthropogenic activities such as urbanization,
irrigation, inter-basin transfer, aquifer recharge have impact on runoff because these
interventions modify the hydrological regime in catchment areas [21].
The distinguishing feature of our approach for computing runoff coefficients is their replication using long-term past data. In fact, a single application of Turc’s formula or Thornthwaite method gives practically zero inflow in summer when no precipitation occurs, while non-zero runoff in summer is likely to be encountered as seen on fig. 11. Nevertheless, in summer, precipitation is converted to runoff only after a certain threshold, thus the increase of summer droughts is not reflected to decreases in the runoff. On the other hand, winter droughts affect runoff directly; hence, they are more critical for the performance of the water supply system.
The occurrence of precipitation in rainy season, which extends from mid-Autumn to mid-Spring (October to May), is crucial for the Istanbul region because the water supply scheme of the city relies on impounded reservoirs which are filled up during the rainy period. As a consequence, drought in winter months may generate shortages in water supply during the following summer months [22]. Recent studies support the evidence of worsening drought conditions in neighbouring countries, namely in Bulgaria [23], in Romania [24] in addition to the IPCC report where the Mediterranean Basin is identified as a major hot-spot subject to increasing drought occurrences [25].
11
4. Conclusion
This work highlights that: (1) increase in annual temperature by 0.82°C and decrease in precipitation by 41,4mm from 2016 to 2100 are predicted; (2) Monthly runoff coefficients put forward the fact that winter drought affects runoff directly; (3) Estimation of monthly runoff is crucial for the management of water supply system because yearly averages hide monthly fluctuations in hydrological regime.
The results of our study highlight that accurate estimation of monthly runoff can help water managers to predict the yield of water catchment basins and the inflow to the impounded reservoirs. In line with this statement, it must be highlighted that land-use changes (e.g. urbanization, loss of forestry areas) in catchment areas must be strictly avoided for controlling the yield of the catchment areas. This is important for the operation of water supply schemes in case supply has to be supplemented by external and/or alternative resources in the case of Istanbul; since the decision of how to and when to supplement timely the lacking water quantity and at which percentage depends on reliable predictions of water resources. Increased urbanization has adverse impact on the hydrological regime by decreasing the yield of catchment areas. In Istanbul where most of the water supply scheme is based on surface water like impounded and lake reservoirs, the protection of the water catchment areas is of the utmost importance. Although there are relevant regulations for the protection of water catchment areas, enforcement in daily practices is crucial in this respect. These practices must go hand-in-hand with public awareness and administrative support by both local and central administrations in order to prevent uncontrolled urbanization and ill-adapted management issues in catchment areas.
Conflict of interest: No
Acknowledgements
This project is supported by the Istanbul University Scientific Research Projects Coordination Unit with project number BEK-2017-25709.
The authors are grateful to the Boğaziçi University, Kandilli Observatory and Earthquake Research Institute for providing the research data.
Nomenclature
a -cubic function of I Smax - max soil moisture (mm)
Aw,m -amount of water lost from ground T - temperature [Celsius]
dm -number of days in that month (day) Tm - mean temperature [Celsius]
E -real evapotranspiration [mm/month] Um - lacking amount of water
hm -average sunlight hours at month (hr) Vm - excess water for vegetation
I -heat index Greek symbols
PEm -potential evapotranspiration λm - latitude correction coefficient
R -runoff [mm/month]
References
[1] Ezber, Y., et al., Climatic Effects of Urbanization in Istanbul: A Statistical and Modeling Analysis, Int J Climatol., 27(2007), 5, pp. 667–679. doi: 10.1002/joc.1420
[2] Burak, S., et al., A network model simulation proposal for river basin management plans (RBMPs) in Turkey.Proceedings, 10th World Congr. on Water Resources and Environment.
12 “Panta Rhei”, Athens, Greece, 2017, Vol. 57, p. 231-236.
[3] Toros, H., et al., Long-Term Variations of Temperature And Precipitation in The Megacity Of Istanbul for the Development of Adaptation Strategies to Climate Change, Adv Meteorol.,
2017(2017), pp. 1-14. doi: 10.1155/2017/6519856
[4] IPCC, Climate Change 2014: Synthesis Report. Contribution of Working Groups I, II and III to the Fifth Assessment Report of theIntergovernmental Panel on Climate Change, (Core Writing Team, R.K. Pachauri and L.A. Meyer), IPCC, Geneva, Switzerland, 2014.
[5] Trigo R.M., et al., The Record Winter Drought of 2011–12 in the Iberian Peninsula, Bulletin of
the American Meteorological Society, 94(2013),9, pp. 41–45.
[6] Miller J.D., et al., Assessing the Impact of Urbanization on Storm Runoff in A Peri-Urban Catchment Using Historical Change in Impervious Cover, J Hydrol., 515(2014), pp. 59–70. [7] Turoğlu, H., Detection of Changes on Temperature and Precipitation Features in Istanbul
(Turkey), Atmospheric and Climate Sciences, 2014(2014), pp. 549-562.
[8] UNEP/MAP, Mediterranean Strategy for Sustainable Development-MSSD 2016-2025, Valbonne, Plan Bleu, Regional Activity Centre, 2016.
[9] BOUN-KOERI (The Boğaziçi University, Kandilli Observatory and Earthquake Research Institute). Temperature and Precipitation Data, http://www.koeri.boun.edu.tr
[10] Turc, L., Calculation of water balance assessment according to rainfall and temperature, IAHS
Publ, 37 (1954), pp. 188-200 (in French)
[11] Thornthwaite, C.W., et al., Instructions and Tables for Computing Potential Evapotranspiration and Water Balance, 1957.
[12] Kadioglu, M., Şen, Z., Monthly Precipitation-Runoff Polygons and Mean Runoff Coefficients.
Hydrol Sci J, 46(2001),1, 3–11. doi:10.1080/02626660109492796
[13] Jones, P.D., Hulme, M., Calculating Regional Climatic Time Series for Temperature and Precipitation: Methods and Illustrations, Int J Climatol., 16(1996), 361–77. https://doi.org/10.1002/(SICI)1097-0088(199604)16:4<361::AID-JOC53>3.0.CO;2-F.
[14] Turkes, M., Observed and Predicted Climate Change, Drought and Desertification in Turkey,
Journal of Environmental Sciences of Ankara University, 4(2012), 1–32. (in Turkish)
[15] Turkes M., et al., Impacts of Climate Change on Precipitation Climatology and Variability in
Turkey, In Water Resources of Turkey, World Water Resources, (Eds. N. Harmancioglu, D.
Altinbilek D.), Cham, Springer, 2020, pp. 467–491. doi:10.1007/978-3-030-11729-0_14 [16] Svensson, C., et al., Statistical Distributions for Monthly Aggregations of Precipitation and
Streamflow in Drought Indicator Applications. Water Resour Res., 53(2017), pp. 999–1018. doi:10.1002/2016WR019276
[17] Gudulas, K., et al.,Comparison of Different Methods to Estimate Actual Evapotranspiration and Hydrologic Balance. Desalin Water Treat.,51(2013), 2945–54. doi:10.1080/19443994.2012.748443
[18] Küçük, İ., An Evaluation on Hydroelectric Potential of Turkey, Proceedings, UCTEA 1st Energy
Symposium, Turkey, 1996, 12-14. (in Turkish)
[19] Yiğitbaşıoğlu, H., The Dams in Turkey, Journal of Ankara University Research Center of
Turkish Geography, 5 (1996), pp.171-181. (in Turkish)
[20] Bayazıt, M., Hydrology, Rectorate of Istanbul Technical University, Faculty of Civil Engineering, Istanbul, Turkey, 1999.
[21] Jacobson, C.R., Identification and Quantification of the Hydrological Impacts of Imperviousness in Urban Catchments: A review. J Environ Manage., 92(2011), 6, pp. 1438–1448. doi:10.1016/j.jenvman.2011.01.018.
[22] Raymond, F., et al., Extreme Dry Spell Detection and Climatology Over the Mediterranean Basin during the wet season. Geophys Res Lett., 43(2016), 13, 7196–7204. doi:10.1002/2016GL069758.
[23] Koleva, E., Alexandrov, V., Drought in the Bulgarian Low Regions During the 20th Century,
Theor Appl Climatol., 92 (2008), pp. 113–120. doi: 10.1007/s00704-007-0297-1
[24] Croitoru, A.E., et al., Dry Spells on the Romanian Black Sea Coast. Proceedings, Air Water Components Environ. Conf. Cluj, Romania, Vol. 3, 2012.
[25] IPCC., Climate Change 2013: The Physical Science Basis, Contribution of Working Group I to the Fifth Assessment Report of the Intergovernmental Panel on Climate Change, (Eds. T.F. Stocker, D. Qin, G.-K. Plattner, M. Tignor, S.K. Allen, J. Boschung, A. Nauels, Y. Xia, V. Bex and P.M. Midgley) Cambridge University Press, Cambridge, United Kingdom and New York, NY, USA, 2013.
View publication stats View publication stats
![Figure 10. Runoff coefficients based on precipitation and runoff measurements generated from Kadıoğlu and Şen [12] (a) and Runoff coefficients computed by Turc’s formula, by the Thornthwaite method and the average of the measured values given by Kadıoğl](https://thumb-eu.123doks.com/thumbv2/9libnet/4319563.70696/10.892.165.750.492.749/coefficients-precipitation-measurements-generated-kadıoğlu-coefficients-thornthwaite-kadıoğl.webp)