Molten Salt Assisted Self-Assembly: Synthesis of
Mesoporous LiCoO
2
and LiMn
2
O
4
Thin Films and
Investigation of Electrocatalytic Water Oxidation
Performance of Lithium Cobaltate
Gülbahar Saat, Fadime Mert Balci, Elif Pınar Alsaç, Ferdi Karadas,* and Ömer Dag*
G. Saat, Dr. F. M. Balci, E. P. Alsaç, Prof. F. Karadas, Prof. Ö. Dag Department of Chemistry
Bilkent University 06800 Ankara, Turkey
E-mail: [email protected]; [email protected] Prof. F. Karadas, Prof. Ö. Dag
UNAM-National Nanotechnology Research Center and Institute of Materials Science and Nanotechnology
Bilkent University 06800 Ankara, Turkey
The ORCID identification number(s) for the author(s) of this article can be found under https://doi.org/10.1002/smll.201701913.
DOI: 10.1002/smll.201701913
the literature, the synthesis of mesoporous metal oxides and metal lithiates has always been a challenge. Many strategies for syn-thesis, including hard and soft templating methods, have been developed over the years.[6–20] The lyotropic liquid crystalline (LLC) templating method has also been employed to produce metals and metal oxides with the help of a reducing agent or electrochemical methods.[21–25]
Unfortunately, the many existing metal ion precursors are not appropriate for use in soft and hard templating. There are some successful examples of the synthesis of mesoporous metal oxides by using alkoxy precursors.[26–30] However, most metal precursors are common ion salts, such as metal chlorides, nitrates, sulfates, and acetates, that need high temperatures to undergo hydrolysis and condensation reactions to form their oxides. Even if one can incorporate the salts into mesophases, in the next step, in going from salt pre-cursors to oxides, the salt species shrink by 70–90%, which causes a collapse of the meso-order in soft templating processes or a nonuniform coating in the hard-templating cases.[6–20] There are no examples of mesoporous thin films produced through hard-templating and there has been limited success with soft templating methods. In par-ticular, the oxides that contain two or more metals are even more difficult to assemble into mesoporous materials. It is still extremely challenging to form and maintain mesostructures in most metal based materials.
Although, there are some successful examples of mesoporous metal lithiates powders, using hard templating method,[15–20] the method is quite complex and generally impos-sible to produce thin films. Bruce and co-workers reported the first synthesis of mesoporous low temperature spinel LiCoO2
and LiCoO2 nanowires.[31] The synthesis of mesoporous
spinel LiMn2O4 has been reported by Luo et al.[32] Hwang et al. obtained the mesoporous metal lithiates by using soft tem-plating.[33] The resulting material had a 3.8 nm pore size, 31 nm wall thickness, and 13.8 m2 g−1 surface area.[34] Chen et al. used P123, Mn(CH3COO)2.4H2O, and LiOH.H2O as ingredients to produce LiMn2O4 with a pore size of 5.5 nm and a surface area of 42.5 m2 g−1.[35] However materials with a larger surface area,
Mesoporous thin films of transition metal lithiates (TML) belong to an impor-tant group of materials for the advancement of electrochemical systems. This study demonstrates a simple one pot method to synthesize the first exam-ples of mesoporous LiCoO2 and LiMn2O4 thin films. Molten salt assisted
self-assembly can be used to establish an easy route to produce mesoporous TML thin films. The salts (LiNO3 and [Co(H2O)6](NO3)2 or [Mn(H2O)4](NO3)2)
and two surfactants (10-lauryl ether and cethyltrimethylammonium bromide (CTAB) or cethyltrimethylammonium nitrate (CTAN)) form stable liquid crystalline mesophases. The charged surfactant is needed for the assembly of the necessary amount of salt in the hydrophilic domains of the mesophase, which produces stable metal lithiate pore-walls upon calcination.
The films have a large pore size with a high surface area that can be increased up to 82 m2 g−1. The method described can be adopted to synthesize other
metal oxides and metal lithiates. The mesoporous thin films of LiCoO2 show
promising performance as water oxidation catalysts under pH 7 and 14 conditions. The electrodes, prepared using CTAN as the cosurfactant, display the lowest overpotentials in the literature among other LiCoO2
sys-tems, as low as 376 mV at 10 mA cm–2 and 282 mV at 1 mA cm–2.
1. Introduction
Nanostructured, self-assembled metal oxides represent an important group of materials that may advance material demanding technologies, such as catalysis, clean energy gen-eration, and storage.[1–5] Recently, it has been shown that the nanostructured lithium cobaltate (LiCoO2) is a good candidate for use as a water-oxidation catalyst.[4,5] However, in reviewing
thinner pore-walls, and larger pore sizes are in demand for the use of these materials in electrochemical devices.[31–37]
Molten salt-assisted self-assembly (MASA) is an important synthesis process used to fabricate mesoporous transparent thin films of metal oxides.[38–41] The method has been first employed to produce mesoporous CdO and ZnO coated silica, where the CdO and ZnO can be homogeneously coated over silica pore-walls as thin as 1.6 nm.[38] Later, many mesoporous metal titanates (CdTiO3, Zn2TiO4, CoTiO3, MnTiO3, and Li4Ti5O12) have been synthesized using the MASA method.[39–41] In this process, both ethanol (or water in some cases) and the salt spe-cies act as two different solvents to dissolve and to assemble surfactants into the mesophases, respectively. A silica or titania source is added to the media, where their polymerization starts in the solution phase and enhances with coating to form the gel phase. During the process, two surfactants (charged and neutral) are also required to form stable mesophases with high salt concentrations.[38–41] Mesoporous materials prepared, up to now, using the MASA process have always been carried out in the presence of a polymerizing agent (metal alkoxides).[38–41]
Many salts and nonionic surfactants with/without a charged surfactant form stable LLC mesophases.[42–44] Notice that the salt surfactant mesophases are stable phases and do not undergo any solidification process at room temperature and are mostly stable up to their melting points.[42–44] Therefore, it is still a challenge in the current literature to form stable meso-structures of many metal salts that can be converted into a mesoporous material upon calcination without a polymerizing reagent in the media.
Here, for the first time, we applied the MASA process to nonpolymerizing salts to obtain metal lithiate (such as LiCoO2 and LiMn2O4) thin films that may find application for various electrochemical processes.
2. Results and Discussion
2.1. Synthesis and Characterization of Mesoporous LiCoO2 Thin Films
The first step in the synthesis is to prepare a clear homoge-neous solution of the ingredients (salts, surfactants, ethanol or water, acid). One must make sure that all the salts are com-pletely dissolved in the solution; otherwise they crystallize very quickly when coated over a substrate. Coating (spin, dip, or spray coatings) of the clear solutions produces transparent LLC films in a short time. The freshly prepared films diffract at small angles and are birefringent under polarized optical microscopy (POM). Both lithium and metal nitrate salts, sepa-rately and/or together, form stable LLC mesophases. Figure 1 shows a set of small angle X-ray diffraction (XRD) patterns of the LiNO3-[Co(H2O)6](NO3)2-C12E10-cethyltrimethylammonium bromide (CTAB) (C12E10 stands for C12H25(OCH2CH2)10OH, 10-lauryl ether) samples with a different salt content. The sample number (sample #), throughout the text, is the total salts (quantitative among LiNO3 + [Co(H2O)6](NO3)2 with a 1:1 mole ratio) to C12E10 mole ratio. The C12E10/CTAB ratio is one and kept constant in all samples. The diffraction line, observed at around 2.13°, shifts to 1.35°, corresponding to 46 to 72.6 Å
d-spacing, by increasing salt/surfactant ratio from 4.5 to 15, respectively, see Figure 1. The sample-16 also broadly diffracts at around 1.25°, 2θ, but above this ratio, it is completely disor-dered, in that the mixture leaches out salt crystals. The coated samples are birefringent up to 9 salt/C12E10 mole ratio and display focal conic fan texture between the crossed polarizers under POM, see Figure S1 (Supporting Information). There-fore, it is likely that the mesophase is 2D hexagonal up to a mole ratio of 9 and becomes cubic above this ratio.[42–44] Note also that the LiNO3-C12E10 is hexagonal up to a mole ratio of 8 and [Co(H2O)6](NO3)2-C12E10 is up to 3.2 without CTAB. The presence of CTAB and the synergic effects of two salts in the media enhance the hexagonal region up to mole ratios of 9 and the cubic phase to up to mole ratios of 16 in the mesophase in two salts two surfactant systems.[42–44]
The hydrophobic forces among the alkyl tails and hydrogen bonding and ion-dipole network among the hydrophilic domains of the surfactant molecules and salt species hold the micelle units of the mesophase together, up to a 16 salt/sur-factant mole ratio. Also noticed from the solution composition that around 75% of the mesophase composition is salt. This ratio is the highest ever seen in salt-surfactant mesophases and is important for the synthesis of porous materials, since the pore walls will be constructed from these metal species.
To determine whether there were any salt crystals, leached out of the mesophase, the wide angle XRD patterns of the sam-ples were also measured from the aged samsam-ples; see Figure 1b. The wide angle XRD patterns of the aged samples exhibited no diffraction lines, indicating no salt or CTAB crystallization, even after 60 min of aging the films. The mesophases, in all compositions, were stable over the required period and were ready for further heat treatments. It also indicates that the salt species are in the molten state in the hydrophilic domain of the mesophases.[45]
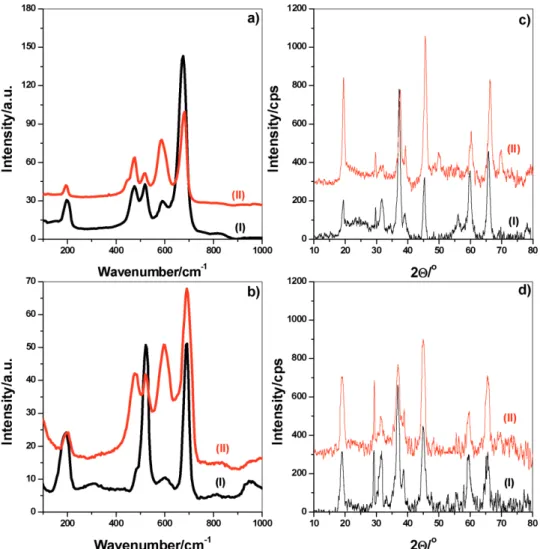
Many parameters, such as the volatile solvent, amount of salt, presence of CTAB or cethyltrimethylammonium nitrate (CTAN), calcination temperature, etc., were systematically investigated using both fresh mesophases and their calcination products. The role of the volatile solvent has been investigated using water and ethanol. The clear solutions of the ingredients were prepared separately in both solvents, with and without CTAB, and spin coated over silicon wafers and glass slides to collect their Raman spectra and XRD patterns upon calcination, respectively, see Figure 2. The calcined samples are denoted as meso-LiCoO2-# (# is again the total salt/C12E10 mole ratio).
The Raman spectra of two sets of calcined samples are shown in Figure 2. Note that LiCoO2 has two common phases, one with a hexagonal symmetry that has two Raman active modes at 486 and 597 cm−1, arising from the Eg and A1g modes, respectively.[46–48] The other LiCoO
2 phase has a spinel struc-ture and exhibits peaks at 483, 525, 621, and 690 cm−1 that correspond to the 2Tg, Eg, and A1g modes, respectively.[46–48] The spinel Co3O4 has also five Raman modes at 194, 488, 522, 618, and 691 cm−1.[46–48] The sample, prepared using the water solution, has distinct Co3O4 peaks at 194 and 691 cm−1 and the sample, prepared using the ethanol solution has relatively stronger peaks of LiCoO2 at 486 and 597 cm−1, Figure 2a,b. The peak at 522 cm−1 is likely due to Si wafer and T
2g mode of Co3O4.
Figure 1. XRD patterns of fresh thin films of LiNO3-[Co(H2O)6](NO3)2-C12E10. a) Small angle and b) wide angle regions upon 60 min aging (top to
bottom, salts/surfactant mole ratio of 4.5, 9, 12, 15, 16, and 17).
Figure 2. Raman spectra of the calcined sample of meso-LiCoO2-9 a) without CTAB and b) with CTAB, prepared in (I) water and (II) ethanol. c,d) XRD
The XRD patterns of the same samples also confirm the Raman data, Figure 2c,d. The XRD pattern predominantly con-sists of diffraction lines of low temperature (LT) LiCoO2 and Co3O4 or partially lithiated Li1−xCoO2. The formation of meso-LiCoO2 is enhanced if the process is initiated in an ethanol solu-tion. Unfortunately, the diffraction patterns of Co3O4 and LiCoO2 are very similar with the most intense line at 45.4° in the LiCoO2 and at 37.3° in the Co3O4 with a distant line at around 29.5°, 2θ. Overall, if one examines the intensity of these two lines, the inten-sity ratio alters going from ethanol to water media. Both Raman spectra and XRD patterns collectively show that the LiCoO2 forms more in the samples obtained using ethanol and therefore eth-anol is a better solvent to synthesize the meso-LiCoO2.
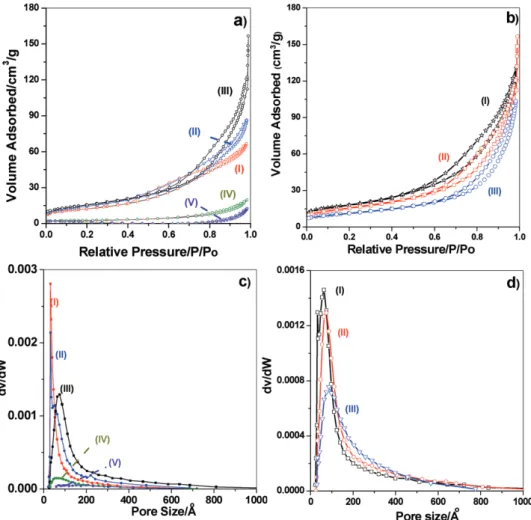
To optimize the salt concentration, another set of samples were prepared using ethanol as the solvent, by changing the amount of salt in the mesophase. The meso-LiCoO2-# (# is 4.5, 6, 9, 12, 15, and 16, respectively) films were prepared by cal-cining the freshly coated films (from the corresponding clear ethanol solutions) at 450 °C to elucidate the role of salt amounts in the mesophase and the calcined final products. The powders, collected by scraping from around 60 glass slides were used to collect the XRD patterns and N2 sorption isotherms. The dif-fraction patterns of the above samples displayed very similar XRD patterns with few differences. The N2 sorption isotherms
display type IV isotherms in all compositions with a hysteresis, indicating the mesoporous nature of the samples, Figure 3. The Barrett–Joyner–Halenda (BJH) pore size distribution plots of the desorption branches displayed a relatively more uni-form pore in the meso-LiCoO2-4.5 to meso-LiCoO2-9 samples; nonuniform and larger pores are observed in the samples with higher salt content, compare pore size plots in Figure 3. The N2 sorption isotherms have also been collected from the meso-LiCoO2-9 samples, prepared with and without CTAB in the mesophase to elucidate the role of CTAB. It is shown that the sample having no CTAB has a nonuniform pore size distribu-tion and a lowest surface area.
Note that a charge surfactant, CTAB, is necessary for the synthesis of stable porous metal oxides with a more uniform pore size distribution and for the assembly of a large amount of salts, however it also causes problems. For instance, the addition of CTAB in the clear solutions of Co(II) changes the color of the solution from dark pink to dark blue. The origin of the blue color is the [CoBr4]2− complex ion in ethanol solu-tion and it prompts the formasolu-tion of the (CTA)2[CoBr4] com-plex salt, which has a low solubility and causes problems during decomposition at higher temperatures. To analyze the effect of Br− ion on the formation of side products, the solu-tions prepared with/without CTAB have been spectroscopically
Figure 3. N2 sorption isotherms a) of meso-LiCoO2-#, # is (I) 4.5, (II) 6, (III) 9, (IV) 12, and (V) 15, and b) of meso-LiCoO2-9, calcined at (I) 300,
examined, see Figure 4. A broad absorption band at 532 nm is observed in both samples, due to the presence of [Co(H2O)6]2+ ion, but in the sample containing CTAB, there are also fin-gerprint absorption bands of tetrahedral [CoBr4]2− ion,[49] the absorption between 550 and 750 nm, indicating the formation of (CTA)2[CoBr4] complex surfactant salt, Figure 4.
To further elucidate the role of Br− ion in the media, cobalt nitrate was partially replaced with CoBr2 (2.5 cobalt nitrate + 2 cobalt bromide) to increase the Br− ion concentration in the media and a set of samples using a 9 salt/surfactant mole ratio was prepared and calcined at 400 °C for 3 h. Figure 5 shows
a set of the XRD pattern of those samples. The patterns were simultaneously collected upon calcination and then after washing the calcined sample with distilled water. It is shown that the addition of CoBr2 enhanced the intensity of sharp lines and some new lines appeared in the patterns, due to impuri-ties in the samples. However, upon washing the samples, the sharp lines disappeared, indicating that some of the side prod-ucts are unreacted salt species, see Figure 5; washing leaves only the insoluble Co3O4 and LiCoO2 signals in the patterns. Note also that the CoBr2 crystals are stable under air even at 700 °C. Therefore, the crystallization and phase separation of the (CTA)2[CoBr4] complex salt that decomposes into CoBr2 and other oxides, CoO and Co3O4 are the origin of the impurities. However, the CTAB free samples also produce Co3O4 nanocrys-tallites. While the source of the impurities is (CTA)2[CoBr4] complex crystals in the presence of CTAB, in the absence of CTAB, it is the cobalt nitrate salt crystal that is leached out from the mesophase at such high salt concentrations. In other words, the charged surfactant is necessary to accommodate salt species in their molten phase in the mesophase at high salt concentra-tions; otherwise the excess salt is leached out from the media as salt crystals to form the bulk oxides at elevated temperatures during the calcination process.
To overcome the negative effect of Br− ion, a new surfactant
(CTAN) has been synthesized by exchanging Br− ion with
NO3− ion as described in the experimental part. Both Fourier transform infrared (FT-IR) spectrum and XRD pattern of CTAN clearly show that the exchange process is quite effec-tive; the absorption peak of NO3− at around 1324 cm−1 is dis-tinctively observed and the XRD patterns of CTAB and CTAN display very similar diffraction patterns with a slight change on the line positions, indicating that they have a similar crystal structure, Figure S2 (Supporting Information).
A set of samples were prepared using CTAN in place of CTAB to identify the side products. Figure 6 displays two POM images, characteristic of a 2D hexagonal phase, from the fresh and calcined film of 6 salt/C12E10 mole ratio, prepared using CTAN, Figure 6a,b. The sample prepared using CTAN shows only the lines from pure LiCoO2, see Figure 6c. The data clearly show that the separation of the salt (as of cobalt nitrate or (CTA)2[CoBr4]) produces the side products. Therefore, the pro-cess requires a charged surfactant which cannot form a com-plex with the salt. These samples were further investigated at higher temperatures by collecting their XRD and N2 sorption isotherms. The results of the isotherms are tabulated, consid-ering all the parameters, in Table 1 for comparison. Clearly the pores get larger by increasing the calcination temperature at the expense of a smaller surface area and pore volume due to crystallization and growth on the pore walls.
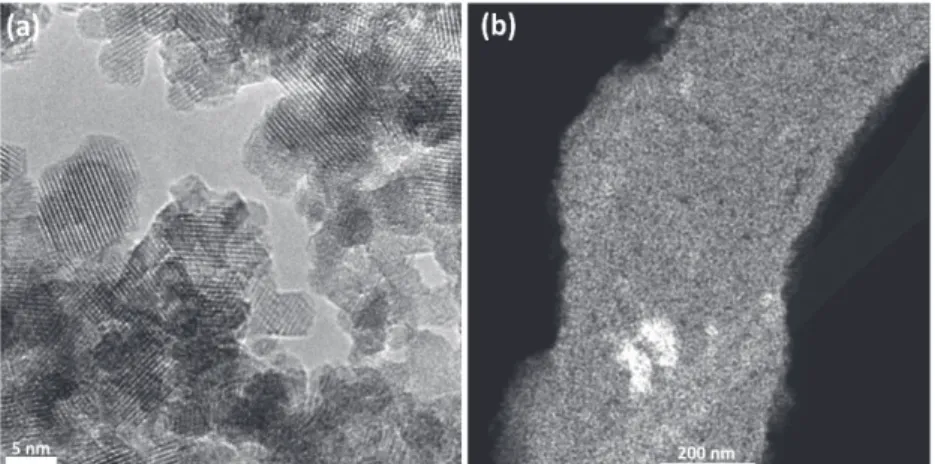
The transmission electron microscope (TEM) and scanning transmission electron microscope (STEM) images of meso-LiCoO2-9 (calcined at 450 °C for 1 h) are shown in Figure 7. The highly crystalline structure of the LiCoO2 is clearly visible in the images. The size of the crystalline domains varies from 3 to 10 nm. The STEM image shows a piece of meso-LiCoO2-9 film with homogeneous mesopores in the film. Further anal-ysis of the HR-TEM image shows that the lattice fringes due to (003) planes of LiCoO2 with a d-spacing of 0.468 nm (con-sistent with the XRD results) are clearly visible throughout the
Figure 4. UV–vis spectra of the fresh samples prepared with/without
CTAB as labeled.
Figure 5. The XRD pattern of the powders, with and without washing, of
(I) [Co(H2O)6](NO3)2 only cobalt source and (II) two cobalt source (CoBr2+
image, see Figure S3 (Supporting Information). Notice also that the LiCoO2 nanocrystallites are mainly oriented along the
c-axis of nanocrystallites, making the pore-walls. However,
fur-ther imaging with higher resolution may require identifying the other planes of the LiCoO2 pore-walls.
2.2. Synthesis and Characterization of Mesoporous LiMn2O4 Thin Films
The same procedure and optimization parameters, used in the LiCoO2, were also employed in the synthesis of mesoporous LiMn2O4 films, denoted as meso-LiMn2O4-# (# is the total salt/ C12E10 mole ratio). The major difference between the Co(II) and Mn(II) systems is the total salt/surfactant mole ratio (2Mn(II) for each Li(I)) and the effect of the acid used in the LiCoO2 system. Like the Co(II) system, the mesophase is ordered and the unit cell expansion is also clearly visible with increasing salt content (up to 12 salt/surfactant mole ratio) in the fresh films, see Figure S4 (Supporting Information). Notice that the transi-tion metal salt concentratransi-tion is the determining para meter for the salt limits in the stable mesophases; the highest transition metal salt, in both systems, are the same (8 Mn(II) in 12 salts in the Mn(II) system and 8 Co(II) in 16 salts in the Co(II) system).
Figure S4a (Supporting Information) shows a set of XRD
patterns and POM images of the fresh samples of LiNO3
-[Mn(H2O)4](NO3)2-C12E10-CTAB samples with four different salt/surfactant mole ratios. The diffraction patterns of the fresh samples up to 12 salts (8 Mn(II) + 4 Li(I))/C12E10 mole ratio dis-play intense diffraction lines at small angles. The POM images of the fresh samples, shown in Figure S4b (Supporting Infor-mation) are also consistent with the XRD data and display fan like texture under POM up to 12 salt/surfactant mole ratio.
The role of the volatile solvent has also been investigated in the Mn(II) system as well, using both ethanol and water. The mixture, prepared using ethanol is a clear yellow solution. However, the mixture prepared using water yields a yellow precipitate with the addition of [Mn(H2O)4](NO3)2 salt to the media which did not dissolve again after 1 week of stirring. The yellow precipitate was also collected and analyzed using XRD, see Figure S5 (Supporting Information). The diffraction pattern clearly shows the yellow product containing charged surfactant and Mn(II) complex ion; it is likely that the (CTA)2[MnBr4] crystallites like its cobalt analog. Because a clear solution was obtained using ethanol, it was used as the solvent for further experimentation.
Different from the Co(II) system, the Mn(II) system needed an acidic media to stabilize the Mn(II) species in the solution and LLC mesophases. The Mn(II) species likely undergoes oxidation that leads to hydrolysis and condensation reactions to form brown powders of manganese oxides/hydroxides spe-cies. The addition of acid halts the side reactions and stabilizes the Mn(II) in the solution and in the mesophase upon coating the clear solution, composed of all ingredients. The films were calcined at various temperatures and durations and analyzed using FT-IR, Raman, XRD, N2 sorption, and TEM techniques.
The calcination process was monitored using FT-IR spec-troscopy, see Figure S6 (Supporting Information). The two
absorption bands, observed at 518 and 617 cm−1 become
clear at around 160 °C; these two peaks have been assigned to cubic nano-LiMn2O4 spinel in the literature.[48,50] However, the peaks of nitrate, water, and surfactants completely disappear at around 300 °C, Figure S7 (Supporting Information). Therefore, the minimum calcination temperature for the synthesis has been determined to be 300 °C for the meso-LiMn2O4 samples, however the formation of LiMn2O4 begins at temperatures Figure 6. The POM images of a) fresh film and b) calcined film of the sample
prepared using CTAN of meso-LiCoO2-6 system and c) the XRD patterns of
meso-LiCoO2-6 prepared using (I) CTAN, (II) CTAB, and (III) no charged
surfactant, and d) Powder Diffraction File (PDF) card (JCPDS 044-0145).
Table 1. N2 sorption data of selected samples (CT = calcination
tem-perature, BET = Brunauer–Emmett–Teller, SA = surface area, PS = pore size, and PV = pore volume).
Samples CT [°C] [mBET SA 2 g−1] BJH PS [nm] [cmPV 3 g−1] Meso-LiCoO2-9 300 60 10 0.24 Meso-LiCoO2-9 450 56 15 0.20 Meso-LiCoO2-9 550 41 16 0.16 Meso-LiCoO2-4.5 450 40 7 0.13 Meso-LiCoO2-6 450 45 8 0.11 Meso-LiCoO2-9*a) 450 65 15 0.22 Meso-LiCoO2-9*b) 350 58 11 0.18 Meso-LiCoO2-9*b) 400 46 13 0.15 Meso-LiCoO2-9*b) 450 34 16 0.12
as low as 160 °C. To set the duration and verify the tempera-ture, the sample of meso-LiMn2O4-9 was calcined 3 times at 300 °C for 1 h durations and the XRD patterns of the sample were recorded after each calcination step, Figure 8a. As it is shown in Figure 8, the XRD patterns of the sample, calcined for 1 and 2 h, there appears a line around 29.2°, which does not belong to LiMn2O4 and which completely disappears after 3 h of calcination.
The effect of Br− ion was also checked in the Mn(II) system, where both CTAN and CTAB have been used as the charged surfactant in the assembly process. While a yellow solution forms in the presence of CTAB, the solutions in the case of CTAN was clear with a very light pink color due to the Mn(II) species, see Figure S6 (Supporting Information). Both solu-tions have been spin coated over a substrate and calcined at 300 °C for 12 h to determine if there are any side products that might form large crystals and become visible in the XRD pat-tern over longer durations. As shown in Figure 8c; there are no differences between the patterns of the samples prepared using CTAB versus CTAN as the charged surfactant; the pro-cess produces mesoporous LiMn2O4 with nanocrystalline pore-walls. The Raman spectra of the samples also confirm the XRD results; compare the spectra and pattern in Figure S8 (Sup-porting Information). The most intense Raman band, located at around 625 cm−1, is attributed to the symmetric stretching vibration of the MnO6 units and there also exists a group of bands between 200 and 500 cm−1 with a weaker intensity.[48] Both samples have similar Raman spectra, indicating that none of the samples produce any side products.
The role of the salt content in the mesophase has also been investigated in the synthesis of mesoporous LiMn2O4. For this purpose, the wide angle XRD patterns, Raman spectra, and N2 sorption isotherms of the samples, prepared using 4.5, 6, 9, 12, and 14 (Li(I) + Mn(II))/C12E10 mole ratios were also recorded, see Figure S9 (Supporting Information). The XRD patterns of the samples, calcined at 300 °C for 3 h, displayed neither visible change in intensities of the diffraction lines nor extra lines due to side products in all compositions, see Figure S9a (Supporting Information). The Raman spectra of the samples also confirm the XRD data. As shown in Figure S8b (Supporting Informa-tion); with increasing salt quantities in the mesophase, the peaks located at 625 cm−1 and the other weaker ones (all belong
to LiMn2O4) slightly broaden around their location, which is attributed to the nanocrys-talline nature of the LiMn2O4 pore-walls and there is no sign of any side products. The N2 sorption data were also collected from the same samples, Figure S9c,d (Supporting Information). The isotherms are type IV and display hysteresis, characteristic for the mesoporous materials. The specific surface area of the samples is also calculated as of 55, 66, 71, and 82 m2 g−1 from the samples obtained from 4.5, 6, 9, and 12 salt ratios, respectively. The pore size distribution of the samples is also shown in Figure S9b (Sup-porting Information). The BJH desorption pore sizes are 7, 9, 11, and 11 nm and the pore volumes of 0.15, 0.16, 0.24, 0.29 cm3 g−1 Figure 7. a) TEM (left) and b) STEM (right) images of meso-LiCoO2-9.
Figure 8. XRD patterns of the powder of a) meso-LiMn2O4-9, calcined at
300 °C for a duration of (I) 1, (II) 2, and (III) 3 h. b) The PDF card (JCPDS 035-0782) of LiMn2O4 and c) meso-LiMn2O4-6, from (I) CTAB and (II)
in the same samples. However, the pore size is more uniform at lower salt compositions.
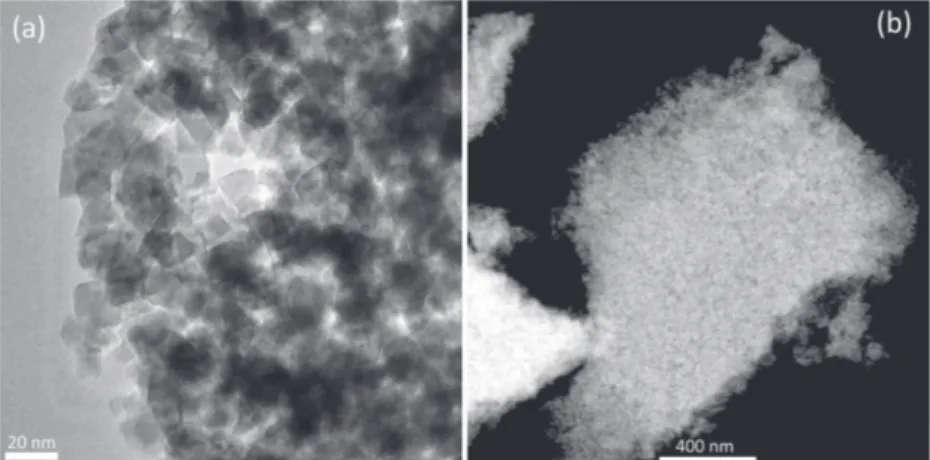
The TEM and STEM images of the mesoporous LiMn2O4
thin films are shown in Figure 9. A sponge like mesoporous LiMn2O4 thin films form with highly crystalline pore walls (10–15 nm), see Figure 9, like the meso-LiCoO2 films.
2.3. Electrocatalysis of Meso-LiCoO2 Thin Films for
Water Oxidation
Meso-LiCoO2-9 samples were further investigated for use in water oxidation. The electrochemical studies were performed on a series of meso-LiCoO2-9@FTO electrodes, which were pre-pared by using CTAN and CTAB as the charge surfactants and at different calcination temperatures to investigate the effect of the charged surfactant and annealing temperature to the electrocata-lytic performance. Cyclic voltammograms (CVs) of all the CTAB and CTAN samples exhibit similar profiles at pH 7 with a quasi-reversible redox process at around 1.6 V vs reference hydrogen electrode (RHE) (assigned to Co3+/4+ redox process), which is
followed by a significant increase in current density due to electrocatalytic water oxidation process (Figure S10, Supporting Informa-tion). A similar trend with an enhanced onset potential (≈1.4 V) was obtained at pH 14 (Figure S10, Supporting Information). The
best performing samples of meso-LiCoO2
from each surfactant, CTAB-450 (denoted as meso-LiCoO2-I) and CTAN-400 (denoted as meso-LiCoO2-II), prepared using CTAB and CTAN as charged surfactants and calcined at indicated temperatures, respectively, have been selected for further investigation. The
cyclic voltammograms of meso-LiCoO2-I
and meso-LiCoO2-II at pH 14 are displayed in Figure 10. The CVs indicate that the meso-LiCoO2-II exhibits an onset potential of ≈1.35 V that is lower than that of meso-LiCoO2-I (≈1.50 V) and both are also lower than the previously reported LiCoO2 elec-trodes, which were prepared using a porous polymer precursor approach (≈1.52 V) and sol–gel procedure (≈1.60 V).[51–53] A CV measurement with LiCoO2, which was prepared with nonionic surfactants, has also been performed at pH 14. A comparison of CVs obtained for meso-LiCoO2-I, meso-LiCoO2-II, and the one derived from nonionic surfactant (denoted as meso-LiCoO2-III) clearly shows the effect of charged surfactant to the electro-chemical properties, see Figure S12 (Supporting Information). The likely reason for a lower onset potential and better catalytic activity for meso-LiCoO2-II could be better purity, higher sur-face area, and full mesoporosity throughout the films.
Meso-LiCoO2-I and meso-LiCoO2-II samples exhibit Tafel slopes of 51 and 49 mV dec−1, respectively, at pH 14, which are characteristic of a catalytic water oxidation mechanism involving a reversible one-electron transfer followed by a chem-ical process. The Tafel slopes increase moving from a high to a low pH, see Figure S13 (Supporting Information). The upper bound turnover frequencies (TOFs) were estimated using the BET surface areas of samples assuming a 100% Faradaic efficiency and that all atoms on the surface are active. The TOFs of meso-LiCoO2-I and meso-LiCoO2-II are calculated to be 44 and 42 s−1 cm−2, respectively, at pH 14 and at j = 10 mA cm−2, which are comparable to those obtained for the cubic Co3O4 nanocrystals[54] (Table 2).
Chronopotentiometric measurements have also been car-ried out under neutral (pH 7) and basic conditions (pH 14) to evaluate their electrocatalytic performances. A 21 h experi-ment was performed at j = 1 mA cm−2 followed by a 2 h one at j = 10 mA cm−2, see Figure 11. The overpotential reaches a
Figure 10. Cyclic voltammograms of meso-LiCoO2-I (red line, upper curve)
and meso-LiCoO2-II (black line, upper curve) at pH 14. Inset: Tafel slopes. Figure 9. a) TEM image and b) STEM image of meso-LiMn2O4.
Table 2. Summary of OER activities.
Meso-LiCoO2-9* TOF
[s−1 cm−2] pH Tafel slope 1 mA cmη for −2 10 mA cmη for −2
CTAB-450a) 44 14 51 340 426
4.6 7 83 468 832
CTAN-400b) 42 14 49 282 376
3.8 7 86 319 544
steady-state after an activation process, which takes around 3 h for both electrodes in the 1 mA cm−2 experiment and reaches an overpotential of 282 and 340 mV at pH 14 for the meso-LiCoO2-II and meso-LiCoO2-I, respectively. At j = 10 mA cm−2, the electrodes maintain a stable overpotential at 376 and 426 mV for meso-LiCoO2-II and meso-LiCoO2-I, respectively, which are slightly lower than those previously reported in the LiCoO2 systems. A similar trend at higher overpotentials was also observed at pH 7, see Figure S14 (Sup-porting Information). The chronopotentiometry experiments performed at different pH media and at different current densi-ties suggest high stability and durability of each catalysts, which may be attributed to the strong attachment of the meso-LiCoO2 films to the electrode surface, due to the novel in situ prepara-tion method. The slightly better performance of the electrodes, prepared using CTAN can be attributed to a slightly higher sur-face area and fewer impurities in the CTAN derivative. Given the nature of the assembly process, it should be noted that there is still room for the optimization of the film quality and surface properties of meso-LiCoO2 films for further improve-ment in the electrocatalytic water oxidation performance.
A chronocoulometry experiment using an O2 probe has
also been performed with meso-LiCoO2-I and meso-LiCoO2-II to investigate the faradaic efficiency. The perfect agreement between the theoretical quantity of O2 obtained from the number of coulombs and the experimental one obtained by O2 probe indicates that the only origin of current density is catalytic water oxidation to O2 evolution process and there are no competing redox reactions, see Figure S15 (Supporting Information).
3. Conclusion
Molten salt assisted self-assembly is an important assembly process that can be used for the synthesis of mesoporous metal lithiates. Both surfactants, nonionic and charged, are neces-sary in the assembly process in which the nonionic surfactants
(oligo(ethylene oxide) type surfactants and pluronics) form the LLC mesophases with many salts and the charged surfactants accommodate and stabilize sufficient salts in the mesophase. Salts and ethanol or water are the nonvolatile and volatile sol-vents, respectively, in the process in which the volatile solvent (ethanol or water) assists in the assembly and thin film forma-tions, where the salts are not only the precursors for the tar-geted oxides but they also stabilize the mesophase for further heat treatments.
Both lithium nitrate and cobalt nitrate and lithium nitrate and manganese nitrate salts form stable LLC mesophases in the presence of as high as 16 and 12 total salts/C12E10 mole rations, respectively, in the presence of 1:1 C12E10:CTAB ratios. The presence of CTAB in the C12E10 system, the Br-ion enforces the formation of (CTA)2[MBr4] (M = Co(II) and Mn(II)) crys-tals that cause the formation of some oxide impurities in the Co(II) system. However, the formation of (CTA)2[MnBr4] does not seem problematic. Moreover, the (CTA)2[MBr4] formation dominates if the process is initiated in an aqueous media. The likely reason is that its solubility in ethanol is much higher therefore ethanol solutions can be used as the volatile solvent in the process.
Calcination of the mesophase produces meso-LiCoO2 with some CoO, Co3O4, and CoBr2 nanocrystallite impurities, which can be minimized when the CTAB is replaced with CTAN. The CTAN hinders the formation of any insoluble charge surfactant complex salt. Calcined films have charac-teristic disordered sponge like pore systems with highly crys-talline pore-walls. The surface area of the LiMn2O4 system is slightly larger than that of LiCoO2. The meso-LiCoO2, coated over fluorine doped tin oxide (FTO), performs well as an elec-trode for water oxidation with the lowest overpotential (as low as 282 and 376 mV at 1 and 10 mA in a pH 14) recorded in the literature among the other LiCoO2 systems. Further optimiza-tion of the synthesis condioptimiza-tions could improve these values and film qualities.
4. Experimental Section
General Method: Two salts (LiNO3.xH2O and [Co(H2O)6](NO3)2
or LiNO3.xH2O and [Mn(H2O)4](NO3)2, two surfactants (an ionic
surfactant CTAB, C16H33N(CH3)3Br, and a nonionic surfactant, C12E10,
C12H25(OCH2CH2)OH), HNO3, and ethanol (or H2O) as a volatile
solvent were mixed in vials and homogenized for 12 h by stirring with a magnetic stirrer, to form clear solutions. The clear solutions were then spin coated over glass substrates to form LLC films. Finally, the LLC films were calcined at temperatures ranging from 300 to 700 °C in air. The amount of salt in the mesophase and final product, amount of acid, and the solvent type were optimized by preparing the clear solutions as described above. The solutions were then spin coated and calcined at the desired temperature to produce the final products.
The Optimization of Salt Amount: Seven homogenized solutions
containing 0.8 mmol C12E10, 0.8 mmol CTAB, 6 g of ethanol with
different amounts of salts were prepared with salts(Li(I) + Co(II)/C12E10
mole ratios of 4.5, 6, 9, 12, 15, 16, and 17. The films were prepared by spin coating above solutions over glass substrates at 1500 rpm for 7 s.
Determination of Solvents (Water vs Ethanol): The general method was
performed using 6 g ethanol or 6 g water as the volatile solvent using 9 salts/surfactant mole ratio. Both sets were prepared (each set consists of 60–80 glass slides) by spin coating on glass substrates at 1500 rpm for 7 s, then calcined at 300 °C for 3 h.
Figure 11. Chronopotentiometry experiment performed on meso-LiCoO2-I
(red line, upper) and meso-LiCoO2-II (black line, lower) electrodes at j =
Preparation of Meso-LiCoO2 with/without CTAB: By employing the
general method, two sets of samples were prepared with a total salt/ surfactant mole ratio of 4.5, 6, and 9 with CTAB/C12E10 mole ratios of
0.0 and 1.0 by spin coating at 1500 rpm for 7 s (six sets of glass slides, each set consists of 60–80 slides). The samples were then calcined at 450 °C for 1 h and collected by scraping the slides. The high angle XRD patterns and N2 sorption isotherms of the powders have been collected.
Preparation of Meso-LiCoO2 Films Using CoBr2 as the Cobalt Source:
Two solutions were prepared using a salt/surfactant mole ratio of 9; one with a 4.5 mole ratio of cobalt nitrate hexahydrate and the other with 2 mole ratio of cobalt bromide and 2.5 mole ratio of cobalt nitrate salts using 0.8 mmol C12E10 and 0.8 mmol CTAB in 6 g of ethanol. Two sets
(each set consists of 60–80 slides) of samples were prepared by spin coating the above solutions on glass substrates at 1500 rpm for 7 s and then calcined at 450 °C for 3 h. The powder samples were collected by scraping the slides.
Synthesis of CTAN (C16H33N(CH3)3NO3): CTAN was synthesized
by following a method described in the literature.[55] Briefly, AgNO 3
methanol–water (1:1 ratio) solution was prepared in dark by using 9.157 g AgNO3, 100 g methanol and 100 g distilled water. A solution of
CTAB, prepared by dissolving 20 g of CTAB in 100 g of methanol was added slowly to the above mixture by stirring in dark and stored in the dark for 10 d at low temperature (+4 °C). The solution was filtered with a Millipore TM system with a pore diameter of 1 µm to remove the AgBr particles. The methanol and water were then evaporated using a rotating evaporator and a vacuum oven. The resulting product was dissolved in methanol and recrystallized two times.
Preparation of Meso-LiCoO2 Thin Films Using CTAN: A homogenized
solution, containing 3.6 mmol LiNO3.xH2O, 3.6 mmol [Co(H2O)6]
(NO3)2, 0.8 mmol C12E10, and 0.8 mmol CTAN, and 6 g of ethanol, was
prepared using the general method. A set of slides (around 80 slides) were then coated at 1500 rpm for 7 s and finally calcined at 450 °C for 10 h in air. The powder samples were obtained by scraping the slides for use in XRD and N2 sorption measurements.
Preparation of LiMn2O4: The above parameters and procedures were
used to prepare the solution, LLC thin films, and mesoporous LiMn2O4
thin films.
TEM Analysis: A homogenized solution of the required sample was
spin coated over a glass substrate at 6000 rpm for 10 s to obtain a very thin film. The film was then calcined at the optimal temperature and duration, scraped from the substrate and ground in a mortar for 10 min to obtain smaller particles. The sample was then placed in a solution of ethanol and sonicated for 2 h to disperse the particles. The dispersed mixture was dropped on a carbon coated Cu grid with 300 mesh under a UV lamp. The dried grid was placed into TEM of JEOL JEM 2100 F operating at a voltage of 200 kV for imaging.
XRD Measurements: Thin film and powder XRD patterns were
recorded by using a Rigaku Miniflex diffractometer, equipped with a Miniflex goniometer and an X-ray source with Cu Kα radiation (λ = 1.5405 Å) operated at 30 kV and 15 mA. XRD patterns of the thin films were collected between 1° and 4° with a scan rate of 0.5° min−1.
The powder samples were packed into standard glass sample holders and the patterns were collected between 10° and 80°, 2θ, values with a scan rate of 0.5° min−1. The diffraction patterns were indexed using the
Joint Committee on Powder Diffraction Standards (JCPDS) cards.
N2 (77.4 K) Sorption Measurements: Prior to measuring, the samples
were dehydrated at 573 K for 2 h in vacuum. The N2 sorption isotherms
were measured using a TriStar 3000 automated gas adsorption analyzer (micrometrics) over a relative pressure range, P/P0, from 0.01 to 0.99.
The saturated pressure was measured over 120 min intervals. The surface areas of the different samples measured were calculated in the range of 0.05–0.30 relative pressure with 5 points.
POM Images: The POM images were recorded by using ZEISS Axio
Scope.A1 polarizing optical microscope in transmittance mode from films, coated over glass slides.
FT-IR Measurements: The FT-IR spectra were recorded using a Bruker
Tensor 27 model FT-IR spectrometer. A Digi Tect TM DLATGS detector was used with a resolution of 4.0 cm−1 from 400 to 4000 cm−1 range. The
data obtained after 256 scans were recorded using films, coated over IR transparent silicon wafers.
Micro-Raman Measurements: LabRam confocal Raman microscope
with a 300 mm focal length was used for the measurements. The device has a Ventus LP 532, 50 mW, diode pumped solid-state laser operator at 20–34 mW with a polarization ratio of 100:1, a wavelength of 532.1 nm, and a 1024 × 256 element CCD camera. The signal collected was transmitted via a fiber optic cable into the spectrometer with 600 g mm−1 grating. The Raman spectra of the samples were recorded
by placing the probe tip on the desired point of the sample over the glass or silicon wafer.
Electrochemical Studies: A conventional three-electrode
electrochemical cell was used with an Ag/AgCl electrode (3.5 m KCl)
as the reference electrode, Pt wire as counter electrode, and catalyst modified FTO substrate as the working electrode. The neutral buffer solutions were prepared using K2HPO4 and KH2PO4 (KPi) and then
adjusted by adding H3PO4 or 1 m KOH. A 1 m KOH solution was used
for alkaline conditions (pH 14). CV were recorded with a scan rate of 100 mV s−1 in 50 × 10−3m KPi (pH 7) containing 1 m KNO3 as electrolyte
between 0 and 1.5 V (vs Ag/AgCl) and all potentials displayed in the manuscript are iR-corrected. All experiments were carried out under nitrogen atmosphere. pH of the solution was measured by Mettler Toledo pH meter (S220). YSI 5100 dissolved oxygen sensing electrode instrument equipped with a dissolved oxygen field probe was used to determine the oxygen evolution.
Supporting Information
Supporting Information is available from the Wiley Online Library or from the author.
Acknowledgements
The authors thank the Scientific and Technological Research Council of Turkey (TÜBI˙TAK) under project number 113Z730 for financial support. Ö.D. is a member of Science Academy, Istanbul.
Conflict of Interest
The authors declare no conflict of interest.
Keywords
electrocatalysis, mesoporous thin films, metal lithiates, molten salt assisted self-assembly, water oxidation
Received: June 7, 2017 Revised: August 26, 2017 Published online: November 17, 2017
[1] N. Linares, A. M. Silvestre-Albero, E. Serrano, J. Silvestre-Albero, J. G. Garcia-Martinez, Chem. Soc. Rev. 2014, 43, 7681.
[2] M. S. Park, J. Kim, K. J. Kim, J. W. Lee, J. H. Kim, Y. Yamauchi, Phys.
Chem. Chem. Phys. 2015, 17, 30963.
[3] G. Wang, H. Liu, J. Horvat, B. Wang, S. Qiao, J. Park, H. Ahn, Chem.
Eur. J. 2010, 16, 11020.
[4] G. Gardner, J. Al-Sharab, N. Danilovic, Y. B. Go, K. Ayers, M. Greenblatt, G. C. Dismukes, Energy Environ. Sci. 2016, 9, 184. [5] J. Wang, L. Li, H. Tian, Y. Zhang, X. Che, G. Li, ACS Appl. Mater.
[6] P. Yang, D. Zhao, D. I. Margolese, B. F. Chmelka, G. D. Stucky,
Chem. Mater. 1999, 11, 2813.
[7] G. J. A. A. Soler-Illia, C. Sanchez, B. Lebeau, J. Patarin, Chem. Rev.
2002, 102, 4093.
[8] D. Grosso, G. J. A. A. Soler-Illia, E. L. Crepaldi, B. Charleux, C. Sanchez, Adv. Funct. Mater. 2003, 13, 37.
[9] D. Grosso, C. Boissière, B. Smarsly, T. Brezesinski, N. Pinna, P. A. Albouy, H. Amenitsch, M. Antonietti, C. Sanchez, Nat. Mater.
2004, 3, 787.
[10] Y. Ren, Z. Ma, P. G. Bruce, Chem. Soc. Rev. 2012, 41, 4909. [11] G. J. A. A. Soler-Illia, O. Azzaroni, Chem. Soc. Rev. 2011, 40, 1107. [12] N. D. Petkovich, A. Stein, R. A. Caruso, Chem. Soc. Rev. 2013, 42,
3721.
[13] F. Jiao, J. C. Jumas, M. Womes, A. V. Chadwick, A. Harrison, P. G. Bruce, J. Am. Chem. Soc. 2006, 128, 12905.
[14] K. Zhu, B. Yue, W. Zhou, H. He, Chem. Commun. 2003, 98. [15] B. Yue, H. Tang, Z. Kong, K. Zhu, C. Dickinson, W. Zhou, H. He,
Chem. Phys. Lett. 2005, 407, 83.
[16] A. Rumplecker, F. Kleitz, E. L. Salabas, F. Schüth, Chem. Mater.
2007, 19, 485.
[17] F. Jiao, A. Harrison, A. H. Hill, P. G. Bruce, Adv. Mater. 2007, 19, 4063.
[18] H. Tüysüz, Y. Liu, C. Weidenthaler, F. Schüth, J. Am. Chem. Soc.
2008, 130, 14108.
[19] F. Jiao, A. Harrison, J. C. Jumas, A. W. Chadwick, W. K. Kockelmann, P. G. Bruce, J. Am. Chem. Soc. 2006, 128, 5468.
[20] H. J. Shin, R. Ryoo, Z. Liu, O. Terasaki, J. Am. Chem. Soc. 2001, 123, 1246.
[21] Y. Yamauchi, K. Kuroda, Chem. Asian J. 2008, 3, 664.
[22] C. Li, Ö. Dag, T. D. Dao, T. Nagao, Y. Sakarmoto, T. Kimura, O. Terasaki, Y. Yamauchi, Nat. Commun. 2015, 6, 6608.
[23] C. Li, B. Jiang, Z. Wang, Y. Li, M. S. A. Hossain, J. H. Kim, T. Takei, J. Henzie, Ö. Dag, Y. Bando, Y. Yamauchi, Angew. Chem., Int. Ed.
2016, 55, 12746.
[24] Y. Li, C. Li, B. P. Bastakoti, J. Tang, B. Jiang, J. Kim, M. Shababuddin, Y. Bando, J. H. Kim, Y. Yamauchi, J. Mater. Chem. A 2016, 4, 9169. [25] D. M. Antonelli, J. Y. Ying, Angew. Chem., Int. Ed. 1995, 34, 2014. [26] P. Yang, D. Zhao, D. I. Margolese, F. Bradley, B. F. Chemalka,
G. D. Stucky, Nature 1998, 396, 152.
[27] P. Yang, D. Zhao, D. I. Margolese, F. Bradley, B. F. Chemalka, G. D. Stucky, Chem. Mater. 1999, 11, 2813.
[28] F. Schüth, Chem. Mater. 2001, 13, 3184.
[29] S. Y. Choi, M. Mamak, N. Coombs, N. Chopra, G. A. Ozin, Adv.
Funct. Mater. 2004, 14, 335.
[30] S. W. Boettcher, J. Fan, C. K. Tsung, Q. Shi, G. D. Stucky, Acc. Chem.
Res. 2007, 40, 784.
[31] F. Jiao, K. M. Shaju, P. G. Bruce, Angew. Chem., Int. Ed. 2005, 44, 6550.
[32] L. Luo, Y. Wang, H. Xiong, Y. Xia, Chem. Mater. 2007, 19, 4791. [33] F. Jiao, J. Bao, A. H. Hill, P. G. Bruce, Angew. Chem., Int. Ed. 2008,
47, 9711.
[34] B. M. Hwang, S. J. Kim, Y. W. Lee, B. Han, S. B. Kim, W. S. Kim, K. W. Park, Int. J. Electrochem. Sci. 2013, 8, 9449.
[35] S. Chen, Z. Chen, C. Cao, Electrochim. Acta 2016, 199, 51.
[36] Y. Ren, A. R. Armstrong, F. Jiao, P. G. Bruce, J. Am. Chem. Soc.
2010, 132, 996.
[37] H. Liu, G. Wang, J. Liu, S. Qiao, A. Ahn, J. Mater. Chem. 2011, 21, 3046.
[38] C. Karakaya, Y. Türker, C. Albayrak, Ö. Dag, Chem. Mater. 2011, 23, 3062.
[39] C. Karakaya, Y. Türker, Ö. Dag, Adv. Funct. Mater. 2013, 23, 4002. [40] C. Avcı, A. Aydın, Z. Tuna, Z. Yavuz, Y. Yamauchi, N. Suzuki, Ö. Dag,
Chem. Mater. 2014, 26, 6050.
[41] F. M. Balcı, O. U. Kudu, E. Yılmaz, Ö. Dag, Chem. Eur. J. 2016, 22, 18873.
[42] Ö. Çelik, Ö. Dag, Angew. Chem., Int. Ed. 2001, 40, 3800. [43] C. Albayrak, A. M. Soylu, Ö. Dag, Langmuir 2008, 24, 10592. [44] C. Albayrak, A. Cihaner, Ö. Dag, Chem. Eur. J. 2012, 18, 4190. [45] C. Albayrak, N. Özkan, Ö. Dag, Langmuir 2011, 27, 870. [46] W. Huang, R. Frech, Solid State Ion. 1996, 86–88, 395.
[47] H. Porthault, R. B. Hadjean, F. Le Cras, C. Bourbon, S. Franger, Vib.
Spectrosc. 2012, 62, 152.
[48] R. B. Hadjean, J. P. Pereira-Ramos, Chem. Rev. 2010, 110, 1278. [49] D. A. Fine, J. Am. Chem. Soc. 1962, 84, 1139.
[50] S. J. Hwang, D. H. Park, J. H. Choy, G. Campet, J. Phys. Chem. B
2004, 108, 12713.
[51] G. Gardner, J. Al-Sharab, N. Danilovic, Y. B. Go, K. Ayers, M. Greenblatta, G. C. Dismukes, Energy Environ. Sci. 2016, 9, 184.
[52] Z. Lu, H. Wang, D. Kong, K. Yan, P.-C. Hsu, G. Zheng, H. Yao, Z. Liang, X. Sun, Y. Cui, Nat. Commun. 2014, 5, 4345.
[53] Z. Lu, G. Chen, Y. Li, H. Wang, J. Xie, L. Liao, C. Liu, Y. Liu, T. Wu, Y. Li, A. C. Luntz, M. Bajdich, Y. Cui, J. Am. Chem. Soc. 2017, 139, 6270.
[54] A. J. Esswein, M. J. McMurdo, P. N. Ross, A. T. Bell, T. D. Tilley,
J. Phys. Chem. C 2009, 113, 15068.
[55] M. L. T. Liveri, R. Lombardo, C. Sbriziolo, G. Viscardi, P. Quagliotto,
 2 only cobalt source and (II) two cobalt source (CoBr 2 + [Co(H 2 O) 6 ](NO 3 ) 2 ).](https://thumb-eu.123doks.com/thumbv2/9libnet/5885846.121613/5.892.103.409.105.409/figure-pattern-powders-washing-cobalt-source-cobalt-source.webp)
 2 -C 12 E 10 -CTAB samples with four different salt/surfactant mole ratios](https://thumb-eu.123doks.com/thumbv2/9libnet/5885846.121613/6.892.78.432.106.581/figure-supporting-information-patterns-samples-samples-different-surfactant.webp)