This article was downloaded by: [Bilkent University] On: 19 January 2015, At: 07:05
Publisher: Routledge
Informa Ltd Registered in England and Wales Registered Number: 1072954 Registered office: Mortimer House, 37-41 Mortimer Street, London W1T 3JH, UK
Journal of Global Information
Technology Management
Publication details, including instructions for authors and subscription information:
http://www.tandfonline.com/loi/ugit20
Exploring Break-points and
Interaction Effects Among Predictors
of the International Digital Divide
Joel I. Deichmanna, Abdolreza Eshghia, Dominique Haughtona, Michele Masnghettib, Selin Sayekc & Heikki Topiaa
Bentley College, Waltham, MA, USA . b
Epslilon Inc., Wakefield, MA, USA. . c
Bilken University, Ankara, Turkey . Published online: 09 Sep 2014.
To cite this article: Joel I. Deichmann, Abdolreza Eshghi, Dominique Haughton, Michele Masnghetti, Selin Sayek & Heikki Topi (2006) Exploring Break-points and Interaction Effects Among Predictors of the International Digital Divide, Journal of Global Information Technology Management, 9:4, 47-71, DOI: 10.1080/1097198X.2006.10856432
To link to this article: http://dx.doi.org/10.1080/1097198X.2006.10856432
PLEASE SCROLL DOWN FOR ARTICLE
Taylor & Francis makes every effort to ensure the accuracy of all the information (the “Content”) contained in the publications on our platform. However, Taylor & Francis, our agents, and our licensors make no representations or warranties whatsoever as to the accuracy, completeness, or suitability for any purpose of the Content. Any opinions and views expressed in this publication are the opinions and views of the authors, and are not the views of or endorsed by Taylor & Francis. The accuracy of the Content should not be relied upon and should be independently verified with primary sources of information. Taylor and Francis shall not be liable for any losses, actions, claims, proceedings, demands, costs, expenses, damages, and other liabilities whatsoever or howsoever caused arising directly or indirectly in connection with, in relation to or arising out of the use of the Content.
This article may be used for research, teaching, and private study purposes. Any substantial or systematic reproduction, redistribution, reselling, loan, sub-licensing, systematic supply, or distribution in any form to anyone is expressly forbidden. Terms
terms-and-conditions
Predictors of International Digital Divide
Exploring Break-points and Interaction Effects Among
Predictors of the International Digital Divide
Joel
I.
Deichmann, Bentley College, Waltham, MA, USA [email protected]Abdolreza Eshghi, Bentley College, Waltharn, MA, USA [email protected]
Dominique Haughton, Bentley College, Waltham, MA USA [email protected]
Michele Masnghetti, Epslilon Inc., Wakefield,
MA,
USA.[email protected]
Selin Sayek, Bilken University, Ankara, Turkey. [email protected]
Heikki Topi, Bentley College, Waltham, MA, USA [email protected]
ABSTRACT
The deepening of the digital divide between countries has prompted international organizations and governments to work together toward reducing the problem over the next 15 years. However, such efforts will likely succeed only
if
they are based on afirm
grasp of the divide's underlying causes. In this paper we report the results of a comprehensive analysis of the determinants of the international digital divide. Our results confirm many findings of past research, but also extend existing knowledge in important ways. By employing Multivariate Adaptive Regression Splines (MARS), we discover non-linearities and interaction effects among the predictors. We then articulate significant policy implications based upon these findings.KEYWORDS
International Digital Divide, Global IT, ICT, MARS
INTRODUCTION
At the UN Millennium Summit, among several other goals, the authorities pledged to reduce the international digital divide by 2020. This pledge came at a time when the digital divide across countries, following several years of widening, had reached a new extreme. The digital divide, both at the international and the national levels, has three dimensions: one dimension that reflects the basic access to and use of technology, another that reflects the factors that affect the use of technology, and a third that reflects the advanced application of technology. As articulated by the non- profit organization bridges.org, these dimensions are reflected in alternate measurements of the digital divide, including a) those quantifying the number of people with access to the technology - which in this case is measured as the use of the
Internet, phones, or computers; b) those quantifying the quality of the technology -
such as the Internet bandwidth
,
the human capital available in the economy to allow for technical training and use of Information and Communication Technologies (ICT); c) those reflecting the intensity of usage of the technology - such as the extent of e- commerce and industrial information technology available in the economy; and finally d) those reflecting the market for technology - such as the pricing of ICTs. In this paper, we undertake a comprehensive analysis of the determinants of the international digital divide (IDD). We define IDD broadly as the gap between countries in their level of utilization of information and communication technologies (ICTs).Studying the digital divide is important for two complementary reasons. First and foremost, there is a sizable literature recognizing the link between Internet connectivity and economic and social wellbeing of a population. Second, understanding the causes and the evolution of disparities in Internet connectivity will facilitate the design and implementation of alternative policy tools that can improve the economic and social wellbeing of the laggard countries and assist them in closing the gap. This paper serves the purpose of identifying the underlying reasons for the existing IDD using improved econometric techniques and data that are more recent and complete.
Distribution of the Digital Divide
The global map of the digital divide has evolved since the introduction of the Internet in North America and Europe starting in 1980s. According to the G8 Digital
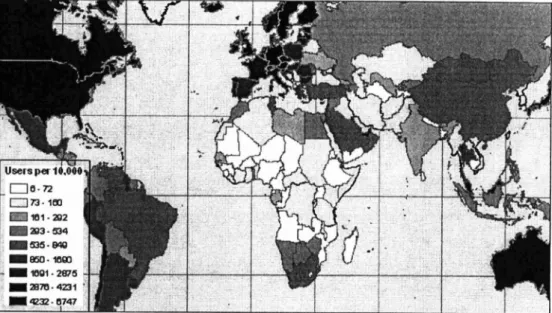
Opportunity Task Force (DOT Force) the percentage of Internet users in the population of developing countries increased from 0.1 percent to 1.6 percent from 1995 to 2001 (bridges.org, 2006). However, the increase was much more marked for developed countries, rising from 4 percent to 28 percent over the same time span. Figure 1 illustrates the spatial expression of this divide, with OECD countries (Europe, North America, and a handful of Asia-Pacific countries) leading the world in Internet connectivity, followed by several Latin American, Eastern European, and Middle Eastern countries as well as China and South Africa. Extreme laggard regions include Sub-Saharan Africa and other landlocked and impoverished states in South America, Central Asia, and Southeast Asia.
The determinants of IDD have been explored in prior literature, both from a global point of view as well as a regional perspective. Regardless of the scale of analysis, however, common explanations of the IDD can be divided into three categories: economic factors (level and equality of wealth and income), cultural factors (religion and language), and factors related to the telecommunications infrastructure (ownership, inhstructure, pricing). The regional studies furthermore take into account region-specific factors. For example, Sub-Saharan Africa exhibits unique conditions (such as the extent of HIVIAIDS) with respect to IDD, to warrant the
generation of a specialized regional literature (see, for example, Mutula, 2004). The Eurasian transition economies also exhibit regional commonalities - such as a particularly wide range of cultural traits
-
that have justified a regional research approach (Dimitrova and Beilock, 2005).48
Figure 1. Distribution of the International Digital Divide, 2003.
Data Source: World Bank Development Indicators CD-ROM (2005).
Generally speaking, the digital divide between developing and developed countries is widening. Only a few countries, such as China and South Korea, have been able to keep pace with ICT developments but even these have been unable to close the gap because more developed countries continue to move forward at a faster pace (Campbell, 2001).
In a study of ICT production and diffusion in Asia, Wong (2002) examined the extent to which the presence of ICT goods manufacturing has helped Asian countries generate sufficient "digital dividends" to attain higher rates of ICT diffusion. Using regression analysis, the study shows that the link between ICT production and diffusion is rather weak and that Asian countries as a group exhibit higher disparity in ICT adoption than non-Asian countries, after controlling for the level of economic development. Similarly, in a study of ICT industry development in China, Meng (2002) provides empirical evidence that in spite of China's astonishing pace of progress in its ICT industry, a clear digital divide exist among its economic regions.
While within-country digital divide is not visible in Figure 1 and does not lie within the scope of this project, other research highlights intra-national digital divides within countries including Chile (Mendoza and Toledo 1997) and Germany (Kubicek 2004), to name just two examples. Importantly, the findings include the observation that withincountry digital divide along socio-economic demographic lines (gender, race, ethnicity, age, income, education) is shrinking in developed countries. For example, recent evidence from the United States suggests that African-Americans, Hispanic Americans and Asian-Americans are fast closing the digital divide by gaining access
to and increasing their use of the Internet (Maniott, 2006). Recent international data collected and compiled by the World Internet Project report a similar trend in several developed countries. However, experts quoted in Mamott (2006) caution that a new dimension of digital divide may be opening up in terms of the type and quality of access to the Internet that is far more challenging than the access alone. Finally, recent evidence from the Oxford Internet Survey (Dutton, 2005) as well as the World Internet Project suggests that the diffusion of the Internet is likely to be reaching a plateau in developed countries. In other words, unlike other technologies, such as TV, the Internet diffusion will in all likelihood reach a point of saturation.
In summary, while Internet access and use continue to increase exponentially on a global basis, the extent of Internet diffusion and utilization varies widely across regions, countries, social classes, and ethnic groups. Research evidence presented above points to a widening gap between developed and developing countries. While the digital divide presents a threat, it also offers tremendous opportunities for developing nations to narrow the social and economic inequalities by facilitating and encouraging a faster diffusion of ICT. In fact, some Southeast Asian countries, such as Thailand and Malaysia, have created new agencies to speed the implementation of ICT and to address digital divide issues (Tipton, 2002). But, it is important to keep in mind that the impact of the Internet diffusion on the economic and social wellbeing of nation is not uniform as technologies interact with a wide range of cultural and social factors to produce certain consequences (Light, 2001).
Determinants of
the
Digital DivideDeterminants of inequality in access to ICT are known as first order effects, while those impacting inequality in the ability to use ICT are known as second order effects (Hargittai 2002, Dewan and Riggins 2005). Among the first quantitative attempts to explore and explain the international digital divide is Eszter Hargittai's (1999) paper
that reports findings on eighteen members of the Organization for Economic I Cooperation and Development. Evaluating a wide range of (mainly first order)
variables at the macro level, Hargittai concludes that the most important determinants of international disparities in ICT include economic wealth and telecommunications infrastructure, findings that would be echoed in nearly every subsequent study, irrespective of data scope and timefiame. Specifically, Hargittai (1999) finds that income alone explains 38 percent of the variation of Internet penetration among OECD countries. The "global" analysis of Internet users per 10,000 individuals
("IUR", Internet User Rate) in 105 countries undertaken by Beilock and Dimitrova (2003) also yields the primacy of per capita income as a major determinant of the IDD. In an important regionally-focused follow-up paper on the determinants of the digital divide, Dimitrova and Beilock (2005) reiterate the importance of infrastructure and income in influencing the IDD. Specifically, they find that among the transition economies 8 1% of the variation in the IUR is explained by income and infrastructure.
In a comprehensive analysis of the determinants of the global digital divide, Chinn and Fairlie (2004) find parallel results to Hargittai (1999), supporting that economic
wellbeing and infrastructure have significant influence on the digital divide. Chinn and Fairlie (2004) indeed find that infrastructure, measured as the telephone density and the regulatory quality, alongside the economic wellbeing of the countries, measured as income per capita, are the leading determinants of computer use. At the same time, the authors discover that Internet penetration is chiefly driven by electricity consumption, youth dependency, income per capita, and regulatory quality, and qualify other studies that identify the importance of telephone density and Internet access pricing. Chinn and Fairlie (2004) underline the non-significance in their models of the years of education and the negative effect of trade openness on Internet penetration. Our methods shed light on these fmdings. Finally, the authors provide evidence regarding the robustness of their results across different regions of the world.
In examining other first order effects (access to ICT), Hargittai (1999) tests whether the national distribution of income, alongside average income level of the economy, plays a role in affecting the IDD. Her results suggest that it is the level of income rather than the distribution of it --measured by the Gini coefficient-- that matters for the existence and evolution of the IDD (named after the Italian statistician Corrado Gini, the Gini coefficient measures the extent of inequality in a distribution). Testing second order effects (ability to use ICT), Hargittai (2002) later augments her macro- economic findings at the individual-level, revealing the importance of online skills.
In a more recent paper, Bagchi (2005) examines the factors contributing to the digital divide between members of the Organization for Economic Cooperation and Development (OECD) and Economic Commission for Latin America and the Caribbean (ECLAC). The author defines the digital divide as the division between those who have access to information and communications technology and those who do not. Multiple yardsticks are used in the study to measure this divide, including telephone, cell phone, PC, and Internet usage per 1,000 individuals, from which the author extracts a factor named "IT Index". This index is then correlated with independent variables in line with past research, and linear regression models are developed, confirming earlier results. However, one limitation of this study is the small sample size, due to missing values for a number of indicators.
Chen and Wellman (2004) use data from Nua.com (available from
http:/hvwwhvwwclickz.com/ at the time of this writing) and the International Telecommunication Union (ITU) to describe changes over time in the percent of population on-line in eight countries. Notwithstanding the shortcomings of their dataset, they find that in just one year the divide between "first movers" (USA) and relative "latecomers" (UK, Korea, and Japan) decreases most rapidly, pointing out that some diffusion continues to take place in laggard states such as China (where the population online increased from 2.5% to 4.8%). Although they do not provide evidence through any modeling or any econometric tests, the authors speculate that the driving forces in the digital divide across countries include cost differentials, English language competency, relevant content, and technological support. However, Hargittai (1999) undertakes a formal testing of the significance of several of these variables, specifically the use of English language and cost differentials (measured as
5 1
the telecom policy and pricing), and finds that these two variables are not statistically significant in explaining the variation in IDD.
The IDD literature is not limited to macroeconomic factors that enable ICT. Other extensive portions take an individual level or organizational level approach to analyzing characteristics that affect access to and use of ICT, as reviewed extensively in an organizational framework set forth by Dewan and Riggins (2005). In her pioneering work, Norris (2001) discusses such factors and the international digital divide at the national and regional level. She employs OLS regression analyses to reveal that in Europe, the same social and demographic factors that explain online participation also help predict access to new (computer related) and old (cable and television) media technologies. These include individuals' characteristics such as age, gender, income, and education. Despite the micro level evidence of the important role played by education, in a formal testing of the hypothesis using macro level data, Hargittai (1999) finds that education does not statistically significantly affect the IDD. Norris (2001) furthermore identifies the influence of the institutional structure of the economy on the digital divide by studying how the digital divide interacts with a variety of political participation modes. Using national case studies and data through 2000, she examines connections between social and political as well as economic development variables and Internet use (measured by percent on-line). Interestingly the variable on the level of democratization is not significant once variables on economic and social development and regional dummy variables are controlled for.
In parallel, Beilock and Dimitrova (2003), focus on the former socialist countries of Eastern Europe, former Soviet Republics, and Mongolia, using a multiple regression analysis. Along with the measures of income and infrastructure, they assess the impact of religion and civil liberties on the number of Internet users per 10,000 individuals. In their 2003 study, the authors find that the R-square of their model increases from 77% to over 90% with the addition of a variable measuring Roman Catholicism or Orthodoxy, which yields a positive effect. In their 2005 study, Dimitrova and Beilock confirm the positive effect of Roman Catholicism or Orthodoxy, as well as openness (measured by the level of civil liberties in the country). They also find that the effect of income is insignificant when controlling for infrastructure (income and infrastructure are heavily correlated, at least for the countries involved in this study).
By underscoring the importance of income, even among wealthy states, the above papers support the call for further investigation in particular with reference to the unique characteristics of each country. In response, we set out to investigate a list of variables inspired by this literature, while recognizing a priori that the relationship between the IDD and each of its drivers could very likely be non-linear.
Finally, in their comprehensive and timely literature review on the International Digital Divide, Dewan and Riggins (2005) offer a conceptual framework for organizing past studies on the variables impacting ICT access at the individual and organizational level. The authors systematically list all major past studies on ICT adoption, efforts to bridge the digital divide, and patterns of ICT usage and summarize
their key findings, ranging from individuals and households to companies and demographic groups. The result is an overarching conceptualization of the literature on the levels of individual, organizational, and global analysis, the latter being instrumental in guiding the present study. The authors further segment findings into first order (access to ICT) and second order (ability to use ICT) digital divide. Especially with reference to the second-order divide, the authors call for policy recommendations on the productive use of ICT as well as skills that are complementary to this use.
As detailed above in our literature discussion, existing studies on the IDD do not examine such nonlinearities in the relationship between the IDD and its predictors and do not explore the possibility of interactions among predictors, which would imply that the effect of one predictor on the number of Internet users depends on another predictor. By employing the methodology of Multiple Adaptive Regression Splines (MARS), this study explicitly accounts for and empirically identifies the nonlinearities and interactions in the relationship. This contributes to a better understanding of the drivers of the IDD and thus an opportunity to improve policies for closing it.
METHODS AND DATA
Our dependent variable is the number of Internet users per 10,000 individuals (years 2001-2003), as reported by the World Bank. We chose this variable in large part because we possess a relatively complete and reliable dataset for 160 countries, but also because similar yardsticks are widely used in the literature. The measure closely mimics Hargittai's (1999) variable on connected computers per 10,000 and Dimitrova and Beilock's (2005) employment of Internet users per 1000 (or "IURs" - Internet User Rates). Other dimensions of the digital divide can be considered; while the number of Internet users per 10,000 individuals is a measure of basic access to the technology, other dimensions could address the quality of that access, such as bandwidth or human capital available in the economy to support the technology. In order not to overload the paper (and because we lack data, for example, on bandwidth), we will focus here on basic access measured by the number of Internet users per 10,000 individuals. The choice of independent variables included in the analysis was discussed in our literature review. These variables can be categorized into three groups:
1. economic, social and political; 2. ICT pricing-related variables;
3. ICT policy and infrastructure-related variables.
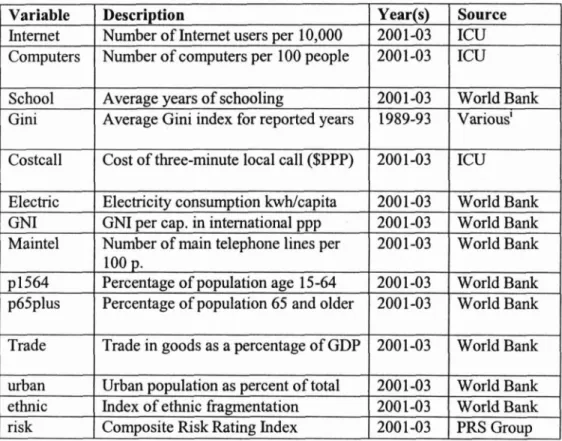
The variables, their time coverage and the sources of the data are listed in Table 1.
The group of economic variables includes variables already discussed in the literature, such as the income level and the income GIN1 coefficient, as well as variables such as the trade openness (a measure of the importance of trade relative to the size of the economy), the demographic structure, and the urbanization of the country. The role of
53
international trade in allowing for technology transfers, which could be interpreted as allowing for reducing the international discrepancy in the use of ICT across nations, has been discussed extensively in the literature. Saggi (2002) and Connolly (2003), among others, suggest the possible role of imports in allowing for the economy to benefit from foreign technologies. Our analysis takes a similar perspective and tests the possibility that increased trade among countries could contribute to reducing the
IDD by transferring technologies across countries. The importance of age, gender, education and culture were also discussed in the more micro-level studies discussed above. The macro analysis in this paper controls for such effects by including measures of education level, the demographic structure and urbanization level of the population, in addition to the extent of ethno-linguistic division within each society.
Table 1. Explanation of Variables
In addition to such measures that reflect economic and social characteristics, the analysis will include a measure of the "risks" in the economy. The composite risk measure (CRRI - Composite Risk Rating Index) not only captures the cyclical economic risks but also the institutional and political soundness of the economies. The higher its value, the less "risky" a country is.
The final group of variables includes those related to the ICT pricing, policy, and infiastructure. We follow the literature by including not only measures of the pricing
Variable Internet Computers School Gini Costcall Electric GNI Maintel p1564 p65plus Trade urban ethnic risk Year(s) 2001-03 2001-03 2001-03 1989-93 2001-03 200 1-03 2001-03 2001-03 2001-03 200 1-03 2001 -03 200 1-03 200 1-03 2001 -03 Description
Number of Internet users per 10,000 Number of computers per 100 people
Average years of schooling
Average Gini index for reported years
Cost of three-minute local call ($PPP)
Electricity consumption kwhlcapita GNI per cap. in international ppp Number of main telephone lines per
100 p.
Percentage of population age 15-64 Percentage of population 65 and older
Trade in goods as a percentage of GDP
Urban population as percent of total Index of ethnic fragmentation Composite Risk Rating Index
Source ICU ICU World Bank Various' ICU World Bank World Bank World Bank World Bank World Bank World Bank World Bank World Bank PRS Group 1
policy, but also the available infrastructure measured both as the number of main telephone lines and the electricity consumption per capita.
Our data are from three years: 2001, 2002, and 2003, and represent the most recent virtually complete data set for the 160 countries under investigation. We do not estimate a time lag for our model because this would greatly reduce our sample size. Moreover, a lag would have little impact because most of our independent variables vary only slightly from year to year. Because the years 2002 and 2003 are nearly identical with respect to the relationship between the our dependent and independent variables, we combine the two years as one in our analysis, indicated by the suffix "02" in our tables (this implies one indicator variable for 2002 and 2003 used as a predictor, represented by one for country-year pairs featuring these two years, zero otherwise). To address missing values (which occurred for all variables other than YEAR, INTERNET, COMPUTERS, MANTEL, P1564, P65PLUS, URBAN and
RISK
which were fully populated), we used a standard imputation method: estimation of missing values via the regression of a predictor on the other predictors; a percentage of between 4.6% (for the variable TRADE) and 36.9% (for the variable ETHNIC) of the observations were imputed in this manner. After imputation, our usable sample size was 480, corresponding to 160 nations.To attain an initial understanding of the relationship between the number of Internet users per 10,000 individuals and our predictors, we propose the following descriptive graphs in Figures 2a-f.
I
1 I
0 20000 40000 60000
GNI
I I
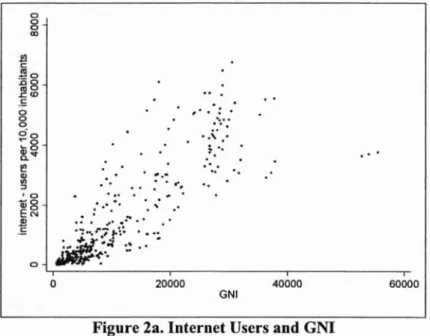
Figure 2a. Internet Users and GNI
The relationship (Figure 2a) between the number of Internet users and GNI shows some signs of non-linearity in the lower ranges of GNI, and some heteroskedasticity (uneven variances across the graph, resulting in a funnel shape; the number of Internet
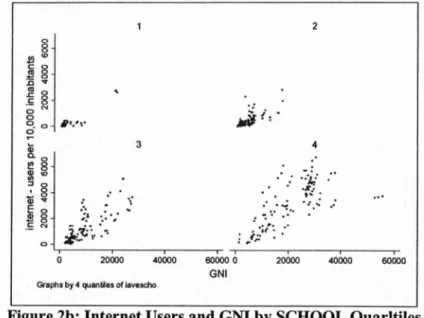
users is higher - but also more variable - as GNI increases). Figure 2b reveals that
GNI seems to have very little effect on the number of Internet users when schooling is
very low, and that, more generally, the relationship between the number of Internet users and GNI seems to depend on schooling.
GNI Graphs by 4 quatiler of hwxho
Figure 2b: Internet Users and GNI by SCHOOL Quarltiles
In Figure 2c, we can see that the curvature in the relationship between the number of Internet users and GNI is greater for lower quartiles of main telephone lines than for the top quartile of that variable.
Main td. lines per 100
Graphs by 4 q u ~ U h s c4 lgg4p
I I
Figure 2c. Internet Users and Main Telephone Lines by
TRADE
QaurtilesThe non-linear relationship between the number of Internet users and schooling emerges very clearly fiom Figure 2d.
0 5 10 15 Average years of schooling
Figure 2d. Internet Users and Years of Schooling
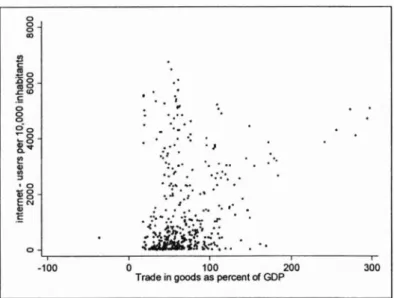
Figure 2e displays the complicated relationship between the number of Internet users and the trade variable.
Figures 2e. Internet Users and Trade In Goods as Percent of GDP 0 0 - 0 00 C 2 0 E O - 2 g .- 0 0
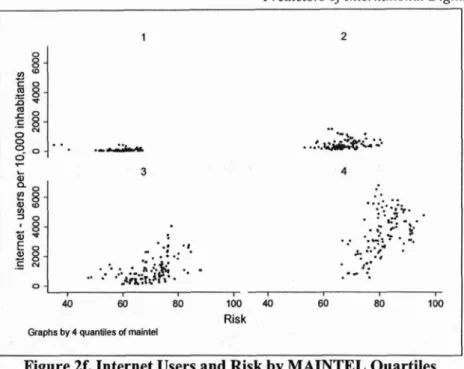
Interestingly, as illustrated in Figure 2f, risk seems to have very little effect on the number of Internet users for lower quartiles of the main telephones variable, but a more pronounced effect in the upper quartiles.
..
.
.
* ..
'.
. . . .
*.
.
. . . .
. .- .
. . .
. . . .
' J t? t $ ; 8 -g::
..
C .- 0 - < 8.
='....
. . .
..
..#.
.:*..
.
.
' < * ". .
.
.
..
-8 - 8.'
...-a...
:...
...
.,
a * .-;.
7 .s-.7 *, '5,.
if., ; :FYI-$*...
.rAEM.d&?'. I -1 00 0 100 200 300Trade in goods as percent d GDP
Risk Graphs by 4 quantiles of melnU
L I
Figure 2f. Internet Users and Risk by MAINTEL Quartiles
In exploring the impact of determinants of the IDD, we embrace the complexity of each observation in space and time and attempt to grasp and explain that complexity using MARS.
This methodology allows us to identify whether the effect of some of our predictors on the number of Internet users might be non-linear; for instance, a glimpse at Figure 2d seems to indicate that the average number of years of schooling for adults does not have much effect on the number of Internet users until about 8 or 9 years of schooling at which point the effect becomes very strong. If one ignores the particular shape of this dependence, one might try to fit a straight line to this graph with inaccurate results. MARS therefore helps us identify break-points in the relationship between the dependent variable and our predictors which might not be obviously identifiable from an exploration of the data.
In addition, the methodology allows us to discover if the effect of one predictor on the dependent variable might depend on the level of another predictor. For example a quick glance at Figure 2f would seem to imply that the effect of RISK on INTERNET is essentially nonexistent for low level of MAINTEL, but quite pronounced for high levels of MAINTEL. Our models help us identify such interactions effects even when they are not easy to detect with an exploration of the data.
The main ideas behind the algorithm are provided to the interested reader in the box below:
Predictors of International Digital Divide
Main ideas of the MARS algorithm
The MARS algorithm, proposed by Friedmann in 1990, entails the following steps. For each continuous independent variable, MARS creates a piecewise linear function with too many change points (knots) to begin with, and then prunes unnecessary knots by a backward procedure.
For each independent categorical variable, MARS merges categories if necessary to obtain a better fit with the dependent variable.
MARS seeks suitable interactions between independent variables.
MARS produces a series of transformations of independent variables that take into account non-lineanties and interactions, known as Basis Functions.
MARS then uses its Basis Functions as independent variables to estimate a least-squares model.
The MARS methodology essentially works by discovering judicious transformations of the independent variables (the Basis Functions) which take into account non-linear dependencies between the dependent variable and the predictors as well as interactions among the predictors. A list of Basis Functions (BFs) and the resulting least-squares equation is given in the Appendix.
Examining the definition of BF3 and BF16, one can see that two breaks occur in the variable on schooling (SCHOOL), one at about 10 years, and one at about 11 years. This implies that the slope of the variable SCHOOL will change in the model when SCHOOL passes through these values. Also, as evidenced for example in BF2, SCHOOL interacts with GNI, so that the effect of SCHOOL on the dependent variable will depend on GNI, and vice-versa.
Over-fitting is controlled in a number of ways in the MARS algorithm, which we do not detail here for the sake of space (details are given in Friedman, 1991). In our model, we used ten-fold cross-validation to determine the penalty to be attributed to each knot (break-point). We also note that our independent variables are correlated, but not to the extent of causing severe numerical or interpretation problems. For a discussion of multi-collinearity issues in the context of MARS models we refer the reader to the article by De Veaux and Ungar (1994). We finally note that we did not attempt to model the time autocorrelation between values of variables for 2001 and 2002-2003, because two time periods are likely to be too few to model this autocorrelation. Time effects and their interactions with suitable predictors (MAINTEL) are, however, captured by Basis Functions BF18, BF 19 and BF 2 1.
ANALYSIS
A N D
INTERPRETATIONThe four most important variables identified by the MARS algorithm, aside from YEAR (with a relative importance level of about 41) are as follows:
income per capita ("GNI"), with a relative importance level of 100 infrastructure ("MAINTEL"), with an importance level of about 73
education ("SCHOOL"), with an importance level of about 54 trade ("TRADE), with an importance level of about 48.
Other variables that intervene in the model are P65PLUS (importance level of about 29), RISK (importance level of about 27) and URBAN (importance level of about 6.5). We note that the importance of a variable is measured by the amount of accuracy lost to the model if that variable is dropped. Our model, using 480 observations, yields an R-square of .93.
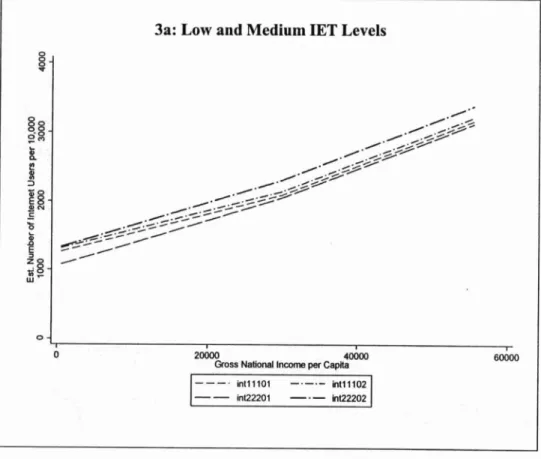
MARS output can be fairly complicated to interpret, because of the difficulty in interpreting interactions, particularly in the presence of non-linear relationships. Therefore, we propose the following graphical method. In order to explore the dependence of the number of Internet users on each of the four leading indicators, we fix the levels of the remaining three indicators at their first, second (median), and third quartile, respectively, and other variables at their median, providing a basis for comparison. In Figures 3-6, these levels are referred to as "1 1 I", "222", and "333", respectively. For example, in Figure 3b, the thick solid line refers to the dependence of Internet on GNI for levels of inhstructure, education, and trade ("IET") fixed at their third quartiles in 2002-03 (int33302).
Figure 3. Effect of GM on Internet Users, for Different Levels of IET
(infrastructure, education and trade)
3a: Low and Medium IET Levels
8
- 0.- 0 ' , . ~ -0- .=>9z
f
2 E!2- 9-
- '6 $;
!2
- u - 0 - .+0.0.5>2~
0.. ggO ,.5./0 / .'.;..w./.<L.
/4>0 ,.<,,s.-z, ,.,>.:is--/ > f - - / (../&>.-=='
//-/--//.</'
7 0 20000 40000Gmss NEUOMI Income per Capita 60000
in111101 -.-.- ht11102
--
In122201-
.- hU2202As shown in Figure 3a, the effect of GNI is more pronounced after $30,000, and the break is most evident for the lower quartiles of our other key variables ("IET"). After $30,000 the effect of GNI is similar for all levels.
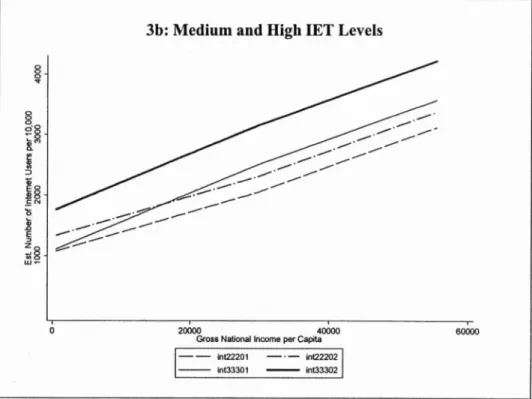
Figure 3b shows that the difference between 2001 and 2002-03 is higher for higher quartiles of JET (solid lines) than for median levels (dashed lines): during this period,
the growth in Internet users is highest in countries with the best infrastructure, highest education, and highest trade. Also, the nature of the break is different for third IET quartile: for this group, the effect of GNI is weaker after $30,000.
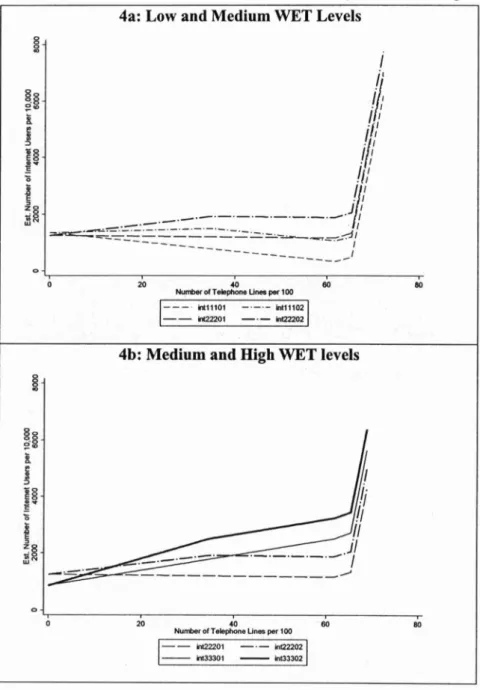
In Figures 4a and 4b, the groups are determined by the quartiles of wealth, education, and trade ("WET"). Dependence of the number of Internet users on infrastructure at all levels is somewhat similar, but there is a slight break at about 62 and very sharp increase (clear break in Figure 4a and 4b) after 65 lines per 100 (close to the 95"' percentile of the MAINTEL variable). The models suggest that the number of telephone lines is a meaningful predictor for the number of Internet users only after the number of telephone lines has reached a high level, in particular for lower WET levels: for higher WET levels, the estimated number of Internet users starts increasing with infrastructure right fiom the start - albeit much more slowly than after the break point of 65 lines per 100 population.
3b: Medium and High IET Levels
8
-Q
;!i
- f z - - '6 & n 5 z * Q - w - 0 2 m 4M)(M 600M)GPJM Nltiacul lnarma par Cam
--
hm201 -.- inn2202-
hW3301-
in03302- Note: the lines designated with the suffix "01" are for 2001, and those designated with "02" are for 2002-03
6 1
4a: Low and Medium WET Levels
4b: Medium and High
WET
levels0
0 20 40 60
Nundm of Tabphone U n r p r 1W m
Figure 4. Effect of Telephone Lines on Internet Users, for Different Levels of WET (wealth, education and trade). Note: Excluded from the graphs are any observations with estimated number of
Internet users - 8000 (1 1 observations for a., 13 observations forb).
We also note that the slope of the lines after the break-point of 65 lines per 100
population actually depend on the value of the variable RISK. When RISK is fixed at its median value of 68.15, that slope is about 836, as represented in Figure 4. However, when RISK is fixed at its first quartile (61.91), the slope is as high as
1,122.6, and when RISK is fixed at its third quartile (76.33), the slope is quite a bit
62
lower at about 460. Interestingly this implies that a lower risk rating (we recall that less risky countries have higher values of this variable) is associated with a steeper increase in Internet with infrastructure, at least after a break-point of 65 lines per 100
population has been reached.
I I
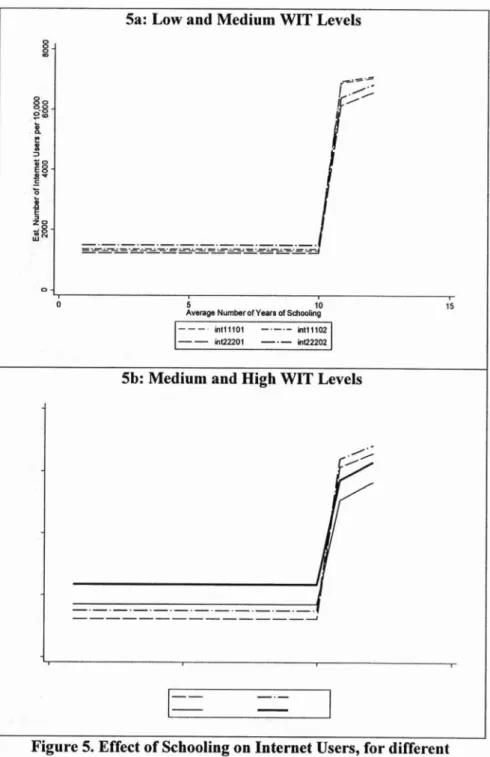
Figure 5. Effect of Schooling on Internet Users, for different levels of WIT (wealth, infrastructure and trade)
In Figures 5a and 5b, the groups are determined by wealth, infrastructure, and trade ("WIT"). Education appears to have no effect on Internet until about ten (9.99) average years of schooling (close to 93d percentile of the SCHOOL variable), at which point a very sharp increase takes place. At 10.8 years (96" percentile of the SCHOOL variable), this effect tapers off. Beyond 10.8, the impact of education is stronger for lower levels of WIT, since the graphs for different levels of WIT in the high range of education are higher and higher as levels of WIT decrease. As in Figure 5a, the lower WIT quartiles (1 1 1) show a sharper initial post-ten year increase but also taper off faster than the higher WIT values in Figure 5b (222), which in turn behave the same way relative to the highest WIT values (333). As in the graphs of infrastructure (Figure 4) the difference between 01 and 02/03 is larger for the higher WITS (total range in Figurer 5b) than the lower WITS (total range in Figure 5a).
In Figures 6a and 6b, the groups are based on wealth, infrastructure, and education
("WIE"). The variable examined is trade in goods as a percentage of GDP, which represents a measure of a country's reliance on external trade or the openness of its economy. Using this measure, Internet use actually declines with trade until the point at which trade represents 128% of GDP (near the 94th percentile of TRADE). It then increases with trade as a percentage of GDP, accelerating dramatically after 169.05% (at the tail end of the TRADE distribution, past the 95" percentile).
An inversion of WIE (wealth, infrastructure, education) levels is evident in the relationship between trade and Internet use, as shown by both Figure 6a and 6b. In other words, the importance of trade at lower levels of
W E
actually increases more dramatically than at higher levels. The greatest inversion is in Figure 6b, which means that at the highest levels of WIEs, trade has the weakest impact on Internet use.DISCUSSION AND CONCLUSIONS
On the surface, it appears that our findings simply confirm what earlier research has discovered: the most important factors affecting the number of Internet users within a country are economic wealth and telecommunications infrastructure, followed by the level of education and the trade openness of the country. Our analytical approach allowed us, however, to discover associations that earlier research had missed. In particular, our results reveal that the effects of the main variables vary according to the levels of the other variables (e.g., the effects of wealth depend upon the aggregated levels of infrastructure, education, and trade). Also, the analytical approach we used allowed us to demonstrate that the effects of the main variables are seldom linear. The rest of this section will discuss the specific findings and their practical implications at a more detailed level.
Predictors International Digital Divide
Figure 6. Effect of Trade on Internet Users, for Different levels of WIE (wealth, infrastructure and education).
6a: Low and Medium WIE Levels
As indicated by earlier research, the economic wellbeing of a nation (in our case measured by GNI) had a direct positive association with the proportion of Internet user in the population. This finding was not particularly surprising, as income measures represented the most frequently cited determinant in the comprehensive review of the literature by Dewan and Riggins (2005). A more detailed exploration of
8
- 8.8 - 0,- 2i8
- --
Dt
P d!- 0 - -, 40 0 ~ ~ d s h c o a d r a ~ % o ( G D P 50 100 150 200 --- h(11101 M(1102--
-1 -.- ma26b: Medium and High Levels
8'
3-
k5
$8-
--
i
$ 8 - a" 0 ----_
.-.-.---.-.-._._._._.---
--,I -7 JO 0 ~ ~ h ~ a a % o f G D P 50 1w 150 m--
-1 - . - m m-
W3301-
the results suggests, however, that the income effects are not always the same: at a higher aggregated level of infrastructure, education, and trade openness (IET), the proportion of Internet users is higher than at the lower IET levels but the proportion also increased by a larger amount over the 2001-2003 period. We explored the change over only a three-year period and therefore, we cannot make inferences regarding longer-term trends but the short-term effect is clear. At the least advanced IET levels Internet use was barely advancing at all, regardless of the income level. Therefore, special policy measures to encourage growth in infrastructure, education, and trade may be needed to enable Internet usage growth in these countries.
Having a widespread traditional telecommunications infrastructure is a necessary prerequisite for Internet access: dial-up access is entirely based on the voice infrastructure, and a major portion of the broadband connections (those using Digital Subscriber Line or DSL technologies) are using the same underlying wiring as voice does. Thus, it is not surprising that the level of the telecommunications infrastructure is closely associated with the proportion of Internet users in the population. Our results suggest, however, that the effect is not linear: the infrastructure development process must reach a relatively high level before infrastructure improvements will be associated with increased levels of Internet use. In other words, if a critical level has not yet been reached, it is unlikely that small investments will lead to appreciable results. This suggests that political decision-makers and those responsible for infiastructure development have to be patient and not expect immediate advances in Internet use, if the starting level of infiastructure is low. It is also worth noting that at higher GNI, education, and trade (WET) levels infrastructure effects start earlier than at the lower WET levels, where the infrastructure has virtually no effect until a relatively high critical threshold is reached.
In regard to education, policy changes should also be implemented with patience. Higher levels of Internet use are associated with higher levels of education, but only after reaching a threshold of ten years of schooling. Moreover, increasing the level of education beyond this threshold level will not have a strong effect on Internet use: after about 11 years of education, the acceleration of Internet use drops off. Thus, it appears that the critical investment is to bring societies to the completion of the secondary level of education.
Our results have revealed that the relationship between openness to trade and Internet penetration is quite complicated. We were able to verify the results of Chinn and
Fairlie (2004), who found that this variable has a negative effect on Internet
i
penetration, a result they considered to be somewhat counter-intuitive. We alsoobserved such a negative effect, but this effect is inverted once high levels of trade
1
openness are reached. We note here that the variable on trade represents to someextent the size of the economy; very large values (in the 240 -280% range) occur for small economies such as Singapore and Hong Kong. By contrast, values for large economies such as the US or Canada, are approximately 18% and 66%, respectively.
It is essential to remember that the macro-level indicators do not necessarily reveal all factors that may potentially have an impact on Internet penetration in a specific country. For example, the effects of advances in technology are not limited to infrastructure technologies (such as the basic phone network that our study and many earlier ones have used). The availability of affordable access technologies, such as desktops, laptops and "smart phones", as well as other individual level factors identified by various authors and summarized by Dewan and Riggins (2005) also matter. This seams to have already been recognized by some, such as MIT's Nicolas Negroponte, who recently launched the "One Laptop Per Child" project (http:Nla~tov.org;l). One of the objectives of this project is to enhance Internet connectivity where the basic infrastructure is already present by growing the diffusion of affordable access devices. Therefore, it is important that future studies of the International Digital Divide consider the potential effects of affordable access technologies along with the macro-level determinants discussed in this paper and in the literature.
The main contribution of this study is an explicit recognition of the complexity of the relationships between Internet use and its determinants. Our results, obtained using the MARS methodology, clearly demonstrate that these relationships are not always linear and that the independent variables have significant interactions. While our results support the known importance of wealth, infrastructure, and education on Internet use, they take our understanding of these phenomena hrther by revealing at a more detailed level how these effects vary depending on the values of other variables. Moreover, our findings suggest that policy makers interested in increasing the Internet use, and thus closing the digital divide, should consider multiple factors simultaneously and understand their joint effects. They should also be mindful that determinants of Internet use must reach a critical level before their effect is realized.
REFERENCES
Bagchi, Kallol. "Factors Contributing to the Global Digital Divide: Some Empirical Results".
Journal of Global Information Technology Management. (8:3), 2005, pp. 47-65.
Beilock, Richard, and Daniela Dimitrova. "An Exploratory Model of Inter-Country Internet Diffusion". Telecommunications Policy. (27: 3-4), 2003, pp. 237-252.
Bridges.org. "It's Not About Technology, It's About the People". Available at
htto://www.bridges.orp/. Accessed 2 September 2006.
Campbell, Duncan. "Can the Digital Divide be Contained?", International Labour Review,
(140:2), 2005, pp. 119-141.
Chen, Wenhong, and Barry Wellrnan. "The Global Digital Divide- Within and Between Countries". I T and Society. (1:7), 2004, pp. 39-45.
Chinn, Menzie D., and Robert Fairlie. "The Determinants of the Global Digital Divide: A
Cross-Country Analysis of Computer and Internet Penetration". Bonn: Forschungsinstitut zur
Zukunft der Arbeit. IZA Discussion Paper No. 1305,2004.
C o ~ o l l y , Michelle. "The Dual Nature of Trade: Measuring its Impact on Imitation and Growth". Journal of Development Economics, (72: l), 2003, pp. 3 1-55.
De Veaux, Richard, and Lyle Ungar. "Multicollinearity: A Tale of two Non-parametric Regressions". In Selecting Modelsfrom Data: AI and Statistics IV, (ed P.Cheeseman and R.W.
Oldford), New York: Springer-Verlag, 1994, pp.293-302.
Dewan, Sanjeev, and Frederick J. Riggins. "The Digital Divide: Current and Future Research Directions. Journal of the Association for Information Systems, (6:12), 2005, pp 298-337. Dewan, Sanjeev, Dale Ganley, and Kenneth L. Kraemer. "Across the Digital Divide: A Cross- Cultural Analysis of the Determinants of IT Penetration". Journal of the Association for
Information Systems, (6: 12), 2005, pp 409-432.
Dimitrova, Daniela, and Richard Beilock. 'Where Freedom Matters: Internet Adoption among the Former Socialist Countries". The International Journal for Communication Studies. (67:2), 2005, pp. 173-187.
Dutton, William, Corinna di Gennaro, and Andrea Millwood Hargrave. "The Internet in Britain", Oxford Internet Institute, University of Oxford, 2005, pp. 1-59.
Fink, Carsten and Charles J. Kenny. "W(h)ither the Digital Divide?" Journal of Policy,
Regulation and Strategy for Telecommunications. (5:6), 2003, pp. 15-24.
Friedman, Jerome. "Multivariate Adaptive Regression Splines (with Discussion)". Annals of
Statistics. (19:1), 1991, pp. 1-141.
Fong, Eric, Bany Wellman, Melissa Kew, and Rerna Wilkes. "Correlates of the Digital Divide: Individual, Household, and Spatial Variation". University of Toronto. Available at:
htt~:Nwww.chass.utoronto.ca/-wellman/Dublications/digitaldivide/dinital-revod.vdf, 2001. Accessed 4 September 2005.
Hargittai, E. "Weaving the Western Web: Explaining Differences in Internet Connectivity among OECD Countries". Telecommunications Policy. (23: 1011 I), 1999, pp. 70 1-7 18.
Hargittai, E. "Second-Level Digital Divide: Differences in People's Online Skills", First
Monday (7:4). Available at: http://www.firstmondav.ordissues/issue7 4hargittaiIindex.html. Accessed 20 September 2006.
Kubicek, Herbert. "Fighting a Moving Target: Hard Lessons from Germany's Digital Divide Program". IT and Society. (1 :6), 2004, pp. 1-19.
Light, Jennifer S. "Rethinking Digital Divide", Haward Educational Review, (71:4), 2001, pp. 709-733.
Mamott, Michel. "Digital Divide Closing as Blacks Turn to Internet", The New York Times, 2006, March 3 1.
Mendoza, M. and J. Alvarez de Toledo. "Demographics and Behavior of the Chilean Internet Population". Journal of Computer-Mediated Communication. (3: l), 1997.
Meng, Qingxuan and Mingzhi Li. 'New Economy and ICT Development in China",
Information Economics and Policy, (14:2), 2002, pp. 275-295.
Mutula, Stephen. "Peculiarities of the Digital Divide in Sub-Saharan Africa". Paper presented at the Southern Voices and Global Order Conference in Warwick, UK. 7-9 July 2004.
Available at:
http://www.emeraldinsi~ht.com/Insight/htmVOutt,~t/Pub1i~hed~Emera1dFu11Te~~~1e/Article
s/2800390203.html, Accessed 10 October 2005.
Noms, Pippa. "The Worldwide Digital Divide: Information Poverty, the Internet and Development*'. Paper for the Annual Meeting of the Political Studies Association of the UK.
London, 10- 13 April 2000.
Noms, Pippa. Digital Divide? Civic Engagement, Information Poverty and the Internet in
Democratic Socieites. New York: Cambridge University Press, 2001.
Saggi, Kamal. Trade, Foreign Direct Investment, and International Technology Transfer: A Survey. The World Bank Research Observer, (17:2), 2002, pp. 191-235
Sciadas, George (ed). "Monitoring the Digital Divide and Beyond". Published by Orbicom Available at: http://www.infodev.orden/Publication.20.hl, 2003. Accessed 29 September 2006.
Tipton, Frank. "Bridging the Digital Divide in Southeast Asia". ASEAN Economic Bulletin, (19:1), 2002, pp. 83-99.
World Bank. World Bank Development Indicators 2005. Available at:
http://web.worldbankor~SITEIEXTERNAWDATASTATISTICS/O..contentMDK20523
7 10-menuPK:232599-pagePK:64 133 150-viPK:64 133 175-theSitePK:239419,00.htrnl.
Accessed 27 February 2006.
Wong, Poh-Kam, "ICT Production and Diffusion in Asia: Digital Dividends or Digital Divide?", Information Economics and Policy, (14), 2002, pp. 167-187.
World Internet Project, www.worldInternetl3roiect.net, Accessed 20 October 2005.
APPENDIX: MARS BASIS FUNCTIONS B a s i s F u n c t i o n s --- --- BF1 = max(0, GNI - 2 9 7 4 0 . 0 0 2 ) ; BF2 = max(0, 29740.002 - GNI ) ; BF3 = m a x ( 0 , SCHOOL
-
9 . 9 9 0 ) * BF2; BF5 = m a x ( 0 , MAINTEL-
6 5 . 3 7 0 ) ; BF6 = max(0, 6 5 . 3 7 0-
MAINTEL 1; BF7 = max(0, TRADE - 1 2 8 . 0 9 7 ) * BF2; BF8 = m a x ( 0 , 1 2 8 . 0 9 7-
TRADE ) * BF2; BFlO = m a x ( 0 , 6 1 . 7 7 0-
MAINTEL ) * BF2; BF11 = max(0, P65PLUS-
1 5 . 5 4 5 ) * BF2; BF14 = max(0, 1 6 9 . 0 5 0 - TRADE ) * BF6; BFlS = max(0, RISK-
3 5 . 0 2 5 ) * BF5; BF16 = m a x ( 0 , SCHOOL - 1 0 . 8 4 0 ) * BF6; BFl8 = ( YEAR = 2001) ; BF19 = ( YEAR = 2002 OR YEAR = 2 0 0 3 ) ; BF21 = max(0, 3 4 . 8 6 0-
MAINTEL ) * BF19; BF24 = m a x ( 0 , P65PLUS-
1 5 . 1 7 2 ) * BF2; BF30 = m a x ( 0 , URBAN-
7 . 3 9 5 ) * BF1; Y = 5247.620 - 0.062 * BF2 + 0 . 2 3 7 * BF3 + 2357.414 * BF5-
1 0 7 . 8 7 8 * BF6 + 0 . 0 0 2 * BF7-
0 . 0 0 1 * BF8 + 0 . 0 0 2 * BFlO-
0 . 1 7 5 * B F l l + 0 . 5 5 1 * BF14-
4 5 . 9 2 9 * BF15-
1 0 2 . 6 9 6 * BF16-
719.146 * BF18 - 20.782 * BF21 + 0.105 BF24 + .824533E-03 * BF30;model INTERNET = BF2 BF3 BF5 BF6 BF7 BF8 BFlO B F l l BF14 BF15 BF16 BF18 BF21
BF24 BF30;
Predictors of International Digital Divide
Joel I. Deichmann holds a Ph.D. in Geography from SUNY Buffalo, and is currently Associate Professor in the International Studies Department at Bentley College. His research interests include foreign direct investment, location choice, international education, and international tourism, with a regional specialization in Central and Eastern Europe.
Abdolreza Eshghi is Profesor ofMarketing at Bentley College. His current research interests focus on customer relationship management and international marketing strategy in Eastern and Central Europe. Professor Eshghi is cofounder, along with Professor Haughton, of the first interdisciplinary research team at Bentley College known as Data Analytic Research Team (DART), which has authored several interdisciplinary articles, including the present article, in leading journals.
Dominique Haughton holds a Ph.D. from MIT. She is Profesor of Mathematical Sciences at Bentley College. A widely published researcher, Dr. Haughton 's areas of interest include analyses of living standards in developing countries, with an emphasis on Vietnam, statistical issues in marketing and statistics applied to social networks. With Professor Eshghi, she is co-founder of DART, which focuses on the application of state-of-the-art statistical techniques to a variety of problems.
Michele Masnaghetti is a Statistician at Epsilon, a Boston-based database marketing company. His research interests are applied statistics and data modeling. He holds a Master of Science in Marketing Analytics from Bentley College.
Selin Sayek is Assistant Profesor of Economics at Bilkent University, Turkey. She holds a Ph.D. degree in Economics from Duke University. Prior to joining Bilkent University, she worked as an Economist at the International Monetary Fund (IMF), and as a profesor of Economics at Bentley College. She also sewed as a visiting profesor at Georgetown University and as a consultant at the World Bank. Her current and past research focuses on the effects and determinants of foreign direct invetment (FDI) and aidflows, on which she has published.
.
Heikki Topi is Associate Profesor of Computer Information Systems and Chair of the CIS Department a Bentley College. He earned his Ph.D. in Management Information Systems from the University of Indiana. His current research focuses on: human factors and usability issues in enterprise systems; information search and data management; the effects of time availability on human-computer interaction; and the applications of modern analytical methods in business context. He is actively involved in national computing curriculum development eflorts.