AKÜ FEMÜBİD 18 (2018) 015604 (285-294) AKU J. Sci. Eng. 18 (2018) 015604 (285-294)
DOİ:
10.5578/fmbd.66804Seismic Vulnarability Assessment of Reinforced Concrete Buildings
Located in Esenler District of İstanbul
Hasan Özkaynak
1, Ayşe Elif Özsoy Özbay
21,2 Beykent Üniversitesi, Mühendislik-Mimarlık Fakültesi, İnşaat Mühendisliği Bölümü, İstanbul. e-posta: 1[email protected], 2[email protected]
Geliş Tarihi:03.11.2017 ; Kabul Tarihi:03.04.2018
Keywords
Rapid visual screening; Seismic assesment; Street visual surveying;
Reinforced concrete structures; Earthquake
performance.
Abstract
Istanbul is one of the largest cities of Turkey which is located on the regions where there is high seismic activities. Recent studies performed on mid-rise reinforced concrete (RC) structures showed that majority of the existing building stock does not conform to current seismic code requirements and they can be evaluated as vulnerable structures. The seismic performance evaluation of an existing buildings can be conducted by using nonlinear procedures stated in Turkish Earthquake Code (TEC-07). According to the code, an existing building completing its economic lifetime and/or having a performance level in between “Life Safety” to “Collapse Prevention” under the effect of Design Earthquake is defined as “building under seismic risk”. Before going into such a detailed seismic evaluation procedure for each building, there is a need for regional screening surveys to rank the building stock in terms of the potential seismic hazard. This study aims to assess the seismic vulnerability of a group of midrise RC buildings located in Esenler District of İstanbul employing the Rapid Visual Screening (RVS) procedure. In this study, valuable results have been derived to rank the buildings in terms of seismic vulnerability of existing structures located in Istanbul. It is concluded that the number of stories is the key parameter to change the priority range of the building from lowest to highest level. Majority of the buildings with the highest priority level (0≤PS≤30) suffer from the parameters related with poor construction quality, soft story irregularity and the heavy overhang. The aforementioned method could be used to estimate the performance scores of the buildings to determine the priority for more detailed seismic risk assessment procedures.
İstanbul’un Esenler İlçesinde yer alan Betonarme Yapıların Sismik Hasar
Görebilirliğinin Değerlendirilmesi
Keywords Hızlı görsel tarama teknikleri; Sismik değerlendirme; Sokaktan görsel tarama; Betonarme yapılar; Deprem performansı. Özetİstanbul, Türkiye'nin sismik aktivitesi yüksek olan en büyük şehirlerinden biridir. Orta yükseklikteki betonarme yapılar üzerinde yapılan son çalışmalar, mevcut bina stokunun çoğunluğunun güncel deprem yönetmeliği şartlarına uymadığını dolayısıyla hasar almaya meyilli yapılar olarak değerlendirilebileceğini göstermiştir. Mevcut binaların deprem performansının değerlendirilmesi, Türk Deprem Yönetmeliği (TEC-07)'de belirtilen lineer olmayan yöntemler kullanılarak yapılabilir. Mevcut yönetmeliğe göre, ekonomik ömrünü tamamlayan ve/veya tasarım depremi etkisinde performans seviyesi "Can Güvenliği" ile "Göçmenin Önlenmesi” arasında bulunan yapı, "riskli bina" olarak tanımlanmaktadır. Her bina için böylesine detaylı bir deprem değerlendirme yöntemine gerek kalmadan, bina stokunun potansiyel sismik tehlike açısından sıralamak amacıyla bölgesel tarama anketlerine ihtiyaç duyulmaktadır. Bu çalışma, İstanbul Esenler İlçesi'nde bulunan bir grup orta yükseklikteki betonarme binanın “Hızlı Görsel Tarama (RVS)” yöntemini kullanarak deprem güvenliğini belirlemeyi amaçlamaktadır. Bu çalışmada İstanbul'da bulunan mevcut yapıların deprem güvenliğine göre sıralandırılması açısından önemli sonuçlar elde edilmiştir. Kat adedinin, yapının potansiyel risk seviyesini en düşükten en yükseğe değiştirebilen bir anahtar parametre olduğu sonucuna varılmıştır. Kötü inşaat kalitesi, yumuşak kat düzensizliği ve ağır çıkma ile ilgili parametreler, en yüksek risk seviyesine sahip olan binalarda (0≤PS≤30) ortak zafiyetler olarak belirlenmiştir. Söz konusu yöntem, daha detaylı deprem riski değerlendirmesi için önceliğin belirlenmesi amacıyla binaların performans puanlarını tahmin etmekte kullanılabilmektedir.
© Afyon Kocatepe Üniversitesi
Seismic Vulnarability Assesment of Reinforced Concrete Buildings Located in Esenler District of İstanbul, Özkaynak ve Özbay.
286 1. Introduction
The majority of the building stock in Istanbul is under seismic risk, considering the population, the site conditions, and its distance to the North Anatolian Fault. Moreover, the most of the buildings do not comply with the current seismic code requirements. Assessment of seismic performance of a multistory reinforced concrete (RC) structure mainly requires nonlinear analysis including determination of reinforcement ratio, material properties such as concrete and reinforcement strengths through experiments, and as built dimensions of the structural system. The legal judgment about the seismic safety of the buildings requires a detailed procedure for the building owner, the structural engineer and the local authority. However, it is not practical to perform detailed assessment studies for each building in a city scale. Thus, there is a need for scheduled screening surveys at each region in Istanbul to decide for the renewal or retrofitting of the buildings which should be coordinated by the government and local authorities. Assessing the seismic risk of a building stock may be conducted by various methodologies without detailed analysis. These methods provide rapid and reliable statistical data of the existing buildings in order to develop inventories of the building stock for the earthquake disaster planning or the evaluation of regional rehabilitation needs (Sucuoglu et al. 2003; Ozcebe et al. 2003; Sozen et al. 1997; Gulkan et al. 1999; Yakut et al. 2003; FEMA P-154, 2015).
In general, the screening methods in the literature require typical building data such as building location, age, the structural system, the number of stories, structural irregularities and the quality of the construction which could be simply observed from the street view. FEMA P-154 (2015) provides Rapid Visual Screening (RVS) of buildings to identify, and rank the buildings that are potentially seismically hazardous for building officials and inspectors, government agency and private-sector building owners named as "RVS authority". The RVS methodology is based on visual observation of the screened building from the street by completing the building information. The method needs the use,
the size, the photograph and documentation of the observed structural system. Documentation consists of three main forms which correspond to the regions of low, moderate and high seismicity. Accordingly the seismic hazard scores of the surveyed buildings could be determined. The final numerical score is a main indicator which enables to assess the seismic resistance. Tischer et al. (2012) proposed a vulnerability assessment method based on rapid seismic screening of school buildings. The method is able to classify the buildings according to level of irregularities and potential pounding effect. The final score is obtained by performing the method and it includes the effects of horizontal and vertical irregularities deterioration, short column effects and the local site conditions. An alternative procedure is proposed by Sucuoglu et al. (2003). The rapid screening procedure cannot be employed for the detailed seismic evaluation of a single existing building. The method is valid for a group of buildings to determine the regional profile in terms of seismic risk. Moreover, the number of the screened buildings should be statistically sufficient. The method requires survey parameters such as number of stories; existence of a soft story, heavy overhangs short columns and pounding between adjacent buildings. The apparent building quality, topographic effects and the local soil conditions should be determined within this surveying procedure. Performance score (PS) of the screened building is determined by the vulnerability scores (VS) based on the observed survey parameters and the base scores which vary according to the seismic zones related with peak ground velocity (PGV). The method of Sucuoglu et al. (2003) had been employed for a multiple levels of seismic vulnerability assessment for the existing building stock in Zeytinburnu District of Istanbul (Özcebe et al. 2006). Regarding the seismicity, the population and the poor construction quality, Zeytinburnu District were chosen to be the pilot application of seismic assessment within the scope of Earthquake Masterplan for the Istanbul (Istanbul Metropolitan Municipality, 2003). Further applications of the method of Sucuoğlu (2003) had been conducted for vulnerability assessment of the building stocks in the city of Eskisehir (Albayrak et al. 2015) and
287 Bitlis (Işık et al. 2013) which are both located on
highly active seismic zones of Turkey. The same method had also been used for the seismic vulnerability assessment of the reinforced concrete structures in Chittagong and Dhaka Cities of Bangladesh which are under a potential risk to earthquake hazard due to the seismicity and the high population (Alam et al. 2008; Sadat et al. 2010; Sarraz et al.2015).
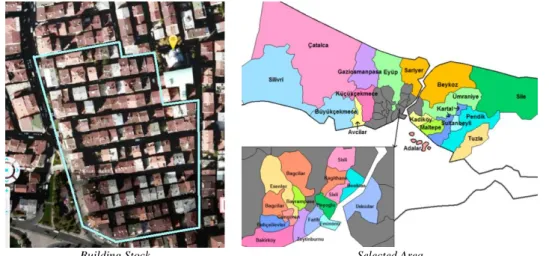
The main purpose of this study is to perform a rapid seismic assessment on the buildings located on a selected territory of Istanbul called Esenler. Esenler
is one of the developing regions in İstanbul with a great number of urban renewal practices. The selected group of buildings is a representative dataset of the existing structures in İstanbul with poor costruction quality. The state of art assessment process includes generating an urban inventory database and regional ranking of the building stocks in terms of potential seismic hazard. This work could be evaluated as a benchmark study and could guide local authorities for the identification of regional rehabilitation needs, development of seismic hazard mitigation programs and supporting information management of the risk profile of the city.
Building Stock Selected Area
Figure 1. Surveying region
2. Rapid screening method
2.1 General properties of the surveyed region This study aims to predict the priority for seismic vulnerability assessment of considerable number of RC buildings in Istanbul by employing the Rapid Visual Screening Procedure (RVS), (Sucuoğlu, 2006). The selected building stock includes 160 sample adjacently located RC buildings on 6 specific parcel-blocks which vary low to mid-rise moment resisting structures, Fig.1. The rapid screening procedure can be employed for the RC buildings up to seven stories. The method which is based on walkdown street surveying, enables estimating the performance scores of the buildings to set the priority for detailed seismic evaluation among the building stock within the screened region.
2.2. Description of the method
The walkdown evaluation method allows a rapid assessment on building stocks to determine the
regional earthquake risks, to allocate the priority of the regions, to plan renewal and to conduct disaster mitigation plans. The following effects should be quantified for the assessment procedure.
1. Number of stories: The number of stories could be defined as the number of floors above the ground. 2. The apparent quality: The apparent quality is determined as the overall appearance of the structure that is categorized in three levels such as good, moderate and poor, Fig.3. The year of construction is not a parameter of the method. However, the apparent quality observations could be correlated by the age of the structure which indirectly affects the seismic performance.
3. The soft story effect: This effect exists for the structures in which the infill walls of ground floor were removed due to the commercial purposes, Fig.2b.
4. Heavy overhangs: This effect is related with the remarkable changes in the plan area of the upper stories with respect to the ground story such as
Seismic Vulnarability Assesment of Reinforced Concrete Buildings Located in Esenler District of İstanbul, Özkaynak ve Özbay.
288 balconies. This effect causes irregularities in mass
and lateral rigidity of the structure.
a) Pounding Effect b) Soft Storey c) Short Column
Figure 2. Some observations related with pounding effect, soft story, and short column
a) Good Quality b) Moderate Quality c) Poor Quality
Figure 3. Apparent quality observations
5. Short column effects: This effect exists for the buildings which have half height infill walls and mid-story beams which cause probable shear failures, Fig.2c.
6. Pounding effects: This effect could be observed for the adjacent structures which have colliding risk during earthquakes, Fig.2a.
7. Topographic effects: This effect depends on the position of the buildings with respect to the local soil level and slope.
8. Seismic risk and local soil conditions: The seismic risk zones are identified by Sucuoğlu et al. (2006) in terms of the peak ground velocity values (PGV) stated in JICA Report, (JICA, 2002).
The performance score is the key indicator of the surveyed building in terms of ranking the seismic risk within the screened region and identifying the priorities for seismic rehabilitation purposes.
Table 1. Vulnerability parameter values (VSM) (Sucuoğlu,
2006)
Effects Vulnerability Score Multipliers (VSM) × Does Not Exists Exists
Soft Story Effect (0) (1)
Heavy Overhang Effect (0) (1) Short Column Effect (0) (1) Topographic Effect (0) (1) Pounding Effect (0) (1)
Apparent Quality Good (0) Moderate (1) Poor (2)
Building seismic performance score (PS) revealing the seismic risk of the RC building is calculated in terms of the base score (BS), the vulnerability score multipliers (VSMi) and the vulnerability score (VS).
289
n i i i VS VSM BS PS 1 *Eq(1)
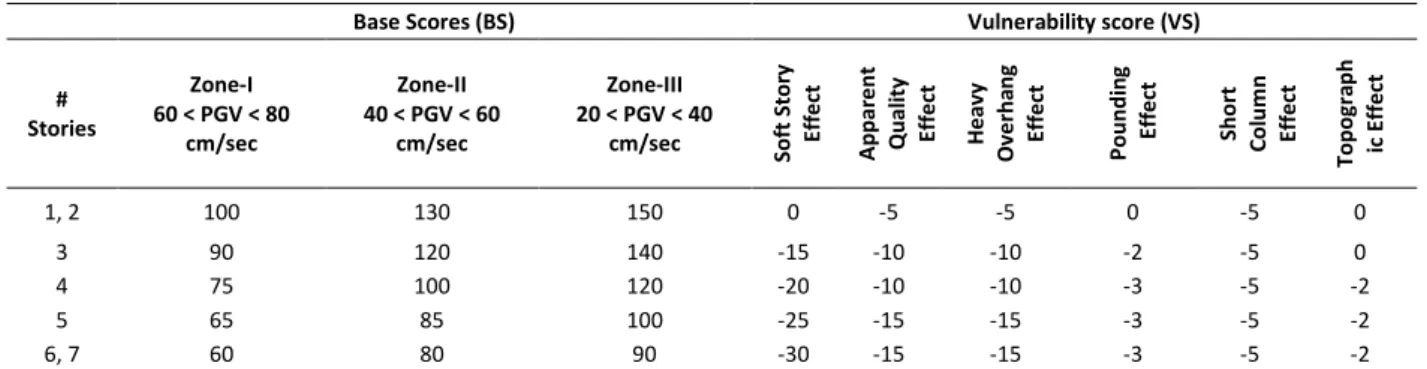
The numerical values assigned to the VSM terms are tabulated in Table 1 where, the numerical values assigned to the base scores (BS) and vulnerability scores (VS) are given in Table 2.
The BS and VS values are sensitive to the number of stories and the seismic risk zones of Zone-I, II and III. The seismic risk zones are classified according to the variation intervals of peak ground velocity (PGV) which were determined by JICA for the city of Istanbul, (JICA, 2002). It should be noted that the total number of stories is the key parameter which affects the score values. However, the variation of vulnerability scores for the pounding, short column and topographic effects, is less sensitive to the number of stories.
A sample RC building with four storey height is given in Table 3. The figure also explains a detailed calculation of PS assigned for a single RC building by
employing the aforementioned screening method. In this study, the interpretation of the numerical results for the building inventory has been represented in terms of four PS ranges based on the previous walkdown survey studies conducted by Sucuoğlu et al. (2006) in Zeytinburnu District of Istanbul. The authors indicate there is a reliable correlation between the preliminary evaluation and the rapid visual assessment in terms of the vulnerability of the buildings. The score range of 0<PS<30 can be defined as the most vulnerable buildings necessitating the “highest priority” for detailed analysis among the dataset. However, the buildings having PS>100 still need detailed assessment with the “lowest priority”. Thus, the rapid visual assessment method employed in this study is crucial for the ranking of the priority for the vulnerability assessment studies in urban scale, but does not imply the real seismic performance of the individual building. Accordingly, the priority levels vs. performance score ranges which have been used within this study are illustrated in Table 4.
Table 2. Base Scores (BS) and Vulnerability Scores (VS) (Sucuoğlu, 2006)
Base Scores (BS) Vulnerability score (VS)
# Stories Zone-I 60 < PGV < 80 cm/sec Zone-II 40 < PGV < 60 cm/sec Zone-III 20 < PGV < 40
cm/sec Soft Stor
y Eff e ct A ppar e nt Qual it y Eff e ct H e av y O ve rha ng Eff e ct P oundi n g E ff e ct Short Colum n Eff e ct To pog ra ph ic Effect 1, 2 100 130 150 0 -5 -5 0 -5 0 3 90 120 140 -15 -10 -10 -2 -5 0 4 75 100 120 -20 -10 -10 -3 -5 -2 5 65 85 100 -25 -15 -15 -3 -5 -2 6, 7 60 80 90 -30 -15 -15 -3 -5 -2
2.2. Application of the method on the sample building stock
In this study, a surveying region has been determined from the map of Istanbul in order to assess the seismic risk of the existing RC buildings by employing the rapid visual screening procedure. The study covers a sample implementation of the procedure by visual inspections of the buildings. The surveying program is conducted on six sample parcel-blocks consisting of 160 RC buildings which are totally adjacently located. The majority of the existing building stock in this area is located adjacent to save from the land cost. The streets
between successive parcel-blocks are located parallel to each other providing a regular geometric surveying field for the screeners, Fig.4. The distribution of the buildings in percentage with 5 and 6 story heights are 36% and 23% respectively.
Seismic Vulnarability Assesment of Reinforced Concrete Buildings Located in Esenler District of İstanbul, Ozkaynak ve Özbay.
290 Table 3. Calculation of PS for a sample building in the
survey region Building survey
code OR-17/12 Number of stories 4
Base Score Zone III 120
Soft story × Does not exist
0
Apparent quality Poor -20
Pounding effect Exists -3
Heavy overhang Exists -10
Topographic effect × Does not exist
0
Short column Exists -5
Performance score (PS)
Moderate priority
82
a) Map of parcel blocks b) Distribution of building stock
Figure 4. Parcel blocks of surveyed region
The structural system of the building stock profile is commonly composed of moment resisting frame buildings having similar construction year. Since the buildings are located in the same region and they have similar structural system properties, evaluation of the seismic risk is independent from the soil conditions and the structural system. The base scores were identified according to the PGV values which corresponds to Zone III for the reference survey region in terms of the applied screening method. The range defined for the PGV values of Zone III has been determined as 20-40 cm/sec. regarding to the PGV distribution map (JICA, 2002). The summary of the building survey for each parcel block on the sample region is summarized in Table 5.
Table 4. Priority levels vs. performance score
Performance Score Ranges Priority Levels Color Legend
0<PS≤30 Highest Priority
30<PS≤60 Secondary Priority
60<PS≤100 Moderate Priority
PS>100 Lowest Priority
According to the surveying study, almost 90% of the buildings have poor and/or moderate construction quality. On the other hand, the pounding effects appear as 76% within the selected building stock, where nearly 70% of the building stock has no short column effect. The majority of the buildings suffer from the heavy over hang effects, where most of the buildings have no soft storey effect. The distribution of buildings in percentages is given in Fig. 5 in terms of storey numbers and performance scores. The performance score of each building is predominantly affected by the height of the building. It is clearly seen from Fig.5 that, the buildings having 2-storey, 3-storey and 4-storey
7% 7% 27% 36% 23% 2-Story 3-Story 4-Story 5-Story 6-Story
291 heights are almost the 21% of selected building
stock with the range of PS>100. However, the group of buildings having 5 to 6 storey heights consists of 18% and 12% of the building stock respectively with the range of 30<PS≤60. Moreover, 9% of the building stock with 6 storey height falls into range of 0<PS≤30. It should be noted that as the buildings get higher, the PS values considerably decreases. The low to mid-rise buildings fall into safer range of PS>100. Thus, the priority ordering for detailed assessment should start with the higher risk group of buildings with the relatively lower PS range (0<PS≤30).
Figure 5. Distribution of buildings in terms of storey
numbers and performance scores.
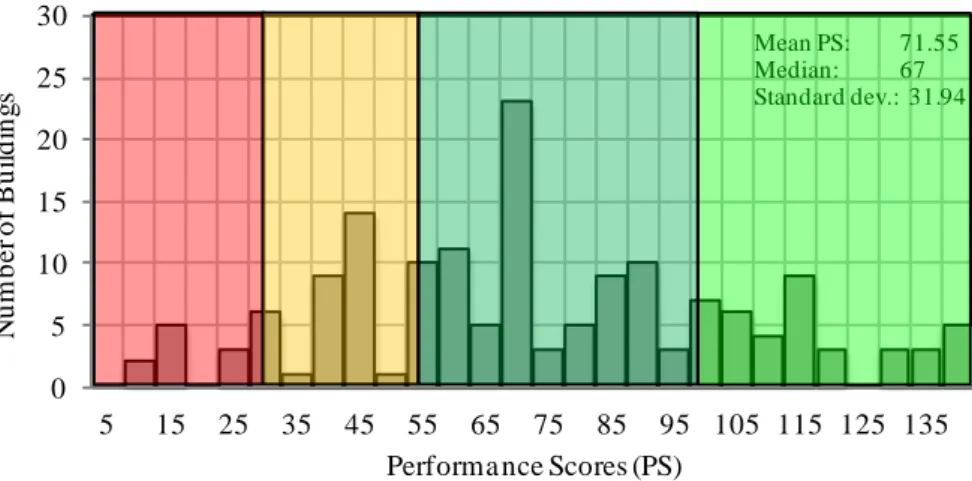
The seismic risk assessment method described above is employed to the selected building stock and the obtained performance scores as given in histogram format in Fig.6.
Figure 6. The histogram chart for obtained performance scores The histogram which is given in Fig. 6 shows the distribution of the building dataset with respect to performance scores obtained from the surveying. The mean value of the performance scores for the building stock has been calculated as 71.55 with a standard deviation of 31.94. Since the standard deviation value for the dataset is 32, the general profile of the building stock could be represented by the range of 60<PS≤100 which corresponds to the
moderate priority level. The number of the buildings which fall into the range of PS>100 is greater than the number of the buildings fall into the range of 30<PS≤60. The distribution clearly shows that 10% of the surveyed buildings have performance scores lower than 30 (0PS30), which means these buildings have the highest priority for detailed intervention and seismic assessment.
0 5 10 15 20 25 30 35 40 45 50
2-story 3-story 4-story 5-story 6-story
D ist ri b u ti o n o f B u il d in g s (% ) 0<PS<30 30<PS<60 60<PS<100 PS>100 0 5 10 15 20 25 30 5 15 25 35 45 55 65 75 85 95 105 115 125 135 N u m b e r o f B u il d in g s
Performa nce Scores (PS)
Mean PS: 71.55 Median: 67 Standard dev.: 31.94
Seismic Vulnarability Assesment of Reinforced Concrete Buildings Located in Esenler District of İstanbul, Ozkaynak ve Özbay.
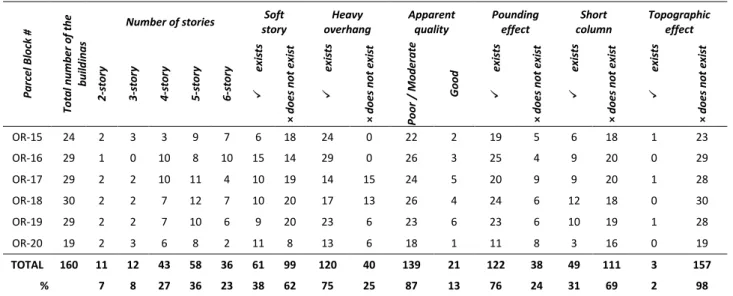
292 Table 5. Summary of the building inventory data
P a rc el B lo ck # To ta l n u mb er o f th e b u ild in g s
Number of stories Soft story Heavy overhang Apparent quality Pounding effect Short column Topographic effect 2 -s to ry 3 -s to ry 4 -s to ry 5 -s to ry 6 -s to ry ex is ts × d o es n o t ex is t ex is ts × d o es n o t ex is t P o o r / M o d er a te G o o d ex is ts × d o es n o t ex is t ex is ts × d o es n o t ex is t ex is ts × d o es n o t ex is t OR-15 24 2 3 3 9 7 6 18 24 0 22 2 19 5 6 18 1 23 OR-16 29 1 0 10 8 10 15 14 29 0 26 3 25 4 9 20 0 29 OR-17 29 2 2 10 11 4 10 19 14 15 24 5 20 9 9 20 1 28 OR-18 30 2 2 7 12 7 10 20 17 13 26 4 24 6 12 18 0 30 OR-19 29 2 2 7 10 6 9 20 23 6 23 6 23 6 10 19 1 28 OR-20 19 2 3 6 8 2 11 8 13 6 18 1 11 8 3 16 0 19 TOTAL 160 11 12 43 58 36 61 99 120 40 139 21 122 38 49 111 3 157 % 7 8 27 36 23 38 62 75 25 87 13 76 24 31 69 2 98
The results of the building survey are also discussed in terms of vulnerability parameters which affect the overall building performance score, Table 6. The most significant observation on the dataset is that the 100% of buildings with the highest priority level (0≤PS≤30) suffer from the poor construction quality, soft story irregularity and the heavy overhang parameter. Since, the performance score calculation is highly sensitive to these three parameters, the most vulnerable buildings with potential seismic hazard corresponding to the highest priority range can be clearly identified by the
visual assessment method. However, only 6% of the building stock is triggered with the topographic effect in the same range of priority.
The effect of pounding appears in 60-80% of the stock in any range of priority. On the other hand, the effect of soft story decreases by the decrease of the priority range. Hence, the existence of soft story effect is 60% which fall into the secondary priority range (30<PS≤60) where 15% of the buildings within the lowest priority level (PS>100) suffer from soft storey effects.
Figure 7. The distribution of buildings considering the existence of the vulnerability parameter within the priority ranges
The existence of vulnerability effects on the performance scores are given in Fig. 7. This figure yields the graphical representation for the distribution of buildings according to the existence of the vulnerability parameter for each PS range. The number of buildings with topographic effect is almost negligible whereas heavy overhang is a
common characteristic for all of the buildings at each priority level.
0 10 20 30 40 50 60 70 80 90 100 0<PS<30 30<PS<60 60<PS<100 PS>100 E xi st enc e of vu lna ra bi lit y ef fe ct s (% ) SOFT STORY HEAVY OVERHANG APPARENT QUALITY POUNDING EFFECT SHORT COLUMN TOPOGRAPHIC EFFECT
294 Table 6. Existence of vulnarabilty parameters within
defined PS ranges (%) PS 0≤PS≤30 30<PS≤60 60<PS≤100 PS>100 Topographic Effect 6 4 0 0 Short Column 19 34 19 46 Pounding Effect 63 83 81 69 Apparent Quality 100 91 92 54 Heavy Overhang 100 79 100 100 Soft Storey 100 60 35 15 3. Conclusions
Istanbul is geographically located nearby the North Anatolian Fault in the Marmara Region of Turkey. The city is highly vulnerable to seismic hazard due the population, the poor construction quality of the existing buildings and the local soil conditions. Previous studies conducted by the government and the local authorities reveal that majority of the existing building stock does not comply with the requirements of the current seismic code. Hence, there is a need for the vulnerability assessment of the building stock in urban scale. Since the preliminary assessment and detailed evaluation of each building requires rigorous engineering work and time, a well-planned prioritization for seismic vulnerability assessment over the megacity should be conducted by the research teams, the government and the local authorities. In this study a rapid seismic assessment method has been employed on the buildings located on a selected territory of Istanbul. The method is easy to apply and could generate important information about the seismic vulnerability of the buildings on the selected area especially for the local authorities. Following conclusions could be driven by performing seismic assessment method;
1. Among the surveyed region nearly 90% of the buildings have poor and/or moderate construction quality. The pounding effects could be faced at 76% of the selected buildings. On the other hand nearly 70% of the building stock does not suffer from the short column effect. 2. The global situation of the building stock could be represented by the moderate priority
level of 60<PS≤100. Only 10% of the building stocks fall into the highest priority level. 3. The buildings with 2, 3 and 4-storey heights are almost the 21% of selected building stock with the PS range of PS>100, where the buildings having 5 to 6 storey heights stands within the PS range of 30<PS≤60. The PS values decreases as the buildings gets higher.
4. The ratio of buildings with the highest priority level (0≤PS≤30) suffers from the poor construction quality, soft story irregularity and the heavy overhang parameter. However, the topographic effect is the least efficient parameter which falls in the same range of priority.
5. Pounding effect is the most frequent parameter which appears in 60-80% of the building stock. The effect of soft story decreases by the decrease of the priority range. The number of buildings with topographic effect is almost negligible whereas heavy overhang is a common characteristic for all of the buildings at any priority level.
6. The selected building stock located in Esenler could represent typical vulnerable structures in İstanbul which were not newly constructed. Thus, the conclusions derived from this study is curical to have a good approximation about the global conditions of the mid-rise reinforced concrete structures of İstanbul.
7. The current study which is a field application of one of the fast seismic assesment methods could be applied to larger areas where there are mid-rise reinforced concrete structures. The method could be applied to predict a global seismic risk in city or in region scale. Performing of this method could be a good preparation for more detailed seismic risk assesment studies in future.
4. References
FEMA P-154, Rapid Visual Screening of Buildings for Potential Seismic Hazards: A Handbook, January 2015.
Sozen, M. A. and A. F. Hassan, 1997. Seismic Vulnerability Assessment of Low-Rise Buildings in Regions
Seismic Vulnarability Assesment of Reinforced Concrete Buildings Located in Esenler District of İstanbul, Ozkaynak ve Özbay.
294
with Infrequent Earthquakes. ACI Structural Journal,
94(1), 31-39.
Gulkan, P. and M. A. Sozen, 1999. Procedure for Determining Seismic Vulnerability of Building Structures. ACI Structural Journal, 96(3), 336-342. Ozcebe, G., Yucemen, M. S., Aydogan, V., and A. Yakut,
2003. Preliminary Seismic Vulnerability
assessment of Existing Reinforced Concrete Buildings in Turkey- Part I: Statistical Model Based on Structural Characteristics, Seismic Assessment and Rehabilitation of Existing Buildings, NATO Science Series IV/29, 29-42.
Yakut, A., Aydogan, V., Ozcebe, G and M. S. Yucemen, 2003. Preliminary Seismic Vulnerability
Assessment of Existing Reinforced Concrete Buildings in Turkey -Part II: Inclusion of Site Characteristics, Seismic Assessment and Rehabilitation of Existing Buildings, NATO Science Series IV/29, 43-58
Sucuoglu, H. and U. Yazgan, 2003. Simple Survey Procedures for Seismic Risk Assessment in: Urban Building Stocks, Seismic Assessment and Rehabilitation of Existing Buildings, NATO Science Series IV/29, 97-118.
Japan International Cooperation Agency (JICA) Istanbul Metropolitan Municipality (IMM) 2002. The Study on A Disaster Prevention / Mitigation Basic Plan in Istanbul including Seismic Microzonation in the Republic of Turkey, Final Report.
Ozcebe G, Sucuoglu H, Yucemen Ms, Yakut A and Kubin J. 2006. Seismic Risk Assessment of Existing Building Stock in Istanbul – A Pilot Application In Zeytinburnu District. 8th National Conference on Earthquake Engineering. Earthquake Engineering
Research Institute, San Francisco.
Istanbul Metropolitan Municipality (2003), Earthquake Master Plan for Istanbul, Istanbul.
M. R. Sadat, M. S. Huq, M. A. 2010. Ansary, Seismic vulnerability assessment of buildings of Dhaka city.
Journal of Civil Engineering (IEB), 38 (2), 159-172.
A. Sarraz, M.K.A. Debesh and C. Das. 2015. Seismic Vulnerability Assessment of Existing Building
Stocks at Chandgaon in Chittagong City, Bangladesh.
American Journal of Civil Engineering. 3(1), 1-8.
M.J. Alam, A.R. Khan and A. Paul. 2008. Seismic Vulnerability Assessment of Existing RC Buildings in GIS Environment. Online Proc. of 14th World Conference on Earthquake Engineering (WCEE),
Beijing, China.
E. Işık, 2013. Bitlis İli Yapı Stoğunun Birinci Kademe (Sokak Tarama Yöntemi İle) Değerlendirilmesi, Süleyman
Demirel Üniversitesi Fen Bilimleri Enstitüsü Dergisi, 17(1), 173-178.
U. Albayrak, M. Canbaz, G. Albayrak. 2015. Rapid seismic risk assessment method for existing building stock in urban areas. International Conference on Sustainable Design, Engineering and Construction,
Procedia Engineering 118, 242 – 1249.
H. Tischer, McClure, G. and Mitchell, D. 2012. Development of a seismic vulnerability assessment method for schools in Eastern Canada. Proceedings of
the 15th World Conference on Earthquake
Engineering (15WCEE), Lisbon, Portugal, September