arXiv:1209.6199v2 [hep-ex] 29 Sep 2012
Determination of the number of ψ
′events at BESIII
M. Ablikim1 , M. N. Achasov5 , O. Albayrak3 , D. J. Ambrose39 , F. F. An1 , Q. An40 , J. Z. Bai1 , Y. Ban27 , J. Becker2 ,
J. V. Bennett17, M. Bertani18A, J. M. Bian38, E. Boger20,a, O. Bondarenko21, I. Boyko20, R. A. Briere3, V. Bytev20,
X. Cai1, O. Cakir35A, A. Calcaterra18A, G. F. Cao1, S. A. Cetin35B, J. F. Chang1, G. Chelkov20,a, G. Chen1,
H. S. Chen1, J. C. Chen1, M. L. Chen1, S. J. Chen25, X. Chen27, Y. B. Chen1, H. P. Cheng14, Y. P. Chu1,
D. Cronin-Hennessy38 , H. L. Dai1 , J. P. Dai1 , D. Dedovich20 , Z. Y. Deng1 , A. Denig19 , I. Denysenko20,b,
M. Destefanis43A,43C, W. M. Ding29, Y. Ding23, L. Y. Dong1, M. Y. Dong1, S. X. Du46, J. Fang1, S. S. Fang1,
L. Fava43B,43C, F. Feldbauer2, C. Q. Feng40, R. B. Ferroli18A, C. D. Fu1, J. L. Fu25, Y. Gao34, C. Geng40,
K. Goetzen7 , W. X. Gong1 , W. Gradl19 , M. Greco43A,43C, M. H. Gu1 , Y. T. Gu9 , Y. H. Guan6 , A. Q. Guo26 ,
L. B. Guo24, Y. P. Guo26, Y. L. Han1, F. A. Harris37, K. L. He1, M. He1, Z. Y. He26, T. Held2, Y. K. Heng1,
Z. L. Hou1, H. M. Hu1, J. F. Hu36, T. Hu1, G. M. Huang15, G. S. Huang40, J. S. Huang12, X. T. Huang29,
Y. P. Huang1 , T. Hussain42 , C. S. Ji40 , Q. Ji1 , Q. P. Ji26,c, X. B. Ji1 , X. L. Ji1 , L. L. Jiang1 , X. S. Jiang1 ,
J. B. Jiao29, Z. Jiao14, D. P. Jin1, S. Jin1, F. F. Jing34, N. Kalantar-Nayestanaki21, M. Kavatsyuk21, W. Kuehn36,
W. Lai1, J. S. Lange36, C. H. Li1, Cheng Li40, Cui Li40, D. M. Li46, F. Li1, G. Li1, H. B. Li1, J. C. Li1, K. Li10,
Lei Li1 , Q. J. Li1 , S. L. Li1 , W. D. Li1 , W. G. Li1 , X. L. Li29 , X. N. Li1 , X. Q. Li26 , X. R. Li28 , Z. B. Li33 ,
H. Liang40, Y. F. Liang31, Y. T. Liang36, G. R. Liao34, X. T. Liao1, B. J. Liu1, C. L. Liu3, C. X. Liu1, C. Y. Liu1,
F. H. Liu30, Fang Liu1, Feng Liu15, H. Liu1, H. H. Liu13, H. M. Liu1, H. W. Liu1, J. P. Liu44, K. Y. Liu23, Kai Liu6,
P. L. Liu29 , Q. Liu6 , S. B. Liu40 , X. Liu22 , Y. B. Liu26 , Z. A. Liu1 , Zhiqiang Liu1 , Zhiqing Liu1 , H. Loehner21 ,
G. R. Lu12, H. J. Lu14, J. G. Lu1, Q. W. Lu30, X. R. Lu6, Y. P. Lu1, C. L. Luo24, M. X. Luo45, T. Luo37,
X. L. Luo1, M. Lv1, C. L. Ma6, F. C. Ma23, H. L. Ma1, Q. M. Ma1, S. Ma1, T. Ma1, X. Y. Ma1, Y. Ma11,
F. E. Maas11
, M. Maggiora43A,43C, Q. A. Malik42
, Y. J. Mao27
, Z. P. Mao1
, J. G. Messchendorp21
, J. Min1
,
T. J. Min1, R. E. Mitchell17, X. H. Mo1, C. Morales Morales11, C. Motzko2, N. Yu. Muchnoi5, H. Muramatsu39,
Y. Nefedov20, C. Nicholson6, I. B. Nikolaev5, Z. Ning1, S. L. Olsen28, Q. Ouyang1, S. Pacetti18B, J. W. Park28,
M. Pelizaeus2 , H. P. Peng40 , K. Peters7 , J. L. Ping24 , R. G. Ping1 , R. Poling38 , E. Prencipe19 , M. Qi25 , S. Qian1 ,
C. F. Qiao6, X. S. Qin1, Y. Qin27, Z. H. Qin1, J. F. Qiu1, K. H. Rashid42, G. Rong1, X. D. Ruan9, A. Sarantsev20,d,
B. D. Schaefer17, J. Schulze2, M. Shao40, C. P. Shen37,e, X. Y. Shen1, H. Y. Sheng1, M. R. Shepherd17, X. Y. Song1,
S. Spataro43A,43C, B. Spruck36, D. H. Sun1, G. X. Sun1, J. F. Sun12, S. S. Sun1, Y. J. Sun40, Y. Z. Sun1, Z. J. Sun1,
Z. T. Sun40 , C. J. Tang31 , X. Tang1 , I. Tapan35C, E. H. Thorndike39 , D. Toth38 , M. Ullrich36 , G. S. Varner37 ,
B. Wang9, B. Q. Wang27, D. Wang27, D. Y. Wang27, K. Wang1, L. L. Wang1, L. S. Wang1, M. Wang29, P. Wang1,
P. L. Wang1, Q. Wang1, Q. J. Wang1, S. G. Wang27, X. L. Wang40, Y. D. Wang40, Y. F. Wang1, Y. Q. Wang29,
Z. Wang1 , Z. G. Wang1 , Z. Y. Wang1 , D. H. Wei8 , J. B. Wei27 , P. Weidenkaff19 , Q. G. Wen40 , S. P. Wen1 ,
M. Werner36, U. Wiedner2, L. H. Wu1, N. Wu1, S. X. Wu40, W. Wu26, Z. Wu1, L. G. Xia34, Z. J. Xiao24,
Y. G. Xie1, Q. L. Xiu1, G. F. Xu1, G. M. Xu27, H. Xu1, Q. J. Xu10, X. P. Xu32, Z. R. Xu40, F. Xue15, Z. Xue1,
L. Yan40 , W. B. Yan40 , Y. H. Yan16 , H. X. Yang1 , Y. Yang15 , Y. X. Yang8 , H. Ye1 , M. Ye1 , M. H. Ye4 , B. X. Yu1 ,
C. X. Yu26, H. W. Yu27, J. S. Yu22, S. P. Yu29, C. Z. Yuan1, Y. Yuan1, A. A. Zafar42, A. Zallo18A, Y. Zeng16,
B. X. Zhang1, B. Y. Zhang1, C. Zhang25, C. C. Zhang1, D. H. Zhang1, H. H. Zhang33, H. Y. Zhang1, J. Q. Zhang1,
J. W. Zhang1 , J. Y. Zhang1 , J. Z. Zhang1 , S. H. Zhang1 , X. J. Zhang1 , X. Y. Zhang29 , Y. Zhang1 , Y. H. Zhang1 ,
Y. S. Zhang9, Z. P. Zhang40, Z. Y. Zhang44, G. Zhao1, H. S. Zhao1, J. W. Zhao1, K. X. Zhao24, Lei Zhao40,
Ling Zhao1, M. G. Zhao26, Q. Zhao1, Q. Z. Zhao9,f, S. J. Zhao46, T. C. Zhao1, X. H. Zhao25, Y. B. Zhao1,
Z. G. Zhao40 , A. Zhemchugov20,a, B. Zheng41 , J. P. Zheng1 , Y. H. Zheng6 , B. Zhong1 , J. Zhong2 , Z. Zhong9,f,
L. Zhou1, X. K. Zhou6, X. R. Zhou40, C. Zhu1, K. Zhu1, K. J. Zhu1, S. H. Zhu1, X. L. Zhu34, Y. C. Zhu40,
Y. M. Zhu26, Y. S. Zhu1, Z. A. Zhu1, J. Zhuang1, B. S. Zou1, J. H. Zou1
(BESIII Collaboration)
1 Institute of High Energy Physics, Beijing 100049, P. R. China
2 Bochum Ruhr-University, 44780 Bochum, Germany
3
Carnegie Mellon University, Pittsburgh, PA 15213, USA
4 China Center of Advanced Science and Technology, Beijing 100190, P. R. China
5 G.I. Budker Institute of Nuclear Physics SB RAS (BINP), Novosibirsk 630090, Russia
6
Graduate University of Chinese Academy of Sciences, Beijing 100049, P. R. China
7 GSI Helmholtzcentre for Heavy Ion Research GmbH, D-64291 Darmstadt, Germany
9 GuangXi University, Nanning 530004,P.R.China 10
Hangzhou Normal University, Hangzhou 310036, P. R. China
11 Helmholtz Institute Mainz, J.J. Becherweg 45,D 55099 Mainz,Germany
12 Henan Normal University, Xinxiang 453007, P. R. China
13
Henan University of Science and Technology, Luoyang 471003, P. R. China
14 Huangshan College, Huangshan 245000, P. R. China
15 Huazhong Normal University, Wuhan 430079, P. R. China
16
Hunan University, Changsha 410082, P. R. China
17 Indiana University, Bloomington, Indiana 47405, USA
18 (A)INFN Laboratori Nazionali di Frascati, Frascati, Italy; (B)INFN and University of Perugia, I-06100, Perugia,
Italy
19 Johannes Gutenberg University of Mainz, Johann-Joachim-Becher-Weg 45, 55099 Mainz, Germany
20 Joint Institute for Nuclear Research, 141980 Dubna, Russia
21
KVI/University of Groningen, 9747 AA Groningen, The Netherlands
22 Lanzhou University, Lanzhou 730000, P. R. China
23 Liaoning University, Shenyang 110036, P. R. China
24
Nanjing Normal University, Nanjing 210046, P. R. China
25 Nanjing University, Nanjing 210093, P. R. China
26 Nankai University, Tianjin 300071, P. R. China
27 Peking University, Beijing 100871, P. R. China
28
Seoul National University, Seoul, 151-747 Korea
29 Shandong University, Jinan 250100, P. R. China
30 Shanxi University, Taiyuan 030006, P. R. China
31
Sichuan University, Chengdu 610064, P. R. China
32 Soochow University, Suzhou 215006, China
33 Sun Yat-Sen University, Guangzhou 510275, P. R. China
34 Tsinghua University, Beijing 100084, P. R. China
35 (A)Ankara University, Ankara, Turkey; (B)Dogus University, Istanbul, Turkey; (C)Uludag University, Bursa,
Turkey
36
Universitaet Giessen, 35392 Giessen, Germany
37 University of Hawaii, Honolulu, Hawaii 96822, USA
38 University of Minnesota, Minneapolis, MN 55455, USA
39
University of Rochester, Rochester, New York 14627, USA
40 University of Science and Technology of China, Hefei 230026, P. R. China
41 University of South China, Hengyang 421001, P. R. China
42
University of the Punjab, Lahore-54590, Pakistan
43 (A)University of Turin, Turin, Italy; (B)University of Eastern Piedmont, Alessandria, Italy; (C)INFN, Turin,
Italy
44
Wuhan University, Wuhan 430072, P. R. China
45 Zhejiang University, Hangzhou 310027, P. R. China
46 Zhengzhou University, Zhengzhou 450001, P. R. China
a also at the Moscow Institute of Physics and Technology, Moscow, Russia
b on leave from the Bogolyubov Institute for Theoretical Physics, Kiev, Ukraine
c Nankai University, Tianjin,300071,China
d also at the PNPI, Gatchina, Russia
e now at Nagoya University, Nagoya, Japan
f Guangxi University,Nanning,530004,China
The number of ψ′events accumulated by the BESIII experiment from March 3 through April 14,
2009, is determined by counting inclusive hadronic events. The result is 106.41×(1.00±0.81%)×106
. The error is systematic only; the statistical error is negligible.
I. INTRODUCTION
In 2009, the world’s largest ψ′sample to date was
col-lected at BESIII, allowing more extensive and precise
studies of ψ′ decays. The number of ψ′ events, N
ψ′, is
the direct decays of the ψ′, as well as its daughters, χ cJ,
hc, and ηc. The precision of Nψ′ will directly affect the
precision of all these measurements.
In this paper, we determine Nψ′ with ψ′ →
inclusive hadrons, whose branching ratio is known rather precisely, (97.85 ± 0.13)% [1]. Also, a large
off-resonance continuum data sample at Ecm = 3.650 GeV
with an integrated luminosity of 44 pb−1 was collected.
These events are very similar to the continuum
back-ground under the ψ′ peak. Since the energy difference is
very small, we can use the off-resonance data to estimate this background.
BEPCII is a double-ring e+
e− collider designed to
provide e+
e− interactions with a peak luminosity of
1033 cm−2s−1 at a beam current of 0.93 A. The
cylin-drical core of the BESIII detector consists of a helium-based main drift chamber (MDC), a plastic scintillator time-of-flight system (TOF), and a CsI(Tl) electromag-netic calorimeter (EMC), which are all enclosed in a su-perconducting solenoidal magnet providing a 1.0 T mag-netic field. The solenoid is supported by an octagonal flux-return yoke with resistive plate counter muon iden-tifier modules interleaved with steel. The acceptance for charged particles and photons is 93% over 4π stereo an-gle, and the charged-particle momentum and photon en-ergy resolutions at 1 GeV are 0.5% and 2.5%, respec-tively.
The BESIII detector is modeled with a Monte Carlo
(MC) simulation based on geant4 [2, 3]. For the
sim-ulation of inclusive ψ′ decays, we use the evtgen
gen-erator [4]. Known ψ′ decay channels are generated
ac-cording to branching ratios in the PDG [1]; the remain-ing unknown decays are generated by the lundcharm model [5].
II. EVENT SELECTION
There are many types of events in the data collected
at the ψ′ energy point, including ψ′→ hadrons and
lep-ton pairs (e+e−, µ+µ−, and τ+τ−), radiative returns to
the J/ψ, and J/ψ decays from the extended tail of the J/ψ Breit-Wigner distribution. In addition, there are non-resonance (QED) processes, which make up the
con-tinuum background, including e+e− → γ∗ → hadrons,
lepton pairs, and e+e− → e+e−+X (X=hadrons, lepton
pairs). Non-collision events include cosmic rays, beam-associated background, and electronic noise. The signal
channel is the process ψ′→ hadrons. The data collected
at the off-resonance energy include all of the above except
ψ′ → hadrons and lepton pairs.
Event selection includes track level selection and event level selection. At the track level, good charged tracks are required to pass within 1 cm of the beam line in the plane perpendicular to the beam and within ±15 cm from the Interaction Point (IP) in the beam direction. Photon candidate showers reconstructed from the EMC barrel region (| cos θ| < 0.8) must have a minimum energy of 25
MeV, while those in the end-caps (0.86 < | cos θ| < 0.92) must have at least 50 MeV. The showers in the angular range between the barrel and end-cap are poorly recon-structed and excluded from the analysis. Requirements on the EMC cluster timing are applied to suppress elec-tronic noise and energy deposits unrelated to the event.
At the event level, at least one good charged track is required. If the number of good charged tracks is larger
than 2, i.e. Ngood> 2, no additional selection is needed.
If Ngood = 2, where the Bhabha and dimuon events are
dominant backgrounds, the momentum of each track is required to be less than 1.7 GeV/c, and the opening an-gle between the two tracks is required to be less than
176◦ to suppress these backgrounds. Figures 1 and 2
show scatter plots of the momentum of one track ver-sus the momentum of the second track for MC simulated Bhabha events and inclusive MC events with two charged tracks, respectively. Figures 3 and 4 show the open-ing angle distributions of MC simulated Bhabha events and inclusive MC events with two charged tracks,
re-spectively. In addition, Evisible/Ecm > 0.4 is required
to suppress low energy background (LEB), comprised
mostly of e+e− → e+e− + X and double ISR events
(e+
e−→ γ
ISRγISRX). Here, Evisible denotes the visible
energy which is defined as the energy sum of all charged tracks (calculated with the track momentum and
assum-ing a π± mass) and neutral showers, and E
cm denotes
the center-of-mass energy. Figure 5 shows the Evisible
distribution for data and inclusive MC events with two charged tracks. The excess in data at low energy is from the LEB.
If Ngood = 1, at least two additional photons are
re-quired in an event. From all photon pair combinations,
the combination whose invariant mass, Mγγ, is closest to
the π0mass is selected, and |M
γγ−Mπ0| < 0.015 GeV/c2
is required. Evisible/Ecm > 0.4 is also required to
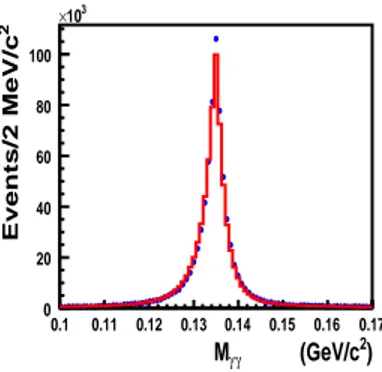
sup-press the LEB. Figure 6 shows the Mγγ distributions in
the π0mass region for data and MC simulation. Figure 7
shows the Evisibledistribution for data and inclusive MC
events. The excess in data at low energy is from LEB.
The average Z-direction vertex for an event is defined as ¯ VZ = NPgood i=1 Vi Z Ngood ,
where VZ is the distance along the beam direction of
the point of closest approach of a track to the IP.
Fig-ure 8 shows the ¯VZ distribution for ψ′ data after the
above selection. Events satisfying | ¯VZ| < 4.0 cm are
taken as signal, while events in the sideband region 6.0
cm< | ¯VZ| < 10.0 cm are taken as non-collision
(GeV/c) 1 P 0 0.2 0.4 0.6 0.8 1 1.2 1.4 1.6 1.8 2 (GeV/c) 2 P 0 0.2 0.4 0.6 0.8 1 1.2 1.4 1.6 1.8 2
FIG. 1. The distribution of P2 versus P1 from MC simulated
Bhabha events. The horizontal and vertical lines show the
selection requirements to remove Bhabha and e+
e−→µ+ µ− events. (GeV/c) 1 P 0 0.2 0.4 0.6 0.8 1 1.2 1.4 1.6 1.8 2 (GeV/c) 2 P 0 0.2 0.4 0.6 0.8 1 1.2 1.4 1.6 1.8 2
FIG. 2. The distribution of P2 versus P1 from inclusive MC
events with two charged tracks. The horizontal and vertical lines show the selection requirements to remove Bhabha and
e+e−→µ+µ−events.
(Nobs.) is determined by
Nobs.= N
signal− Nsideband. (1)
Another method to determine the number of hadronic events (described below) is to fit the average Z-vertex with a double Gaussian to describe the signal and a poly-nomial to describe the non-collision events.
III. BACKGROUND SUBTRACTION
In principle, the number of QED events can be esti-mated from:
NQED = L · σ · ǫ, (2)
where L is the luminosity, and σ and ǫ are the cross-section and efficiency, respectively. σ is usually obtained from theoretical prediction, and ǫ is determined from MC simulation.
However in this analysis, we use the large sample of off-resonance data collected at 3.65 GeV to estimate the
(degree) θ 160 162 164 166 168 170 172 174 176 178 180 Events/0.2 degree 0 20 40 60 80 100 120 140 3 10 ×
FIG. 3. The distribution of angle between tracks for MC simu-lated Bhabha events. The arrow shows the angle requirement used to remove most Bhabha events.
(degree) θ 160 162 164 166 168 170 172 174 176 178 180 Events/0.2 degree 0 500 1000 1500 2000 2500 3000
FIG. 4. The distribution of angle between tracks for inclusive MC events with two charged tracks. The arrow shows the angle requirement used to remove most Bhabha events.
continuum background. The events remaining, after im-posing the same selection criteria in the off-resonance
data, also form a peak in the ¯VZ distribution, as shown
in Figure 9. The same signal and sideband regions are
used as for the ψ′data to determine the collision and non
collision events. With this method, the continuum back-ground subtraction is independent of MC simulation, and little systematic bias is introduced.
cm /E visible E 0 0.1 0.2 0.3 0.4 0.5 0.6 0.7 0.8 Events 0 1000 2000 3000 4000 5000
FIG. 5. The Evisible/Ecmdistribution for Ngood= 2 events.
Dots with error bars are data; the histogram is MC
) 2 (GeV/c γ γ M 0.1 0.11 0.12 0.13 0.14 0.15 0.16 0.17 2 Events/2 MeV/c 0 20 40 60 80 100 3 10 ×
FIG. 6. The γγ invariant mass (Mγγ) distribution in the π0
mass region for Ngood = 1 events. Dots with error bars are
data; the histogram is MC simulation.
cm /E visible E 0 0.1 0.2 0.3 0.4 0.5 0.6 0.7 0.8 Events 0 200 400 600 800 1000 1200
FIG. 7. The Evisible/Ecm distribution for Ngood= 1 events.
Dots with error bars are data; the histogram is MC
simula-tion, normalized to Evisible/Ecm> 0.3.
The contributions from radiative returns to J/ψ and J/ψ decays from the extended tail of the Breit-Wigner
are very similar at the ψ′ peak and off-resonance energy
due to the small energy difference. They are estimated to
be 1.11 and 1.03 nb at the ψ′ peak and the off-resonance
energy point, respectively, and according to MC simula-tion, the efficiencies for the known continuum processes
(cm) Z V -10 -8 -6 -4 -2 0 2 4 6 8 10 Events/0.05cm 3 10 4 10 5 10 6 10 (cm) Z V -10 -8 -6 -4 -2 0 2 4 6 8 10 Events/0.05cm 3 10 4 10 5 10 6 10
FIG. 8. The average Z vertex ( ¯VZ) distribution of hadronic
events in ψ′ data. The curves are a double Gaussian to
describe the signal and a polynomial to describe the non-collision events. (cm) Z V -10 -8 -6 -4 -2 0 2 4 6 8 10 Events/0.05cm 3 10 4 10 5 10 (cm) Z V -10 -8 -6 -4 -2 0 2 4 6 8 10 Events/0.05cm 3 10 4 10 5 10
FIG. 9. The average Z vertex ( ¯VZ) distribution of hadronic
events in off-resonance data. The curves are a double Gaus-sian to describe the signal and a polynomial to describe the non-collision events.
at the two energy points are also similar. Therefore, the off-resonance data can be employed to subtract both the continuum QED and J/ψ decay backgrounds using a scaling factor, f , determined from the integrated
lumi-nosity multiplied by a factor of 1/s (s = E2
cm) to account
for the energy dependence of the cross-section:
f = Lψ′
L3.65
· 3.65
2
3.6862 = 3.677, (3)
where, Lψ′ and L3.65 are the integrated luminosities for
ψ′ data and 3.65 GeV data, respectively.
The luminosities at the two different energy points
are determined from e+e− → γγ events using the same
track and event level selection criteria. At the track
level, no good charged tracks and at least two showers are required. The energy for the most energetic shower
should be higher than 0.7 × Ebeam while the second
most energetic shower should be larger than 0.4 × Ebeam,
where Ebeam is the beam energy. At the event level,
the two most energetic showers in the ψ′ rest frame
should be back to back, and their phi angles must satisfy 178◦< |φ
1− φ2| < 182.0◦. The luminosity systematic
er-rors nearly cancel in calculating the scaling factor due to small energy difference between these two energy points. The f factor can also be obtained using luminosities de-termined with Bhabha events. It is found to be 3.685.
Also of concern is the LEB remaining in the ψ′ events
after the Evisible/Ecm requirement. In order to test if
the continuum background subtraction is also valid for these events, candidate LEB events are selected by
re-quiring Evisible/Ecm < 0.35 where there are few QED
events expected. Figures 10 and 11 show the
compari-son of Evisible/Ecmbetween peak and off-resonance data
for Ngood = 1 and Ngood = 2 events, respectively. The
agreement between the two energy points is good for these events. The ratios of the numbers of peak and
off-resonance events for Ngood= 1 and Ngood= 2 are 3.3752
and 3.652, respectively. Compared with the scaling fac-tor obtained from luminosity normalization in Eq.( 3),
cm /E visible E 0.05 0.1 0.15 0.2 0.25 0.3 0.35 Events 0 5000 10000 15000 20000 25000 30000 35000
FIG. 10. Comparison of LEB events between ψ′ peak and
off-resonance data for Ngood= 1 events. Dots with error bars
are ψ′data, and the histogram is off-resonance data.
cm /E visible E 0.05 0.1 0.15 0.2 0.25 0.3 0.35 Events 0 20 40 60 80 100 3 10 ×
FIG. 11. Comparison of LEB events between ψ′peak and
off-resonance for Ngood= 2 events. Dots with error bars denote
ψ′data, and the histogram denotes off-resonance data.
there is almost no difference for Ngood = 2 events. These
differences will be taken as systematic errors.
The small numbers of events from ψ′→ e+e−, µ+µ−,
and τ+
τ− in data that pass our selection do not need
to be explicitly subtracted since ψ′ → lepton events are
included in the inclusive MC and those passing the se-lection criteria will contribute to the MC determined ef-ficiency, so that their contribution cancels.
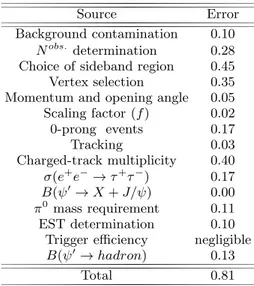
Table I shows the number of observed hadronic events
for different multiplicity requirements for ψ′ and
off-resonance data. Figures 12, 13, and 14 show the cos θ,
Evisible, and charged-track multiplicity distributions
af-ter subtracting background.
IV. NUMERICAL RESULT
The number of ψ′ events is determined from
Nψ′ =
Nobs.
peak− f · Nof f −resonanceobs.
ǫ , (4)
where, Nobs.
peak is the number of hadronic events observed
at the ψ′peak from Eq. (1), Nobs.
of f −resonanceis the number
of hadronic events observed at the off-resonance energy
TABLE I. Nobs.for peak and off-resonance data (×106
), and
the detection efficiency for inclusive ψ′ decay events
deter-mined with 106 × 106 ψ′→ inclusive MC events.
Ngood≥1 Ngood≥2 Ngood≥3 Ngood≥4
ψ′ data 106.928 102.791 81.158 63.063 off-resonance data 2.192 1.98 0.704 0.433 ǫ(%) 92.912 89.860 74.624 58.188 θ cos -1 -0.8 -0.6 -0.4 -0.2 -0 0.2 0.4 0.6 0.8 1 Events 0 200 400 600 800 1000 1200 1400 1600 3 10 ×
FIG. 12. The cos θ distribution for charged tracks. Dots with error bars are data; the histogram is MC simulation.
cm /E visible E 0 0.2 0.4 0.6 0.8 1 1.2 Events 0 100 200 300 400 500 600 700 3 10 ×
FIG. 13. The visible energy distribution. Dots with error bars are data; the histogram is MC simulation.
chrg
N
2 4 6 8 10 12 Events 0 5 10 15 20 25 30 6 10 ×FIG. 14. The charged-track multiplicity distribution. Dots with error bars are data; the histogram is MC simulation.
TABLE II. Nψ′(×106) for different charged-track multiplicity requirements.
Ngood≥1 Ngood≥2 Ngood≥3 Ngood≥4
Nψ′ 106.414 106.279 105.289 105.643
point, Ecm= 3.650 GeV, with the same selection criteria
as those for peak data, and ǫ is the selection efficiency
obtained from the inclusive ψ′MC sample, the branching
fraction of ψ′ → inclusive hadron is included in the
efficiency. The relevant numbers are listed in Table I for
different Ngood selection requirements. The factor f is
the scaling factor which has been introduced in Eq. (2). With these numbers, we obtain the numerical result for
Nψ′ listed in Table II for different choices of Ngood. We
take the result for Ngood ≥ 1 as the central value of our
final result.
V. SYSTEMATIC UNCERTAINTIES
The systematic uncertainties include the uncertainties
caused by tracking, the event start time (T0), trigger
ef-ficiency, background contamination, the selection of the signal and sideband regions, etc.
A. Tracking
Generally, the tracking efficiency for MC events is higher than that of data according to various studies [7]. Assuming the average efficiency difference between data and MC is 1% per track, the effect can be measured by randomly tossing out 1% of MC simulated tracks. Only a
difference of 0.03% on Nψ′ is found for Ngood≥ 1 events
with and without this tracking efficiency change; Nψ′ is
not sensitive to the tracking efficiency.
B. Charged-track multiplicity
Figure 14 shows that the MC does not simulate the charged-track multiplicity very well. The error due to charged-track multiplicity simulation can be estimated by an unfolding method, which is described as follows. The generated true charged multiplicity in MC simula-tion is even, i.e., 0, 2, 4, 6, 8, · · · . The observed MC multiplicity distribution is obtained after simulation and event selection. For example, if the generated true mul-tiplicity is 4, the observed multiplicities are 0, 1, 2, 3, or 4 with different probabilities. Therefore, an efficiency
matrix, ǫij, which describes the efficiency of an event
gen-erated with j charged tracks to be reconstructed with i charged tracks, is obtained from MC simulation. The dis-tribution of the number of observed charged-track events
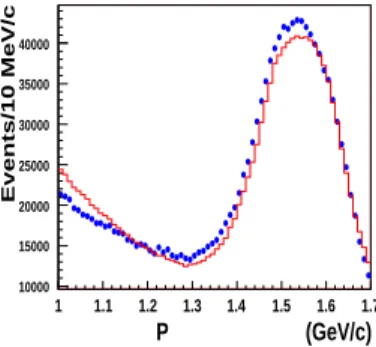
P (GeV/c) 1 1.1 1.2 1.3 1.4 1.5 1.6 1.7 Events/10 MeV/c 10000 15000 20000 25000 30000 35000 40000
FIG. 15. The distribution of total momentum for Ngood= 2
events. Dots with error bars are data; the histogram is MC simulation.
in data, Nobs.
i , is known. The true multiplicity
distribu-tion in data can be estimated from the observed multi-plicity distribution in data and the efficiency matrix by
minimizing the χ2. The χ2 is defined as
χ2 = 10 X i=1 (Nobs. i − 10 P j=0 ǫij· Nj)2 Nobs. i , (5)
where the Nj (j = 0, 2, 4, 6, 8, 10) describe the true
multiplicity distribution in data and are taken as floating parameters in the fit. The simulation is only done up to a true multiplicity of 10, since there are few events at high multiplicity. The total true number of events
in data can be obtained by summing all fitted Nj; it is
105.96 × 10⁶ which is lower than the nominal value by
0.4%. We take this difference as the error due to the charged-track multiplicity distribution.
C. Momentum and opening angle
For Ngood = 2 events, momentum and opening
an-gle requirements are used to remove the huge number of Bhabha events. When the momentum requirement is changed from P < 1.7 GeV/c to P < 1.55 GeV/c,
the corresponding Nobs. for peak and resonance data,
as well as the efficiency change, but the change in Nψ′
is only 0.05%. When the angle requirement is changed
from θ < 176◦to θ < 160◦, the change in N
ψ′ is 0.01%.
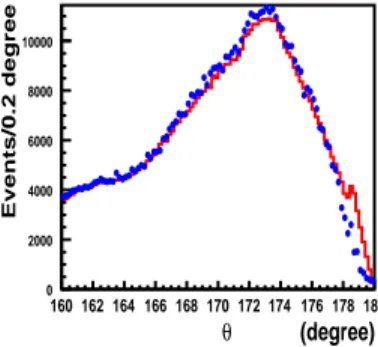
Therefore, the total uncertainty due to momentum and opening angle requirements is 0.05%. Figures 15 and 16 show comparisons between data and MC simulations for momentum and opening angle distributions after back-ground subtraction, respectively.
D. LEB background contamination
Nψ′ is insensitive to the visible energy
(degree) θ 160 162 164 166 168 170 172 174 176 178 180 Events/0.2 degree 0 2000 4000 6000 8000 10000
FIG. 16. The distribution of opening angle between tracks
for Ngood = 2 events. Dots with error bars are data; the
histogram is MC simulation.
Evisible/Ecm > 0.45, and no requirement is only 0.1%.
Conservatively, an error of 0.1% is assigned due to the background contamination.
E. Determination of number of hadronic events
Two methods are used to obtain Nobs.. The first is to
directly count the numbers of events in the signal and
sideband regions; the second method is to fit the ¯VZ
dis-tribution with a double Gaussian for the signal and a polynomial for the background, as shown in Figs. 8 and 9. A difference of 0.28% is found between these two meth-ods which is taken as the error due to the uncertainty
from the Nobs. determination.
F. Vertex limit
When Vr< 1 cm is changed to Vr< 2 cm, Nψ′changes
by 0.35%, while if | ¯VZ| < 10 cm is changed to | ¯VZ| < 15
cm, there is almost no change. Therefore, the difference of 0.35% is taken as the error from the vertex require-ment.
G. Scaling factor
The scaling factor can be obtained for two different
QED processes, e+e− → γγ and e+e− → e+e−. The
corresponding results are 3.677 and 3.685. The
dif-ference on Nψ′ due to the f factor can be calculated
by ∆f · Nobs.
Ngood≥1(3.650 GeV)/Nψ′ = (3.685 − 3.677) ·
3.1808/106.32 = 0.023%. The slight difference indicates the uncertainty caused by the normalization factor is neg-ligibly small.
H. Choice of sideband region
We take | ¯VZ| < 4.0 cm as the signal region and
6 < | ¯VZ| < 10 cm as the sideband region. A
differ-ence of 0.45% in Nψ′ is found by shifting the sideband
region outward by 1.0 cm, which is about 1σ of the ¯VZ
resolution, i.e., the sideband region is changed from 6 cm< | ¯VZ| < 10 cm to 7cm < | ¯VZ| < 11 cm. We take this
difference as the error due to the uncertainty caused by choice of the sideband region.
I. π0 mass requirement
This requirement is only used for Ngood = 1 events.
Nψ′ has a slight change of 0.11% when the mass
win-dow requirement is changed from |Mγγ − Mπ0| < 0.015
GeV/c2 to |M
γγ− Mπ0| < 0.025 GeV/c2; this difference
is taken as the uncertainty due to π0 mass requirement.
J. The cross section of e+e−→τ+τ−
Since the off-resonance energy point is not very far
from τ τ threshold, σ(e+e−→ τ+τ−) does not vary as
1/s between the off-resonance energy and the ψ′ peak,
as other QED processes. The difference between the ob-served and the cross section assuming a 1/s dependence
causes a change of 0.17% in Nψ′. This change is taken
as a systematic error.
K. B(ψ′→X + J/ψ)
The ψ′ MC assumes B(ψ′ → X + J/ψ) ≈ 57% from
the PDG [1], while the CLEO experiment determined a branching ratio of 62% [8]. Using CLEO’s result, a new inclusive MC sample was generated. The corresponding efficiencies are 92.912%, 89.761%, 74.838% and 58.528%
for Ngood≥ 1, 2, 3 and 4, respectively. Compared with
numbers in Table I, the efficiency differences between these two MC samples are negligible.
L. Event start time determination
The Event Start Time (EST) algorithm is used to de-termine the common start time of the recorded tracks in an event. The efficiency of the EST determination affects the resolution of tracks from the tracking
algo-rithm. These efficiencies for different charged tracks,
e, µ, π, K, and p, and photons are studied with dif-ferent control samples for both data and inclusive MC
events, for example, J/ψ → π+
π−π0
, π+
π−p¯p, and
ψ′ → π+
π−J/ψ, J/ψ → l+
l−, etc. All comparisons
in-dicate that the efficiencies of the EST determination are high for both track and event level (> 98%) selection, and
the difference between data and MC simulated events is quite small (∼ 0.1%). We take this difference as the un-certainty caused by the EST determination.
M. Trigger efficiency
The fraction of events with Nngood≥ 2 is about 97%.
The trigger efficiency for these events is close to 100.0% according to a study of the trigger efficiency [9]. For
Ngood= 1 events, an extra π0is required, and the hadron
trigger efficiency for this channel is 98.7% [9]. Since the
fraction of Ngood= 1 events is only about 3%, the
uncer-tainty caused by the trigger is negligible.
N. The missing 0-prong hadronic events
A detailed topology analysis is performed for Ngood=
0 events in the inclusive MC sample. Most of these
events come from known decay channels, such as ψ′ →
X + J/ψ (X = η, π0π0, and π+π−), ψ′ → γχ
cJ, and
ψ′ → e+
e−, µ+
µ−. The fraction of pure neutral events
is less than 1.0%. For the known charged decay modes, the MC simulation works well according to many com-parisons between data and MC simulation in Section 3. To investigate the pure neutral channels, the same se-lection criteria at the track level are used. The criteria
at the event level include Ngood = 0 and Nγ > 3. The
latter requirement is used to suppress e+e− → γγ and
beam-associated background events. The same selection criteria are imposed on the off-resonance data. Figures 17 and 18 show the distribution of total energy in the EMC for data and inclusive MC events. The peaking events correspond to the pure neutral candidates, and the num-ber of events is extracted by fitting. The difference in the number of fitted events between data and inclusive MC events is found to be 17%. Therefore, the uncer-tainty due to the pure neutral events should be less than 17% × 1% = 0.17%, and this is taken as the systematic error on the missing 0-prong events.
O. B(ψ′→hadrons)
The uncertainty of B(ψ′ → hadrons) is very small
according to the PDG [1], 0.13%, which is taken as the
error due to uncertainty of ψ′ decays to hadronic events.
P. Total error
Table III lists all systematic errors. The total sys-tematic error is determined by the quadratic sum of all errors. (GeV) EMC E 2.6 2.8 3 3.2 3.4 3.6 3.8 4 Events/5 MeV 0 1000 2000 3000 4000 5000 6000 (GeV) EMC E 2.6 2.8 3 3.2 3.4 3.6 3.8 4 Events/5 MeV 0 1000 2000 3000 4000 5000 6000
FIG. 17. The distribution of total energy in the EMC with
Ngood= 0 for data. The dot-dashed line denotes the signal
shape of ψ′ → neutral channel, the dashed line denotes
the background shape from QED processes, and the shaded
region is the background shape from ψ′ decay.
(GeV) EMC E 2.6 2.8 3 3.2 3.4 3.6 3.8 4 Events/5 MeV 0 500 1000 1500 2000 2500 3000 (GeV) EMC E 2.6 2.8 3 3.2 3.4 3.6 3.8 4 Events/5 MeV 0 500 1000 1500 2000 2500 3000
FIG. 18. The distribution of total energy in the EMC with
Ngood= 0 for inclusive MC events. The dashed line denotes
the signal shape of ψ′ → neutral channel, and the shaded
region is the background shape from ψ′ decay.
TABLE III. The systematic error (%)
Source Error
Background contamination 0.10
Nobs. determination 0.28
Choice of sideband region 0.45
Vertex selection 0.35
Momentum and opening angle 0.05
Scaling factor (f ) 0.02 0-prong events 0.17 Tracking 0.03 Charged-track multiplicity 0.40 σ(e+ e−→τ+ τ−) 0.17 B(ψ′→X + J/ψ) 0.00 π0 mass requirement 0.11 EST determination 0.10
Trigger efficiency negligible
B(ψ′→hadron) 0.13
VI. SUMMARY
The number of ψ′ events is determined using
ψ′ → hadrons. The large off-resonance data sample at
Ecm= 3.65 GeV is used to estimate the background
un-der the ψ′ peak. The number of ψ′ events taken in 2009
is measured to be (106.41 ± 0.86) × 106, where the error
is systematic only and the statistical error is negligible.
VII. ACKNOWLEDGMENT
The BESIII collaboration thanks the staff of BEPCII and the computing center for their hard efforts. This work is supported in part by the Ministry of Science and Technology of China under Contract No. 2009CB825200; National Natural Science Foundation of China (NSFC)
under Contracts Nos. 10625524, 10821063, 10825524, 10835001, 10935007, 11125525, 10975143, 10979058; Joint Funds of the National Natural Science Founda-tion of China under Contracts Nos. 11079008, 11179007; the Chinese Academy of Sciences (CAS) Large-Scale Scientific Facility Program; CAS under Contracts Nos. KJCX2-YW-N29, KJCX2-YW-N45; 100 Talents Pro-gram of CAS; Istituto Nazionale di Fisica Nucleare, Italy; Ministry of Development of Turkey under Con-tract No. DPT2006K-120470; U. S. Department of En-ergy under Contracts Nos. FG02-04ER41291, DE-FG02-91ER40682, DE-FG02-94ER40823; U.S. National Science Foundation; University of Groningen (RuG) and the Helmholtzzentrum fuer Schwerionenforschung GmbH (GSI), Darmstadt; WCU Program of National Research Foundation of Korea under Contract No. R32-2008-000-10155-0.
[1] J. Beringer et al. (Particle Data Group), Phys. Rev. D 86, 010001 (2012).
[2] S. Agostinelli et al. (GEANT4 Collaboration), Nucl. In-strum. Meth. A 506, 250 (2003).
[3] J. Allison et al., IEEE Trans. Nucl. Sci. 53, 270 (2006). [4] R. G. Ping et al., Chinese Physics C 32, 599 (2008). [5] J. C. Chen et al., Phys. Rev. D 70, 011102(R) (2005).
[6] M. Ablikim et al. (BES Collaboration), Phys. Lett. B 677, 239 (2009).
[7] M. Ablikim et al. (BESIII Collaboration), Phys. Lett. B 710, 594 (2012).
[8] H. Mendez et al. (CLEO Collaboration), Phys. Rev. D 78, 011102(R) (2008).