__________________________________________________
1Gaziosmanpasa of Univ. Faculty of Agriculture, Department of Farm Structures and Irrigation-Tokat
Frequency Analysis of Low Flow Series from Çekerek Stream Basin
Kadri YÜREKLİ1 Ahmet KURUNÇ1 Selçuk GÜL1
Geliş Tarihi: 08.10.2004
Abstract: The most true selection probability distribution is important to describe the low flow statistics for the
studies related to drought analysis. The aim of this study is to derive appropriate probability distributions for frequency analysis of 7-day annual low flows at three gauging stations of the Çekerek Stream. The lowest 7-day flow series were constituted from daily flow data for 7-day periods of each year. A minimum 7-day flow is the lowest flow that occurred within a 7-consecutive day period. L-moment technique was used to predict the parameters of the selected distributions. Two goodness of fit indices, including MADI and MSDI, were used to compare the performances of the probability distributions for fitting. According to results, the best performance was obtained for generalized pareto (GPA) distribution. The distributions produced negative values were discarded. The predicted low flows obtained from the distributions that produced positive values (except Log Pearson type three) for empirical probability levels (Gringorten formula) sufficiently represent the actual low flows for probability levels higher than 75%. The statistics having reoccurrence interval of ten years (Q7,10) based on GPA distribution were predicted as 0.29, 1.27 and 2.11 m3/s for gauging stations 1424, 1409 and 1404, respectively.
Key Words: Low flow, probability distribution, L-moment technique, Çekerek Stream
Çekerek Havzası Minimum Akım Serilerinin Frekans Analizi
Öz: Kuraklık analizleri çalışmalarında en uygun olasılık dağılımının seçimi minimum akım istatistikleri açısından
önemlidir. Bu çalışmanın amacı, Çekerek çayındaki üç akım gözlem istasyonunda ölçülen 7-günlük minimum akım serilerinin frekans analizi için uygun olasılık dağılımının çıkarılmasıdır. En düşük günlük akım serileri her yılın 7-günlük periyotları için 7-günlük akım datasından oluşturuldu. 7-7-günlük akım, ardışık 7 7-günlük periyot içinde ölçülen en düşük akımdır. Seçilen olasılık dağılımlarının parametrelerinin tahmininde L-moment tekniği kullanıldı. Olasılık dağılımların performanslarını karşılaştırmak için MADI ve MSDI indisleri kullanıldı. Araştırma sonuçlara göre, en iyi performans genelleştirilmiş pareto (GPA) dağılımıyla elde edildi. Negatif değerler üreten dağılımlar elimine edildi. Gringorten formülünden elde edilen olasılık seviyelerine bağlı olarak pozitif değerler üreten dağılımlardan tahmin edilen akımlar (log pearson 3 hariç) % 75 den daha büyük olasılık seviyeleri için gerçek minimum akım değerlerini oldukça iyi temsil etmektedir. GPA dağılımına bağlı olarak 10 yıllık tekrarlanma aralığına sahip (Q7,10) istatistikler, 1424, 1409 ve 1404 numaralı akım gözlem istasyonları için 0.29, 1.27 ve 2.11 m3/s olarak tahmin edildi.
Anahtar Kelimeler: Minimum akım, olasılık dağılımı, L-moment tekniği, Çekerek Çay Introduction
Information on regional drought characteristics provides critical information for adequate water resources management. Shortage of water known as drought that is defined as a precipitation or streamflow deficit relative to average condition poses a great threat on nature, quality of life and economy. Increasing demands on available water resources lead to conflicts between competing water uses. These conflicts are most pronounced during severe and extensive drought. Incorrect estimation of drought might have serious consequences for ecology and economy (Wilhite and Glantz 1985). Hisdal et al. (2001) claim that information on regional drought characteristics provides critical values for different water based activities, and should be included in strategic short and long-term plans for adequate water resources management. Zelenhasic (2002) mention that the design of municipal or industrial water supply system, hydroelectric plants, navigation development, supplemental irrigation scheme, low flow augmentation system, recreation facilities, and water quality criteria and stream standards are tied to the hydrologic regime of streamflow droughts. Zelenhasic and Salvai (1987) expressed that streamflow drought was related to streamflow deficit measured from a certain
Related to low flow, different critical statistical values are selected according to the scope of study. Fernandez and Salas (1999) stated that the estimation of return periods of hydrological events and the corresponding risks of failure of hydraulic structures that are associated with such events are important aspects in many water resources studies. Riggs (1980) imply that the most widely employed low flow statistic in the United States is Q
reference discharge. Stahl and Demuth (1999) emphasis that temporal variability in annual low flows arise from climate variability.
7,10 which is defined as seven-day, consecutive low flow
with ten year return period. Waltemeyer (2002) used Q4,3,
which is the lowest 4-concecutive-day discharge having reoccurrence interval of three years but that does not necessarily occur every three years, in developing two regression equation to design and administrate water quality standards in New Mexico, USA. Other n-day annual low flows, which are the 1-, 3-, 7-, 14-, 30-, 60-, 90-, 120-, and 183-day flows, commonly are used for low flow frequency analysis. Chang and Boyer (1975)
West Virginia, and by taking into consideration these statistics, watershed and climatic parameters, developed regression relationships to predict the minimum 7-day 10-yr at ungaged Monongahela River basin by regression analysis. Smakhtin and Toulouse (1998) investigated relationships between low flow indices extracted from daily
long-term annual flow duration curve (Q95 and Q75, flows
which is exceed 95 and 75% of the time, respectively, and
T0, the flow the percentage of time with zero-flow
conditions) and other types of low flow characteristics (Q7,10 and Q7,2 mean annual seven-day minimum flow) representing different aspects of low flow regime. Knapp and Myers (1999) updated a model originally developed in 1988 known as ILSAM (The Illinois Streamflow Assessment Model). This model contains 1, 7, 15, 31, 61, and 91 days as low flow duration, associated with 2, 10, 25 and 50 years as reoccurrence intervals.
The studies related to annual n-day lowest flow series show that the most true selection probability distribution is rather important to describe the low flow statistics. Kroll and Vogel (2002) states that the estimation of low flow statistics needs estimation of annual n-day lowest flows, selection of a probability distribution to describe the annual minimums, and estimation of the distribution parameters. However, they expressed that the true distribution of low flows is not known. Yet, the few studies related to fitting probability distribution to low flow series have not arrived at a consensus. Vogel and Kroll (1989) recommended 2- and 3-parameter lognormal (LN2, LN3), log-Pearson Type III (LP3) and 3-parameter Weibull (W3) distributions for annual 7-day lowest flows series of 23 sites in Massachusetts. The Weibull distribution based on the methods of moment, probability weighted moment and maximum likelihood estimation methods was applied to fit the distribution of annual 7-day low flows by Heo et al. (2001). They reported that the results show that the differences in the estimated quantiles based on the three methods are not large, and generally less than 10%. Önöz and Bayazit (1999) examined the fit of various probability distributions to low flows with various duration for 16 European rivers, and selected the Generalized Extreme Value (GEV) distribution for the rivers. Tasker (1987) investigated four various probability distributions to perform frequency analysis of annual 7-day minimum flow series of 20 rivers in Virginia, concluded that the W3 and LP3 are appropriate probability distributions for describing the frequency of the mentioned series. Kroll and Vogel (2002) imply that the United Stated Geological Survey (USGS) commonly uses LP3 distribution for frequency analysis of low flow. Durrans and Tomic (1996) advocate the use of LP3 distribution for frequency analysis of low flow in the state of Alabama. Pearson (1995) studied 1-day annual low flows at over 500 river sites in New Zealand, and he concluded that 2- and 3- parameter distributions provided an adequate fit for frequency analysis of low flows. Vogel and Wilson (1996) recommended P3 distribution for 1-day annual low flows at 1455 river sites across United States.
The objective of this study is to derive appropriate probability distributions, including normal (N), 2-parameter lognormal (LN), 3-parameters lognormal (LN3), logistic (LOG), generalized logistic (GLOG), extreme value type I
(EV), generalized extreme value type I (GEV), generalized pareto (GPA) and log Pearson type three (LP3) distributions, for frequency analysis of 7-day annual low flows at three gauging stations of the Çekerek Stream.
Material and Method
Çekerek Stream watershed is bounded 39º 30' and 40º 45' N latitudes, 35º 15' and 36º 15' E longitudes. This area covers approximately 1,165,440 ha which is about 1.5% of Turkey’s total area. In this study, daily flow data from three gauging stations (1424, 1409 and 1404) managed by Electrical Power Resources Survey and Development Administration (EIE), in Çekerek Stream watershed were used as materials. The approximate locations of the gauging stations of the Çekerek Stream in the Yeşilırmak Basin were shown in Figure 1 (Anonim1970).
The lowest 7-day flow series were constituted from daily flow data for 7-day periods of each year. A minimum day flow is the lowest flow that occurred within a 7-consecutive day period. An attempt was made to select or derive a best probability distribution for analyzing frequency of the lowest 7-day flow series. In the present study N, LN, LN3, LOG, GLOG, EV, GEV, GPA and LP3 distributions were used. The parameters of the distributions taken into consideration in the study were predicted by L-moment technique. Hosking (1990) express that L-moments have a theoretical advantage over conventional moments of being able to characterize a wider range of distributions and, when estimated from a sample, of being more robust to presence of outliers in the data, and parameter estimation with L-moments are more accurate than even the maximum likelihood estimate, in case of small sample.
The Method of L-Moments
L-moments, as defined by Hosking (1990), are linear combinations of probability weighted moments (PWM). Greenwood et al. (1979) summarizes the theory of PWM and defined as
[
]
{
r}
X rE
X
F
(x)
β
=
(1)Where
β
ris the rth order PWM and is thecumulative distribution function (cdf) of X. Hosking and Wallis (1997) defined unbiased sample estimators of PWMs as (b
(x)
F
Xi) and, obtained unbiased sample estimators
of the first four L-moments by PWM sample estimators. Unbiased sample estimates of the PWM for any distribution can be computed from;
[ ]
[ ]
j r n 1 j nr 1 j n r 1 rn
x
b
∑
− = − − −=
(2)Where xj is an ordered set of observations x1 ≤ x2 ≤
x3 ≤ …xn. For any distribution the first four L-moments are
Figure 1. Location of the study area and the gauging stations of the Çekerek Stream in the Yeşilırmak basin λ1 = b1, λ2 = 2b2 - b1, λ3= 6b3 - 6b2 + b1, λ4= 20b4 - 30b3 + 12b2 - b1 (3)
Hosking (1990) defines the L-moment ratios (L-coefficient of variation, L-skewness and L-kurtosis, respectively)
τ2 = λ2/λ1,
τ3 = λ3/λ2,
τ4 = λ4/λ2 (4)
Goodness of fit criteria for comparison of probability distributions : For comparison of the probability distributions of fitting the data used in the study, two indices (mean absolute deviation index and mean square deviation index), which were proposed by Jain and Sing (1987), measured the relative goodness of fit were taken into account. The mean absolute deviation index (MADI) and mean square deviation index (MSDI) can be calculated by
∑
= −=
N 1 İ i i i 1x
z
-x
N
MADI
(5)∑
= −⎟⎟
⎠
⎞
⎜⎜
⎝
⎛
=
N 1 i 2 i i i 1x
z
-x
N
MSDI
(6)Where xi and zi are observed and predicted low flows, respectively, for successive values of empirical probability of exceedence given by the Gringorten plotting position formula. Jain and Singh (1987) claimed that
Gringorten formula ensures to maintain unbiasedness for different distributions. Therefore, they suggest the plotting position formula for comparison of the probability distributions of fitting the data.
Results and Discussion
To derive appropriate probability distributions for frequency analysis of 7-day annual low flows recorded in gauging stations (1424, 1409 and 1404) throughout Çekerek Stream watershed, the first four L-moments values and L-moment ratios were calculated (Table 1).
Hosking, 1990 imply that L-moment ratios of a series
are bounded, the value of these ratios, τr = λr/λ2 for r ≥ 3,
lies between –1 and +1 and, L-coefficient of variation
(L-CV) satisfies 0 < τ2 <1. As it can be seen in Table 1, it
seems that this conditions have been fulfilled.
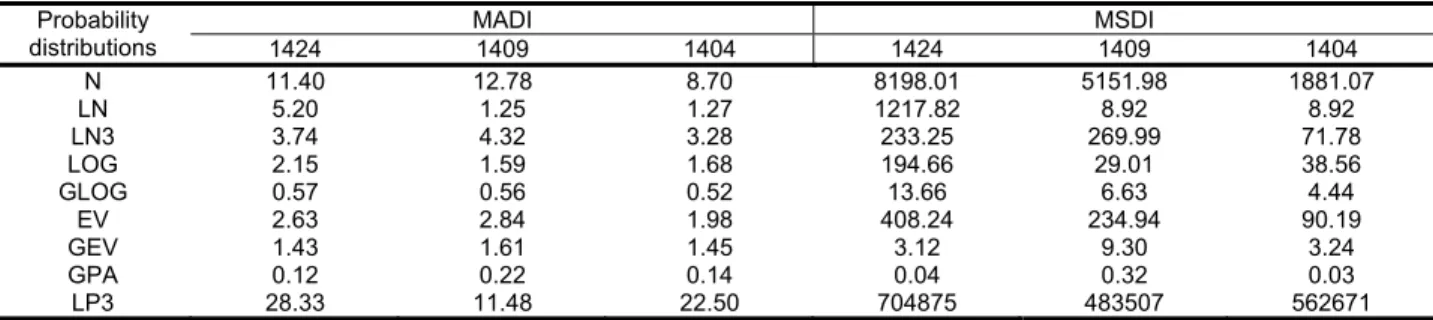
Performance of the normal (N), 2-parameter lognormal (LN), 3-parameter lognormal (LN3), logistic (LOG), generalized logistic (GLOG), extreme value type I (EV), generalized extreme value type I (GEV), generalized pareto (GPA) and log Pearson type three (LP3) probability distributions taken into consideration in the study for fitting the low flow data from the gauging stations were tested by mean absolute deviation index (MADI) and mean square deviation index (MSDI). For this reason, estimation for probability from Gringorten formula of each data point in the increasingly ordered data was made according to the mentioned probability distributions. Performance results based on MADI and MSDI were presented in Table 2. According to the results, the best performance was obtained for GPA distribution. Some of the distributions produced negative values up to the certain probability level. These probability levels were given in the Table 3. The distributions produced negative values were discarded. The remaining distributions (LN3, GPA and
Table 1. L-moments and L-Moment ratios of low flows
L-Moments L-Moment Ratios
Gauging
station λ1 λ2 λ3 λ4 τ2 τ3 τ4
1424 3.50 2.04 0.97 0.50 0.58 0.48 0.25
1409 21.48 12.30 5.96 3.17 0.57 0.48 0.26
1404 15.85 9.10 4.18 2.09 0.57 0.46 0.23
Table 2. The performance of probability distributions used in the study
MADI MSDI Probability distributions 1424 1409 1404 1424 1409 1404 N 11.40 12.78 8.70 8198.01 5151.98 1881.07 LN 5.20 1.25 1.27 1217.82 8.92 8.92 LN3 3.74 4.32 3.28 233.25 269.99 71.78 LOG 2.15 1.59 1.68 194.66 29.01 38.56 GLOG 0.57 0.56 0.52 13.66 6.63 4.44 EV 2.63 2.84 1.98 408.24 234.94 90.19 GEV 1.43 1.61 1.45 3.12 9.30 3.24 GPA 0.12 0.22 0.14 0.04 0.32 0.03 LP3 28.33 11.48 22.50 704875 483507 562671
Table 3. Empirical probability levels of non-exceedence based on gringorten formula for negative values Gauging station Probability distributions 1424 1409 1404 N 0.2924 0.2892 0.2878 LN 0.3992 0.1703 0.1280 EV 0.1343 0.1298 0.1280 GEV 0.0011 0.0013 --- LOG 0.0182 0.0175 0.0171 GLOG 0.0602 0.0630 0.0496
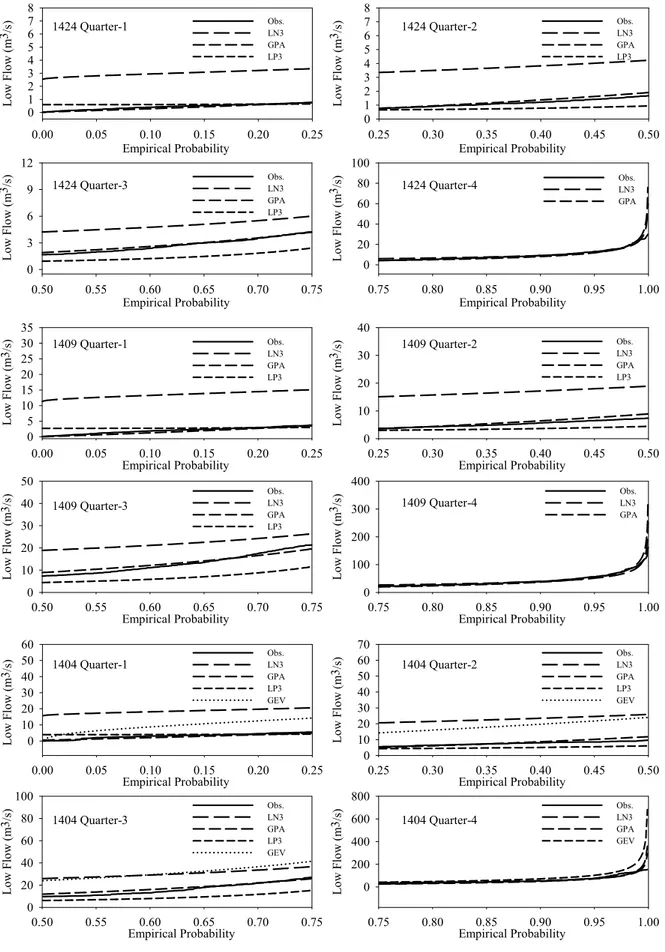
LP3, and GEV for 1404 gauging station) produced positive values for empirical probability levels of non-exceedence by Gringorten formula. Compared to GPA, low flows predicted from the 3-parameter lognormal, log-Pearson Type III and GEV (for 1404 gauging station) distributions were rather deviated from the actual data. To visually show how many the probability distributions produced positive values reflect the actual low flows from thegauging stations, four quarters were constituted for empirical probabilities based on Gringorten formula as quarter-1 (0-25%), quarter-2 (25-50%), quarter-3 (50-75%) and quarter-4 (75-100%). The predicted low flows based on the selected distribution (produced positive values) for probabilities of the quarters and the observed low flows were given in Figure 2. For each station Figure 2 shows that generalized pareto distribution (GPA) present the best
performance for each quarter. But the predicted low flows from the probability distributions (except LP3) sufficiently represent the actual low flows for probabilities of quarter-4. Log-Pearson Type III overestimated for quarter-4, especially for values higher than 90% probability level. Therefore, Pearson Type III for quarter-4 were not presented in Figure 2 since the predicted low flows from this distribution were relatively high compared to the other distributions.
The lowest 7-day discharges having re-occurrence
interval of ten years (Q7,10) based on generalized pareto
(GPA) distribution for gauging stations (1424, 1409 and
1404) were predicted as 0.29, 1.27 and 2.11 m3/s,
1424 Quarter-1 Empirical Probability 0.00 0.05 0.10 0.15 0.20 0.25 Lo w Fl ow ( m 3 /s) 0 1 2 3 4 5 6 7 8 Obs. LN3 GPA LP3 1424 Quarter-2 Empirical Probability 0.25 0.30 0.35 0.40 0.45 0.50 Lo w Fl ow ( m 3 /s) 0 1 2 3 4 5 6 7 8 Obs. LN3 GPA LP3 1424 Quarter-3 Empirical Probability 0.50 0.55 0.60 0.65 0.70 0.75 Lo w Flo w ( m 3 /s) 0 3 6 9 12 Obs. LN3 GPA LP3 1424 Quarter-4 Empirical Probability 0.75 0.80 0.85 0.90 0.95 1.00 Lo w Fl ow ( m 3 /s) 0 20 40 60 80 100 Obs. LN3 GPA 1409 Quarter-1 Empirical Probability 0.00 0.05 0.10 0.15 0.20 0.25 Lo w Fl ow (m 3 /s) 0 5 10 15 20 25 30 35 Obs. LN3 GPA LP3 1409 Quarter-2 Empirical Probability 0.25 0.30 0.35 0.40 0.45 0.50 Lo w Fl ow (m 3 /s) 0 10 20 30 40 Obs. LN3 GPA LP3 1409 Quarter-3 Empirical Probability 0.50 0.55 0.60 0.65 0.70 0.75 Low Flow ( m 3 /s) 0 10 20 30 40 50 Obs. LN3 GPA LP3 1409 Quarter-4 Empirical Probability 0.75 0.80 0.85 0.90 0.95 1.00 Low Flow ( m 3 /s) 0 100 200 300 400 Obs. LN3 GPA 1404 Quarter-1 Empirical Probability 0.00 0.05 0.10 0.15 0.20 0.25 Lo w Fl ow ( m 3 /s ) 0 10 20 30 40 50 60 Obs. LN3 GPA LP3 GEV 1404 Quarter-2 Empirical Probability 0.25 0.30 0.35 0.40 0.45 0.50 Lo w Fl ow ( m 3 /s) 0 10 20 30 40 50 60 70 Obs. LN3 GPA LP3 GEV 1404 Quarter-4 Empirical Probability 0.75 0.80 0.85 0.90 0.95 1.00 Lo w Flo w ( m 3 /s) 0 200 400 600 800 Obs. LN3 GPA GEV 1404 Quarter-3 Empirical Probability 0.50 0.55 0.60 0.65 0.70 0.75 Lo w Flo w ( m 3 /s) 0 20 40 60 80 100 Obs. LN3 GPA LP3 GEV
Figure 2. Comparison of observed low flow of each gauging station with predicted low flows obtained from selected distributions at each quarter.
References
Anonim, 1970. Yeşilırmak Havzası Toprakları. Topraksu Genel Müdürlüğü Yayınları, Yayın no: 241, Ankara.
Chang, M., D. G. Boyer, 1975. Estimates of low flows using watershed and climatic parameters. Water Resources Research, 13 (6): 997-1001.
Durrans, S. R., S. Tomic, 1996. Regionalization of low-flow frequency estimates: An Alabama case study. Water Resources Bulletin, 32 (1): 23-37.
Fernandez, B., J. D. Salas, 1999. Return period and risk of hydrologic events: 1. Mathematical formulation. ASCE Journal of Hydrologic Engineering, 4 (4): 297-307.
Greenwood, J. A., J. M. Landwehr, N. C. Matalas and J. R. Wallis, 1979. Probability weighted moments: definition and relation to parameters of several distributions expressable in inverse form. Water Resources Research, 15 (5): 1049-1054.
Heo, J. H., J. H. Kim and J. D. Salas, 2001. Estimation of confidence intervals of quantiles for the weibull distribution. Journal of Stochastic Environmental Research and Risk Assessment, 15 (4): 284-309.
Hisdal, H., K. Stahl, L. M. Tallaksen and S. Demuth, 2001. Have streamflow droughts in Europe become more severe or frequent? International Journal of Climatology, 21: 317-333. Hosking, J. R. M. 1990. L-Moments: Analysis and estimation of
distributions using linear combinations of order statistics. Journal of The Royal Statistical Society Series B, 52 (1): 105-124.
Hosking, J. R. M., J. R. Wallis, 1997. Regional Frequency Analysis: An Approach Based on L-Moments. Cambridge University Press, 224 p. USA.
Jain, D., V. P. Singh, 1987. Comparison of Some Flood Frequency Distributions Using Empirical Data. “ Ed. V.P. Singh. Hydrologic Frequency Modeling”, D. Reidel Publishing Company, p 467-485, The Netherlands.
Knapp, H. V., M. W. Myers, 1999. Fox River Streamflow Assessment Model: 1999 Update to The Hydrologic Analysis. Illinois State Water Survey Contract Report 649, 85 p, Illinois, USA.
Kroll, C. N., R. M. Vogel, 2002. Probability distribution of low streamlow series in the United States. Journal of Hydrologic Engineering, 7 (2): 137-146.
Önöz, B., M. Bayazit, 1999. GEV-PWM model for distribution of minimum flows. Journal of Hydrologic Engineering, 4 (3): 289-292.
Pearson, C. P. 1995. Regional frequency analysis of low flows in New Zealand rivers. Journal of Hydrology, 30 (2): 53-64. Riggs, H. C. 1980. Characteristics of low flows. Journal of
Hydraulic Engineering, 106 (5): 717-731.
Smakhtin, V. Y., M. Toulouse, 1998. Relationships between low-flow characteristics of South African streams. Water SA, 24 (2): 107-112.
Stahl, K., S. Demuth, 1999. Linking streamflow drought to the occurrence of atmospheric circulation pattern. Hydrological Sciences Journal, 44 (3): 467-482.
Tasker, G. D. 1987. A comparison of methods for estimating low flow characteristics of streams. Water Resources Bulletin, 23 (6): 1077-1083.
Vogel, R. M., C. N. Kroll, 1989. Low-flow frequency analysis using probability-plot correlation coefficients. Journal of Water Resources Planning and Management, 115 (3): 338-357. Vogel, R. M., I. Wilson, 1996. Probability distribution of annual,
maximum, mean, and minimum streamflows in the United States. Journal of Hydrologic Engineering, 1 (2): 69-76. Waltemeyer, S. D. 2002. Analysis of the magnitude and
frequency of the 4-Day annual low flow and regression equations for estimating the 4-day, 3-year low-flow frequency at ungaged sites on unregulated streams in New Mexico. U.S. Department of the Interior, U.S. Geological Survey, Water Resources Investigation Report 01-4271, 22 p, New Mexico, USA.
Wilhite, D. A., M. H. Glantz, 1985. Understanding the drought phenomenon: The role of definitions. Water International, 10: 111-120, 1985.
Zelenhasic, E., 2002. On the extreme streamflow drought analysis. Water Resources Management, 16: 105-132. Zelenhasic, E., A. Salvai, 1987. A method of streamflow drought
analysis. Water Resources Research, 23 (1): 156-168.
İletişim adresi:
Kadri YÜREKLİ
Gaziosmanpaşa Üniversitesi Ziraat Fakültesi Tarımsal Yapılar ve Sulama Bölümü-Tokat Tel: 0 (356) 252 14 79 / 2245