Contents lists available atScienceDirect
Engineering Structures
journal homepage:www.elsevier.com/locate/engstruct
Evaluation and comparison of ultimate deformation limits for RC columns
Muhammed Alperen Özdemir
a,
İlker Kazaz
b,⁎, Suat Gökhan Özkaya
caDept. of Civil Engineering, Iğdır University, 76000 Iğdır, Turkey
bDept. of Civil Engineering, Erzurum Technical University, 25050 Erzurum, Turkey cDept. of Civil Engineering, Ardahan University, 75000 Ardahan, Turkey
A R T I C L E I N F O
Keywords: RC column Performance limit Strain limit Rotation limit Ultimate deformation Performance assessmentA B S T R A C T
The ultimate deformation capacity assigned to structural elements of reinforced concrete structures is an es-sential parameter in the determination of their structural performance especially under seismic attack. Various ultimate deformation capacity limits were proposed for RC columns in the previous studies and were accom-modated in the current building codes. However, the reliability of the existing deformation limits is still a matter of considerable debate. This study mainly focuses on the evaluation of the accuracy of the existing damage limits and aims to develop a new definition with a higher reliability in comparison to the existing limits. In this purpose, the study was composed of four major steps. Firstly, the existing building codes, standards, regulations and previous studies were reviewed and evaluated in terms of ultimate deformation criteria for RC columns. Secondly, actually tested sixty-nine RC columns were selected from PEER Structural Performance Database and were numerically modelled by usingfinite element method. The selected RC columns have different dimensions, aspect ratios, concrete and steel strength, longitudinal and transverse reinforcement amounts and axial load ratio. Third stage includes the comparison of the results obtained from the experimentally verified numerical models with the existing ultimate deformation limits to reveal the shortcomings of existing criteria. The nu-merical modelling facilitated the consistent comparison of strains and curvatures that are rarely available and difficult to measure in tests. A new concrete compressive strain prediction equation was proposed to determine the ultimate deformation capacity of rectangular RC columns. It was concluded that there is need for further comprehensive analytical and experimental studies on deformation limits of reinforced concrete columns.
1. Introduction
Predicting the deformation capacity of reinforced concrete beams, columns and walls is vital for a thorough seismic evaluation of existing or new buildings in performance based earthquake engineering. The ability to remain without significant loss of load-carrying capacity of reinforced concrete (RC) structural members under seismic loads is a necessary criteria for life safety. Understanding the behavior of col-umns, which are the primary components of structure, is important for the evaluation of entire structural system. Although behavior of RC columns is well understood and researched, the problem of determi-nation of the ultimate deformation capacity of RC columns under seismic loads is not fully resolved.
There are code and performance based expressions that are re-commended for estimating the ultimate deformation capacity of RC columns. Codes and previous studies specifies deformation limits for RC columns in terms of rotation angle (θ)[1–4], strain (ε)[5–7]and drift ratio at shear failure (δ) [8]. The local strains are convenient
deformation measures whenfiber models are used to estimate inelastic seismic deformation demands in concrete members in nonlinear ana-lysis. However, a limited number of column test results were used for verifying these expressions and limit states specified at the codes, especially which are based on strain criteria. Acun and Sucuoğlu[9] conducted twelve full-scale column tests to evaluate performance limits and they found that proposed deformation limits in Eurocode-8[1]and ASCE/SEI 41[2]are very conservative. Bae and Bayrak [10]found similar results for drift capacity of RC columns. Due to the effort, time spent and limitations of the test set-ups, limited tests were conducted on large-scale RC columns with different design parameters, such as con-finement, concrete strength, longitudinal reinforcement ratio, axial load ratio and cross sectional dimensions. In addition, test results of columns with similar properties tested by different researchers indicate different drift capacities. Therefore, proposed expressions and accep-tance criteria in seismic action for RC columns need a deeper in-vestigation using more extensive and consistent column databases to improve limit state definitions and their corresponding values.
http://dx.doi.org/10.1016/j.engstruct.2017.10.050
Received 15 June 2017; Received in revised form 17 September 2017; Accepted 18 October 2017 ⁎Corresponding author.
E-mail addresses:[email protected](M.A. Özdemir),[email protected](İ. Kazaz),[email protected](S.G. Özkaya).
Available online 01 November 2017
0141-0296/ © 2017 Elsevier Ltd. All rights reserved.
Analytical studies can be conducted to minimize the dispersion and discrepancy among the tests related to experimental uncertainties by doing large number of analyses from a single hand using reliable models.
Evaluation of these code limits and proposed equations by analyzing large number of column database using a well-calibratedfinite element model is easier and more feasible than conducting experiments in to-day’s technology. In recent decades, the problem of accuracy in the analysis is further reduced by the developments in thefield of model-ling. Previously, Kazaz et al.[11–13]evaluated deformation limits for reinforced concrete shear walls by using nonlinearfinite element pro-cedures (FEM). They proposed reliable and improved prediction equa-tions for the deformation capacity of shear walls. Using a similar ana-lytical framework, this study utilizes a verified modelling tool to investigate the deformation measures defined in terms of plastic rota-tion, curvature and local concrete and steel strains at the cover and core fiber of RC columns of which test results were collected from the ex-isting literature.
In this study, sixty-nine experimental column studies that were se-lected from PEER Structural Performance Database[16]were analyzed with finite element method. To conduct a comprehensive study of column behavior, finite element models of tested columns were gen-erated to estimate the local moment-curvature (strains, rotations as well) and global lateral load-displacement behavior. In addition, crushing and spalling of concrete cover, bond failure, buckling of compression bars, strain profile, strain of outer fiber of confined con-crete were evaluated at ultimate limit state. The adequacy of de-formation limits specified by codes and researchers were investigated and the reliability of previously proposed equations was evaluated.
2. Current regulations and previous studies
2.1. Turkish Seismic Code (TSC 2007 and TSC-Draft 2016) limit states The Turkish Seismic Code (TSC 2007, [5]) specifies limits for structures to be built in disaster areas that are applicable both to newly constructed buildings and to existing buildings. The Turkish Seismic Code, when compared with equivalent codes, recognizes the use of the concrete and steel strain values as damage limit instead of rotation angle or drift ratio.
Concrete and steel strain limits at the fibers of cross section are given in Eqs.(1)–(3).
= =
ε ε
For Minimum Damage Limit(MD); (cu MD) 0.0035; ( )s MD 0.010 (1)
= + ⩽
=
ε ρ ρ ε
For Safety Limit(SL); ( ) 0.0035 0.01( / ) 0.0135; ( ) 0.040 cg SL s sm s SL (2) = + ⩽ = ε ρ ρ ε
For Collapse Limit(CL); ( ) 0.004 0.014( / ) 0.018; ( ) 0.060
cg CL s sm
s CL (3)
In Eqs.(1)–(3),εcuis concrete strain at the outerfiber of the cross
section,εcgis concrete strain at the outerfiber of the confined core, εsis
longitudinal reinforcement strain, ρs is volumetric ratio of transverse
reinforcement that exists in the cross section and arranged as“special seismic hoops and cross-ties”, ρsmis volumetric ratio of the transverse
reinforcement necessary to exist in the section as required by the code. The plastic hinge length to relate the local strains to section plastic rotation is recommended as 0.5h in TSC.
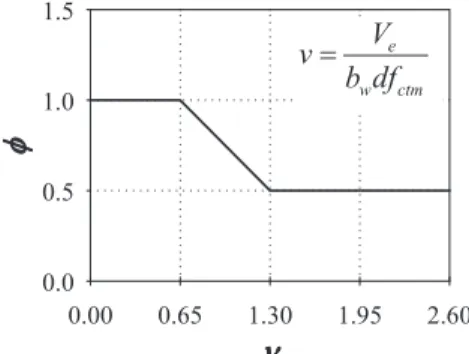
TSC-Draft[6]utilizes the same expressions given in Eqs.(1)–(3)in the calculation of strain limits. However, for taking into account the aggravating effect of high shear force on ductility of RC members, strain limit is multiplied by an emprical reduction factor (ϕ), which depends on the member shear stress ratiov=Ve/(b dfw ctm). The theoretical shear cracking strength of concrete taken as approximately 0.65fctmaccording
to idealized shear cracking model where the shear crack in a member is assumed to be inclined at 45°. Here Veis shear force demand on column,
bw is width of cross section, d is effective section height and fctmis
tensile strength of concrete. The reduction factor is plotted inFig. 1.
2.2. ASCE/SEI 41-13 plastic rotation limits
ASCE/SEI 41[2]is commonly used throughout the US and inter-nationally for the seismic assessment and retrofit of existing concrete buildings. Recently, the concrete provisions of ASCE/SEI 41 were up-dated to better reflect the observed performance of concrete compo-nents from quasi-static cyclic tests [14]. These updates were in-corporated in the latest release of the seismic rehabilitation standard, ASCE/SEI 41.
The discrete plastic rotation limits defined in terms of axial load ratio (P/Agfc), volumetric ratio of the confinement (transverse)
re-inforcement (ρs) and normalized shear stress in ASCE/SEI 41[2]are
expressed with continuous functions using the same variables as given inTable 1for easy calculation of the defined limits. The failure modes depend on transverse reinforcement condition and shear capacity ratio. To determine probable failure mode of columnTable 2is recommended in ASCE/SEI 41. InTable 2, Vois the shear strength of column member
without modification factor for flexural ductility according to Eq. (10-3) in ASCE/SEI 41 and Vp is the shear force at the development of the
flexural capacity of a concrete element. 2.3. Eurocode 8 Part-3 (CEN, 2005) limits
According to CEN[1]the limit states are based on total chord ro-tation capacity of beams, columns and walls. The chord roro-tation is the angle between the tangent to the axis at the yielding end and the chord connecting that end with the end of shear span at the point of contra flexure. The chord rotation is also equal to the element drift ratio, which is the deflection at the end of the shear span divided by the length.
The value of the total chord rotation capacity (elastic plus inelastic part) at ultimate (Near Collapse, NC),θu, of concrete members under
cyclic loading is calculated from the following expression:
= ⎡ ⎣ ⎢ ′ ⎤ ⎦ ⎥ ⎛⎝ ⎛⎝ ⎞⎠⎞⎠ θ γ ω ω f min L h 1 0.016(0.3 ) max(0.01; ) max(0.01; ) 9; 25 (1.25 ) u el v c v αρ f f ρ 0.225 0.35 ( ) 100 sx yw c d (4)
whereγelis equal to 1.5 for primary seismic elements and to 1.0 for
secondary seismic elements, h is the depth of cross-section, Lv= M/V is
the ratio of moment/shear at the end section,ν=N bhf/ c (b width of compression zone, N axial force positive for compression),ω' and ω are reinforcement ratio of the longitudinal compression (including the web reinforcement) and tension reinforcement, fc, fyw are the concrete
compressive strength (MPa) and the stirrup yield strength (MPa), =
ρsx Asx/b sw his ratio of transverse steel parallel to the direction x of
loading (sh= stirrup spacing), ρd is the steel ratio of diagonal
e
w ctm
V
v
b df
reinforcement (if any), in each diagonal direction,α is the confinement effectiveness factor.
In addition, CEN[1]states a deformation limit for concrete ultimate strain of the extremefiber of the cross section. The expression for ul-timate strain of the compression zone reads as
= + ε αρ f f 0.004 0.5 cm s yw cc (5)
where fccis the confined concrete strength.
Examples of other deformation limits for existing RC columns are Panagiotakos and Fardis[3], Elwood and Moehle[8], Haselton et al. [4]and Grammatikou et al.[7]. Panagiotakos and Fardis[3]stated an equation, which is based on acceptance criteria in CEN[1], to calculate deformation limit as chord rotation of RC columns. Elwood and Moehle [8]provided a formula to estimate column drift ratio at shear and axial load failure. Haselton et al.[4]worked on a database of 255 quasi-static cyclic column tests and they recommended an expression to calculate plastic rotation capacity of RC columns. Recently Grammatikou et al. [7]used 168 experimental data to propose an equation to determine deformation limits based on outerfiber strain of column. These studies are summarized shortly next for complete evaluation of existing limits. Panagiotakos and Fardis[3]studied on a comprehensive set of ex-perimental tests results to reveal deformation behavior of RC members. They reported that conventional section models predict curvature at yield satisfactorily, yet ultimate curvature results display significant scatter. For this reason, alternative expression for ultimate chord rota-tion capacity (θu) given in Eq.(6)was proposed,
= ⎛ ⎝ + ⎞ ⎠ ⎡ ⎣ ⎢ ′⎤⎦⎥ ⎛⎝ ⎞⎠ θ a a a a ω ω f L h 1 2.3 (0.2 ) max(0.01; ) max(0.01; ) (1.1 )(1.3 ) um st cyc sl wall v c s αω ρ 2 1 0.275 0.45 100 wx d (6)
where astis coefficient for the steel of longitudinal bars, acycis coe
ffi-cient for the type of loading, aslis coefficient for the bond-slip, awallis
coefficient for wall, ν = N/Acf‘c is axial load ratio, ω1, ω2 are
re-inforcement ratios, fcis uniaxial concrete strength (MPa), Ls/h = M/Vh
is shear span ratio at the member end,ωwx= (Asx/bwsh)fyw/f′cis
me-chanical ratio of transverse steel parallel to the direction (x) of loading,
α is confinement effectiveness factor, ρdis ratio of diagonal
reinforce-ment.
In their study Grammatikou et al.[7]claim that the code limits are not safe and very general. They investigated the analytical relation between moment and curvature to estimate strains in the bars and the extreme concretefibers of section. They derived strain limit formula for extremefiber of concrete and steel bars as written in Eq. (7). They concluded that strains depend on geometric features of the section. In addition, they found that rebar size has an effect on ultimate strain of concrete and confined concrete; number of bars in tension and com-pression zone has effect on ultimate steel strain. They proposed the following expression for the ultimate strain of confined concrete
= + ′ ε αρf f 0.0035 0.04 cu s yw c (7)
Elwood and Moehle[15]re-evaluated 50 laboratory column tests with low transverse reinforcement ratio (ρs < 0.007). As a result of
their study, a drift capacity model based on experimental results was proposed. The following relationship estimates drift ratio at shear failure: = + − ′− ′⩾ δ ρ v f P A f 3 100 4 1 40 1 40 1 100 s s c g c (8)
whereρsis transverse steel ratio, v is nominal shear stress, ′fcis concrete
compressive strength, P is the axial load on the column, and Agis the
gross cross-sectional area,δsdrift at shear failure.
Haselton et al.[4]used 255 column test results to create empirical equation that predicts deformation capacity. In their study, statistically significant design parameters were determined and correlation between plastic rotation and design parameters were identified. They proposed the following equation.
= + + ′
θcap pl 0.12(1 0.55asl)(0.16) (0.02v 40ρsh) (0.54) (0.66) (2.27)
c f s ρ
, 0.43 0.01units c 0.1n 10.0
(9) where aslis a bond-slip indicator (asl= 1 where bond-slip is possible),ν
is the axial load ratio,ρshis the area ratio of transverse reinforcement in
the plastic hinge region spacing, sn is a rebar buckling coefficient
( s d( / )(b cunits yf /100)0.5), s is stirrup spacing, dbis the longitudinal rebar
diameter, fyis the yield strength of the longitudinal rebar, and cunitsis a
units conversion variable that equals 1.0 when f′cand fy are in MPa
units and 6.9 for ksi units.
3. Methodology and parametric study 3.1. Experimental database
The column dataset used in this study were taken from PEER Structural Performance Database User’s Manual[16]and related pub-lications.Table 3identifies the names as referred in original studies and dimensions of 69 column specimens used in this study to evaluate de-formation capacities of rectangular RC columns. Material and geo-metric features of each experimentally evaluated rectangular RC column tests and their measured values such asΔy, Vmax,Δu, and failure Table 1
Ultimate plastic rotation angle equations and failure modes.
Failure Modes Ultimate Plastic Rotation Angle (rad)
Condition i (Flexure Failure)
− ⎛ ⎝ ⎞ ⎠+ ′ ρ 0.0292 0.047 P 1.625( ) Ag fc s
Condition ii (Flexure-Shear Failure where yielding is expected before shear failure)
⎜ ⎟ + − + ⎛ ⎝ ⎞ ⎠+ − ⎛ ⎝ ⎞ ⎠ ′ ′ ρ ρ ρ 0.016 2.8636 (4.5455s 0.00117) P (0.3636 0.00202) Ag fc V bw d fc
Condition iii (Shear Failure)
− ⎛ ⎝ ⎞ ⎠+ ′ ρ 0.00678 0.013 P 1.5454 Ag fc s Table 2
Transverse Reinforcement Details: Condition to be used for columns inTable 1(adapted from ASCE/SEI 41[2]).
Shear Capacity Ratio Transverse Reinforcement Details ACI 318 Conforming Seismic Details with 135-Degree Hooks Closed Hoops with 90-Degree Hooks
Other (Including Lap-Spliced Transverse Reinforcement) ⩽ V Vp/o 0.6 ia ii ii ⩾V V > 1.0 p/o 0.6 ii ii iii >
V Vp/o 1.0 iii iii iii
aTo qualify for condition i, a column should haveA b s/ ⩾0.002
v w ands d/ ⩽0.5 within flexural plastic hinge region. Otherwise, the column is assigned to condition ii.
Table 3
Dimensions and summary of test results for specimens selected from PEER Structural Performance Database[16]
No Test Series h (mm) b (mm) L (mm) P/Po fyt(Mpa) fc(Mpa) Δy(mm) Δu(mm) Vmax(kN) Failure type
1 Tanaka and Park[39], No. 5 550 550 1650 0.1 325 32 13.55 74.30 386 F
2 Tanaka and Park[39], No. 6 550 550 1650 0.1 325 32 11.96 111.77 409 F
3 Tanaka and Park[39], No. 7 550 550 1650 0.057 325 32.1 9.68 82.81 588 F
4 Park and Paulay[40], No. 9 600 400 1784 0.1 305 26.9 10.71 105.11 393 F
5 Ohno and Nishioka[31], L1 400 400 1600 0.032 325 24.8 9.49 81.39 119 F
6 Ohno and Nishioka[31], L2 400 400 1600 0.032 325 24.8 9.05 85.92 111 F
7 Imai and Yamamoto[38], No. 1 500 400 825 0.07 336 27.1 4.20 18.61 471 SF
8 Saatcioglu and Ozcebe[29], U1 350 350 1000 0 470 43.6 14.00 69.20 295 F
9 Saatcioglu and Ozcebe[29], U3 350 350 1000 0.14 470 34.8 20.78 51.10 267 F
10 Saatcioglu and Ozcebe[29], U4 350 350 1000 0.15 470 32 13.08 89.40 326 F
11 Saatcioglu and Ozcebe[29], U6 350 350 1000 0.13 425 37.3 13.56 87.34 343 F
12 Saatcioglu and Ozcebe[29], U7 350 350 1000 0.13 425 39 13.61 87.60 342 F
13 Wehbe et al.[42], A1 610 380 2335 0.1 428 27.2 23.60 122.09 368 F 14 Wehbe et al.[42], A2 610 380 2335 0.24 428 27.2 22.00 101.42 400 F 15 Wehbe et al.[42], B1 610 380 2335 0.09 428 28.1 27.30 160.52 380 F 16 Wehbe et al.[42], B2 610 380 2335 0.23 428 28.1 26.86 129.50 424 F 17 Lynn et al.[43], 3CLH18 457.2 457.2 1473 0.09 400 27 9.47 23.10 277 SF 18 Lynn et al.[43], 2CLH18 457.2 457.2 1473 0.07 400 33.1 8.40 46.20 241 SF 19 Lynn et al.[43], 2CMH18 457.2 457.2 1473 0.28 400 25.5 4.48 15.50 306 SF 20 Lynn et al.[43], 3CMH18 457.2 457.2 1473 0.26 400 27.6 7.90 15.40 328 SF 21 Lynn et al.[43], 3CMD12 457.2 457.2 1473 0.26 400 27.6 6.39 25.70 355 SF 22 Lynn et al.[43], 3SLH18 457.2 457.2 1473 0.089 400 26.9 7.90 22.80 270 SF 23 Lynn et al.[43], 2SLH18 457.2 457.2 1473 0.073 400 33.1 7.18 31.30 229 SF 24 Lynn et al.[43], 3SMD12 457.2 457.2 1473 0.284 400 25.5 7.84 24.70 367 SF
25 Xiao and Martirossyan[44], HC4-8L19-T10-0.1P 254 254 508 0.1 510 76 6.20 47.80 324 F
26 Xiao and Martirossyan[44], HC4-8L19-T10-0.2P 254 254 508 0.2 510 76 5.30 39.80 378 F
27 Xiao and Martirossyan[44], HC4-8L16-T10-0.1P 254 254 508 0.096 510 86 5.20 36.50 275 F
28 Xiao and Martirossyan[44], HC4-8L16-T10-0.2P 254 254 508 0.192 510 86 6.20 35.00 319 F
29 Nosho et al.[41], No. 1 279.4 279.4 2134 0.339 351 40.6 11.30 34.70 55 F
30 Bayrak and Sheikh[34], ES-1HT 305 305 1842 0.5 463 72.1 9.50 42.30 136 F
31 Bayrak and Sheikh[34], AS-2HT 305 305 1842 0.36 542 71.7 11.30 45.30 149 F
32 Bayrak and Sheikh[34], AS-3HT 305 305 1842 0.5 542 71.8 9.30 33.90 144 F
33 Bayrak and Sheikh[34], AS-4HT 305 305 1842 0.5 463 71.9 14.00 42.00 139 F
34 Bayrak and Sheikh[34], AS-5HT 305 305 1842 0.45 463 101.8 5.67 29.70 182 F
35 Bayrak and Sheikh[34], AS-6HT 305 305 1842 0.46 463 101.9 14.20 28.30 170 F
36 Bayrak and Sheikh[34], AS-7HT 305 305 1842 0.45 542 102 14.60 23.10 159 F
37 Bayrak and Sheikh[34], ES-8HT 305 305 1842 0.47 463 102.2 9.60 29.40 178 F
38 Saatcioglu and Grira[35], BG-1 350 350 1645 0.428 570 34 9.99 33.00 195 F
39 Saatcioglu and Grira[35], BG-2 350 350 1645 0.428 570 34 9.64 50.01 186 F
40 Saatcioglu and Grira[35], BG-3 350 350 1645 0.2 570 34 15.40 116.02 164 F
41 Saatcioglu and Grira[35], BG-4 350 350 1645 0.462 570 34 11.01 50.00 204 F
42 Saatcioglu and Grira[35], BG-5 350 350 1645 0.462 570 34 13.76 99.52 204 F
43 Saatcioglu and Grira[35], BG-6 350 350 1645 0.456 570 34 11.31 81.51 222 F
44 Saatcioglu and Grira[35], BG-7 350 350 1645 0.462 580 34 11.97 99.52 209 F
45 Saatcioglu and Grira[35], BG-8 350 350 1645 0.231 580 34 20.66 118.00 198 F
46 Mo and Wang[45],C1-1 400 400 1400 0.113 460 24.9 14.95 82.28 250 F 47 Mo and Wang[45],C1-2 400 400 1400 0.158 460 26.7 14.79 96.57 268 F 48 Mo and Wang[45],C1-3 400 400 1400 0.216 460 26.1 14.87 88.10 305 F 49 Mo and Wang[45],C2-1 400 400 1400 0.111 460 25.3 16.71 98.02 248 F 50 Mo and Wang[45],C2-2 400 400 1400 0.156 460 27.1 15.62 101.84 261 F 51 Mo and Wang[45],C2-3 400 400 1400 0.21 460 26.8 13.45 77.00 310 F 52 Mo and Wang[45],C3-1 400 400 1400 0.107 460 26.38 17.91 101.59 235 F 53 Mo and Wang[45],C3-2 400 400 1400 0.154 460 27.48 17.89 104.21 260 F 54 Mo and Wang[45],C3-3 400 400 1400 0.209 460 26.9 15.43 120.00 300 F
55 Sezen and Moehle[48], No. 1 457.2 457.2 1473 0.151 476 21.1 12.80 40.41 303 SF
56 Sezen and Moehle[48], No. 2 457.2 457.2 1473 0.605 476 21.1 7.44 27.53 300 SF
57 Sezen and Moehle[48], No. 4 457.2 457.2 1473 0.152 476 21 14.00 38.57 295 SF
58 Bechtoula, Kono, Arai and Watanabe[46], L1D60 600 600 1200 0.567 524 39.2 4.50 35.12 1239 F
59 Bechtoula, Kono, Arai and Watanabe[46], L1N60 600 600 1200 0.567 524 39.2 3.50 31.27 1339 F
60 Bechtoula, Kono, Arai and Watanabe[46], L1N6B 560 560 1200 0.594 524 32.2 2.88 36.25 1200 F
61 Takemura and Kawashima,[47], Test 3 (JSCE-6) 400 400 1245 0.029 368 34.3 5.80 74.18 153 F
62 Takemura and Kawashima,[47], Test 6 (JSCE-9) 400 400 1245 0.027 368 35.9 6.40 105.73 171 F
63 Xiao & Yun[36], No. FHC1-0.2 510 510 1778 0.2 445 64.1 14.80 106.78 724 F
64 Xiao & Yun[36], No. FHC2-0.34 510 510 1778 0.333 445 62.1 11.10 72.32 804 F
65 Xiao & Yun[36], No. FHC3-0.22 510 510 1778 0.225 524 62.1 13.80 106.68 724 F
66 Xiao & Yun[36], No. FHC4-0.33 510 510 1778 0.324 525 62.1 11.40 71.18 797 F
67 Xiao & Yun[36], No. FHC5-0.2 510 510 1778 0.2 445 64.1 14.10 53.32 712 F
68 Xiao & Yun[36], No. FHC6-0.2 510 510 1778 0.2 524 64.1 16.00 72.00 704 F
69 Bayrak & Sheikh[34], No. RS-11HT 350 250 1842 0.51 542 70.8 9.25 86.50 190 F
h: Column Depth, b: Column Width, P/Po= Axial Load Ratio, fyt= Yield stress of transverse reinforcement, fc= Characteristic compressive strength of concrete,Δy= The nominal displacement at yield,Δu= The maximum recorded column deflections prior to observing a particular level of damage, Vmax= The maximum recorded lateral force. F: Flexural failure, SF: Shear-Flexure failure.
type information were given inTable 3. Chord rotation (θu=Δu/L) and
chord rotation at yield (θy=Δy/L) values were calculated by using
these measurements.
Most of the selected test specimens experienced flexure-critical failure whereas only 12 of 69 specimen failed inflexure-shear critical mode[16]. No column in the dataset failed under shear-critical mode. The selected columns satisfy the following criteria: column aspect ratio as 1.65 < L/h < 7.63; concrete compression strength as 21 < fc< 102 MPa; longitudinal and transverse reinforcement
nom-inal yield stress, fyand fyw, in the range of 300–580 MPa; longitudinal
reinforcement ratio, 0.01 < ρ < 0.036; transverse reinforcement ratio, 0.00082 < ρs< 0.032 and axial load ratio, 0 < P/Po< 0.6.
So, this database covering wide range of column properties may be assumed to represent the flexure-controlled columns’ behavior ade-quately.
3.2. Finite Element Analysis (FEA) and validation
Finite element modelling strategy adopted in this study does not require any special handling of shear orflexure type behaviors to have good estimations of experimental behavior. The purpose of thefinite element models used in this study is not to revive the complete response or all physical phenomenon (cover spalling, crushing, buckling) of an actual test, but is rather to mimic or imitate the observed behavior with an acceptable margin of error.
Response of tested columns was calculated using nonlinearfinite element analysis program ANSYS[17]. The general modelling strategy and calculation of deformation measures are illustrated inFig. 2. This study follows the general rules of validated modelling strategy for which the detailed description of material models for concrete and steel can be found in Kazaz et al.[11–13,18]. These studies include extensive verification examples of reinforced concrete specimens tested under dynamic and cycling loading conditions. The effect of cycling loading was accounted by using material models that incorporates such de-gradation effects. The uniaxial confined concrete stress-strain curve is calculated according to Saatcioglu and Razvi [19] model using the geometric and material properties of the columns. Willam-Warnke[20] concrete failure surface model was combined together with multilinear kinematic work hardening plasticity (MKIN) that is based on the
uniaxial concrete stress-strain curve to model the concrete multiaxial stress behavior. The TSC[5]steel constitutive model was used to model the response of the longitudinal reinforcement. The bar buckling model proposed by Dhakal and Maekawa[21]was used to model the buckling behavior of longitudinal steel under compression. It was realized that bond-slip might be a significant deformation component on force-de-formation relation of columns so that Eligehousen et al.[22]bond-slip model was added to FE models.
In nonlinear analysis of RC, a shear transfer coefficient must be assumed. For closed cracks (βc), the coefficient is assumed to be 0.8,
whereas for open cracks (βt) it should be in the suggested range of
0.05–0.5, rather than 0.0, to prevent numerical difficulties. In this study, a value of 0.05 was used, which resulted in acceptably accurate predictions[18].
SOLID65 utilized in thefinite-element analysis is a basic brick ele-ment with eight nodes and three translational degrees of freedom at each node. When the softening property after peak response is used in constitutive models, thefinite-element solutions are known to have spurious sensitivity to the mesh size and to have difficulty in conver-ging. Element has extra shapes functions capability, yet this function leads to strain localization problems in the softening region. Without extra shape functions, to overcome localization and shear locking problems, section must be discretized with sufficient number of ele-ments in bending direction. The optimum mesh density in eachfinite element model was determined by performing sensitivity analysis using different mesh sizes. Then, lateral displacement-shear force response fromfinite element analyses were compared with experimental results. As a rule of thumb, it was determined that for column and beam ele-ments dividing core section to 5–6 elements along the depth and aiming for an element aspect ratio close to 1 yields reasonable estimation of the experimentally measured response. One element thickness is used for cover concrete.
All type of reinforcement in the model was modelled with LINK180. LINK180 is a 3-D uniaxial tension-compression element with three de-grees of freedom at each node: translations in the nodal x, y, and z directions.
Lateral and axial loads were applied as in the experimental set-ups. Lateral displacement was applied to upper middle nodes of the columns and axial loads were applied as distributed at the tip surface of the
column. Large deflection effects were considered wherever required. Each analysis of test specimens was performed under monotonic static loads.
The rotation (θ) at the base of the columns were calculated using the axial elongationΔtat the tension side and shorteningΔcat the
com-pression side of the column section. These displacements (ΔtandΔc)
were taken over the plastic hinge length assumed to be Lp= h/2 from
base and then divided by the column clear section depth (ho= h-2.cc,
where cc is the clear cover) to obtain the base rotation angle (θ) of column. Curvature of section (ϕ), ultimate average strains at core (εcu,ave) and cover (εcu,ave_cover) fibers of concrete and tension steel
(εsu,ave) over Lplength are calculated as displayed inFig. 2.
The“plastic hinge length, Lp” is actually a reference length to obtain
the base rotation of the column, not really the“plastic zone length, Lpz”,
which might be different in all models, as it results from the spread of plastic steel strains in the model. Eight different widely accepted and used plastic hinge formulations[23–28]were evaluated in comparison to the calculated plastic hinge length taken as 0.5Lpzassuming linear
distribution of the curvatures within the plastic zone. The results are plotted inFig. 3. It is seen that the simple 0.5h formula yields reason-able estimation of the plastic zone length. In order to keep the proce-dure as simple as possible although complicated analyses were carried out here, a“representative average ultimate strain” was associated with the ultimate damage state although it is not the “actual” value, yet correlating with the“actual average strain” over h/2 length at the base of column. By this way, it is aimed to obtain reasonable estimations of the ultimate deformation capacity of the member using direct section based moment-curvature analysis.
Fig. 4(a) displays the experimental load-deformation curve for a typical tested column by Saatcioglu and Ozcebe[29]and FEA analysis results. It is also shown inFig. 4(a) that the bond-slip has a significant effect on the element flexural rigidity, deformation and load capacity. Additionally, potential failure conditions such as bar buckling, crushing of cover concrete were evaluated at ultimate deformation point. Fig. 4(b) displays the comparison of moment-curvature graphs from Finite Element Analysis (FEA) and Section Analysis (SA). SA does not consider bar buckling, bond-slip, high strength concrete and size effects in the calculation of column behavior. The result of this comparison is
that the conventional finite element and the section analysis may overestimate deformation capacity of RC columns when bond-slip failure is not accounted in the analysis.
In all the analyses, the ultimate deformation point was determined on the basis of one of the criteria defined as the point, where strength drops abruptly or degrades to 85% of the ultimate strength on the load-deformation curve, or the steel strain at the tension side exceedsεs=0.1
or the reinforcing bars at the compression side buckles (accompanied by significant crushing of concrete).Fig. 5(a) and (c) display that there is a good agreement between calculated (FEA) and experimental (EXP) ultimate tip displacements (Δu) and base shear force (Vmax) of the
columns.
The yield displacement was calculated according to the method based on an equivalent yield curvature obtained from bilinearization of the moment-curvature curve [30]. The curvatures are calculated ac-cording to Fig. 2over h/2 height at the base. The bilinear curve is obtained by drawing thefirst line from origin to the point on the curve where the reinforcement yields for thefirst time, and extending up to the nominal yield moment (EIy= My/ϕy). The nominal yield moment
(MNy) is defined as the moment where the extreme fiber strain in
compression reaches 0.004 or the extreme strain in tension reaches 0.015, whichever occurs first. The nominal moment closely approx-imates the global yield moment. The second line connects thefirst line at the top to the ultimate point on the moment-curvature curve. The nominal yield curvature becomesϕNy= MNy/EIy. The displacement at
this nominal curvature is adopted as the yield displacement. As shown inFig. 5(b) and (d) respectively, there are some differences between experimental and FEA responses for tip displacement at yield (Δy) and
plastic rotation (θp) that is calculated as the ratio of plastic tip
dis-placement to the column length, (Δu− Δy)/L. This observation can be
attributed to the fact that the procedure depends on theflexural re-sponse (moment-curvature curve), so it may give slightly smaller yield displacement than the global yield observed on the experimental load-deformation curve ignoring the shear load-deformations.Fig. 5(b) also dis-plays the global yield displacements (blue circles) observed directly on the force-deformation curve. The latter correlates better with experi-mental values. The other reasons are in general FEA yields slightly stiffer response than the experimental ones which may be attributed to
Lp(FEA) Lp(M od el) Lp(FEA) Lp(FEA)
L
ph
Lp(FEA) Lp( M ode l) d fb sy Lp Lv h fc pL
L
d
d
d
Lp d L Lp h p b sy L L d f p L h s p o g A P L L h P AFig. 3. Comparison of eight different widely accepted and used plastic hinge formulations with the calculated plastic hinge length that was taken as 0.5Lpzassuming linear distribution of the curvatures within the plastic zone.
stiffer base fixity, inadequacy of modelling of bond slip, base rotation, etc. The comparisons given inFig. 5validate thefinite element models’ ability to represent the experimental study. When the FEA results are compared with the experimental data, the agreement seems to be ac-ceptable for relying on FEA results.
Fig. 6shows calculated strain, curvature and rotation profiles for a
typical column tested by Ohno and Nishioka[31]. Strain profiles of columns were obtained at the ultimate deformation. The local strains over column length were calculated from each element nodal dis-placements, i.e. element strains are displayed inFig. 6. Curvature and rotation diagrams were generated from strain profiles. Also, maximum local concrete strains (εcu,max) and curvature (ϕmax) at core were taken Fig. 4. (a) Comparison of force-displacement curves of experimental,finite element and section analyses results, (b) moment-rotation relationships obtained from SA and FEA.
Fig. 5. Comparison of experimental and FEA results: (a) ultimate tip displacement; (b) tip displacement at yield (the blue empty circles displays the apparent yield displacement on the load-deformation curve, thefilled circles are calculated according to Priestley et al.[30]); (c) maximum base shear force; (d) plastic rotation.
h
h/2
h
h/2
from strain profiles. As it is seen, the plastic region extends over a length approximately equal to column section height h. Strain pene-tration in the tension side can be also observed inFig. 6(a). Although only displayed for a single column inFig. 6, severely damaged plastic region covers a length slightly greater than column section height h in majority of columns.
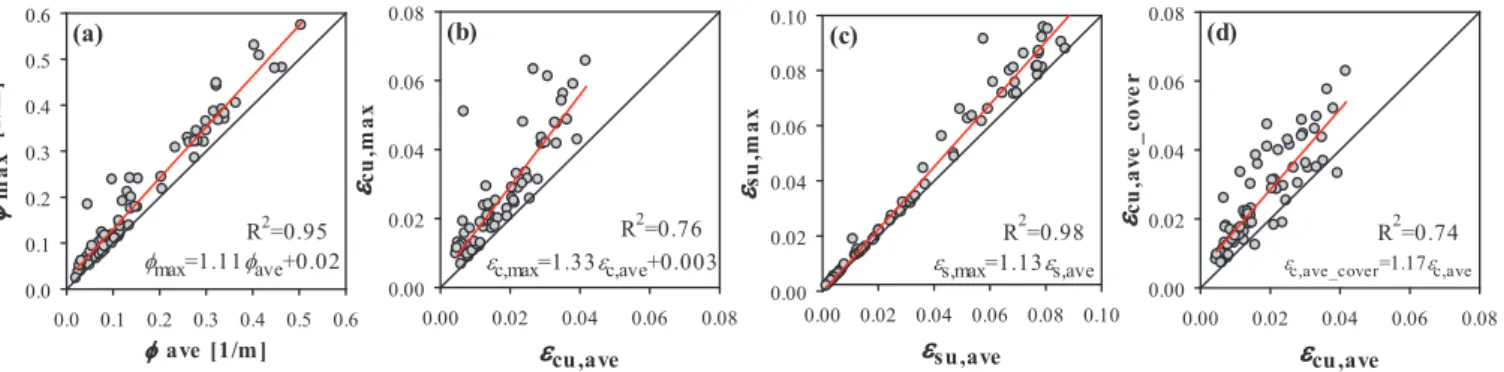
The measurement of strain, curvature and rotation in experiments is a crucial issue for reliable comparison of experimental results among different studies. The location for strain gage installation or the lvdt gage length for displacement measurements affects the reported results significantly. To shed more light on this issue the strains calculated pointwise as element maximum and as average over a region equal to h/2 on the column length calculated from FE analyses were compared for each deformation measure inFig. 7. Fig. 7(a) and (c) shows that there are small differences between the maximum and average values of curvature and steel strains. However, concrete core maximum (εcu,max)
and average strains (εcu,ave) have significant differences and
compres-sive strains calculated at the cover outer fiber (εcu,ave_cover) are
sig-nificantly larger than the strains from core outer fiber (εcu,ave) as
dis-played inFig. 7(d).
3.3. Relating FEA and section analyses
The load-deformation responses of 69 columns were calculated by using conventional section analysis (SA) in combination with plastic hinge method to establish correlation between FEA and SA results, since the use of nonlinearfinite element method might not be well suited for engineers in practice due to its complication. A modified version of CUMBIA[32], which is a reinforced concrete section analysis MATLAB code, was used for calculating moment-curvature response of columns. However, as mentioned before SA does not consider bar buckling, bond-slip, high strength concrete and size effects in the calculation of column behavior.
Fig. 8compares concrete and steel strains from section andfinite element analyses at the same ultimate curvature determined on the
basis offinite element analyses results. SA strain values were compared with average strains over Lpfrom FEA results. As seen inFig. 8, there is
a good agreement between the FEA and SA strains. It can be concluded that the strain calculated over h/2 gage length can be a used to evaluate the structural damage, although it is not the actual strain as discussed in Fig. 7(b).
4. Results and discussion
4.1. Evaluation of code and previously proposed limits
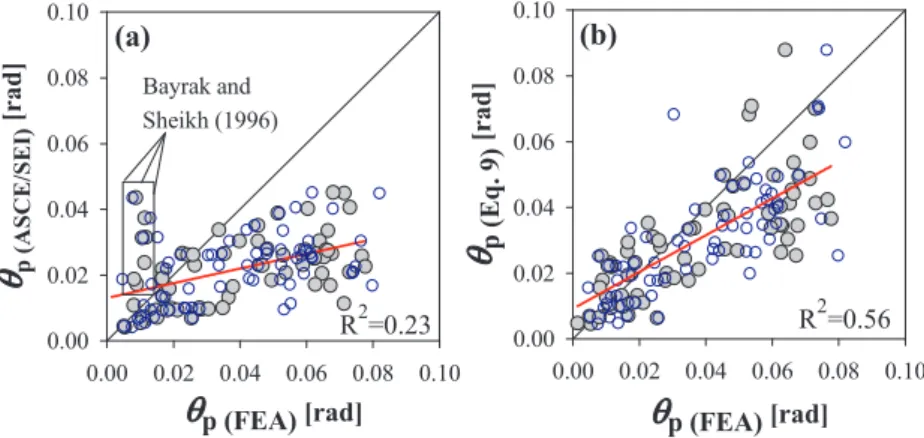
ASCE/SEI 41 specify the plastic rotation limits for RC members. As shown inFig. 9(a), comparison of calculated rotations and code plastic rotation limits reveals that ultimate plastic rotation limits of ASCE/SEI 41 corresponding to significant loss of lateral-force capacity provides mostly conservative estimations. Ludovico et al. [33]and Acun and Sucuoğlu[9]reached same result in their study on nonconforming RC columns. However, for the columns, which have axial load ratios greater than 0.45 and made of high strength concrete (HSC, fc
∼70–102 MPa), ASCE/SEI 41 limits remains on the unsafe side, espe-cially observed in Bayrak and Sheikh[23]tests as displayed inFig. 9(a). Haselton et al.[4]proposed Eq.(9)to determine deformation ca-pacity of columns based on plastic rotation angle.Fig. 9(b) displays that the equation provides improved and more adequate estimations of the stated limits in ASCE/SEI 41[2], although the variability of the model error is still big (R2= 0.56). On the other hand, proposed equation
yields inadequate estimations for columns made of HSC, have aspect ratio greater than six, transverse reinforcement diameter greater than 15 mm and have axial load ratio greater than 0.45 in a similar manner to ASCE/SEI 41. These nonconforming column tests were conducted by Saatcioglu and Grira[35], Saatcioglu and Ozcebe[29], Xiao and Yun [36]and Bayrak and Sheikh[37].
Fig. 9also displays the comparison of model estimations against the experimental ultimate plastic rotations (blue-empty circles). Similar trends observed for the comparisons of the model estimations against
Fig. 7. Comparison of curvatures and average strains (εave) calculated over Lpregion and from strain profile (εmax) in the core zone.
Fig. 8. Comparison of ultimate strains from FEA and SA at the same ultimate curvature (a) concrete ultimate strains and (b) steel ultimate strains.
the FEA based strain limits and experimental limits supports the relia-bility of the acceptance of FEA results as a basis for this study as also validated inFigs.4 and 5.
CEN[1]and Panagiotakos and Fardis[3]suggest deformation ca-pacity limits for beams, columns and walls based on the total chord rotation. Panagiotakos and Fardis proposed an equation after ex-amining 878 RC structural element tests. Moreover, CEN states de-formation limits similar to Panagiotakos and Fardis. As seen Fig. 10(a), 73% of RC column specimens are on the unsafe side cerning the chord rotation angle when CEN limit states were con-sidered. The equation proposed in Panagiotakos and Fardis yields in-significant improvement compared to CEN and just 36% of the columns are at safe region as shown inFig. 10(b). The deflection at the tip of the column divided by column height defines the drift ratio which can be interpreted as total chord rotation also. Although the drift ratio ex-pression given in Eq.(8)yields more conservative rotation estimations for majority of columns when compared to other definitions, it remains incapable of giving good correlation against actual values as displayed inFig. 10(c).
Another approach for predicting deformation capacity of RC col-umns is using the concrete and steel strains as deformation criteria. As mentioned before, TSC[5,6]and CEN[1]set strain limits for structural RC members. Recently, Grammatikou et al. [7] proposed ultimate strains and comparing estimations computed from these strains with experimental ultimate curvatures, stated that the proposed expression exhibit much less scatter than those obtained from arbitrary ultimate strains specified in the mentioned codes. They also stated that these code predictions are, in general, unsafe.Fig. 11(a) compares the cal-culated core outerfiber strains with TSC-Draft[6]requirements. It is concluded that 39% of specimens, which are subjected to high axial load and have aspect ratio greater than 6, are at the unsafe zone when code limits compared with calculated strain values. Moreover, concrete strain capacity of columns are significantly underestimated. As seen Fig. 11(b) CEN predicts the ultimate strain capacity of nearly half of the
column database on the unsafe side.Fig. 11(c) shows that when ex-treme concretefiber strain of compression zone given by Eq.(7)were evaluated by using calculated strain values, majority of column speci-mens (83%) are in the safe zone. However, the problem for estimating deformation capacity of columns under high axial load level and with high aspect ratio still persists (P/Agfc> 0.45 and L/h > 6).
4.2. Relationship of column design parameters with deformation criteria
Scatter plots inFig. 12display the relation between the deformation measures at ultimate damage state and column design parameters such as the transverse reinforcement ratio, column aspect ratio, axial load ratio and concrete compressive strength. These column design para-meters are used to calculate column deformation capacities in codes and proposed equations. As seen in Fig. 12, when transverse re-inforcement ratio, column compression strength and axial load ratio are increased, the deformation capacities of RC columns decrease. This The best correlation, although the relationship is not very strong, between the design parameters and the deformation capacities were observed for column aspect ratio, which is also related to the shear stress on column, and axial load ratio. The confinement reinforcement ratio does not display the expected correlation trend due to high values attained by this parameter, since above a threshold value the confinement effect cannot be distinguished on the column response where other effects become more dominant.
It is well- known that level of confinement has an important role in determining deformation capacity of RC members. It is seen in thefirst column ofFig. 12that for transverse reinforcement ratio (ρs) less than
0.007,ρshas an apparent effect on the concrete strain capacity.
How-ever, in the cases whereρsgreater than 0.007, no correlation can be
observed between theρsand deformation capacity of columns. For
in-stance, a 500 × 500 mm column with 10 mm diameter bars at 100 mm spacing providing four stirrup legs in the considered direction as con-finement reinforcement has a concon-finement ratio of 0.007 and is
Fig. 9. Comparison of calculated and proposed plastic rotation capa-cities: (a) ASCE/SEI 41 limits; (b) Eq.(9)proposed by Haselton et al.
[4]. The blue-empty circles are the model estimations plotted against the experimental plastic rotations at the horizontal axis.
Fig. 10. Comparison of total chord rotation limits from (a) CEN[1], Eq.(4), (b) Panagiotakos and Fardis[3], Eq. (6) and (c) Elwood and Moehle[8], drift ratio using Eq.(8)with FEA results.
considered as well confined column according to codes[5,6]. Nearly half of the columns used in this study have transverse reinforcement ratio more than 0.007 and because of thatρsbecome an insignificant
regression variable when high values is attained by this parameter. Aspect ratio (L/h) and axial load ratio (P/Po) have a negative effect
on the deformation capacity. Column axial load ratio, confinement ratio and aspect ratio are found to be the parameters that correlates best with the deformation capacities for studied column set.
Previous studies and this study show that rotation and curvature are more reliable and stable deformation criteria than column externalfiber strains whenFigs. 9–11are compared among each other. Second and third columns ofFig. 12shows that the strongest correlation between the parameters (axial load and aspect ratio) and the deformation measures is achieved for curvature and rotation as also mentioned in the discussion of existing limits given above. The trends in Fig. 12 displays that steel tensile strains can be estimated satisfactorily. It is also concluded that recently proposed equations increased accuracy of compressive strain estimations, yet the equations caps the limits for large values. Another result of this study is that the calculated force-displacement curves matches perfectly with conforming confinement column tests under low-to-moderate axial load ratio.
4.3. Empirical expression for ultimate concrete strain
It was displayed that the existing relations for plastic rotation yields conservative and satisfactory prediction of damage limits in perfor-mance assessment of RC columns. On the other side, there is still a room for further improvement for strain limits. Regression analysis used to develop an improved expression for ultimate concrete strains. Confinement effectiveness factor, transverse reinforcement ratio, con-crete compressive strength, longitudinal reinforcement yield strength and aspect ratio are important parameters in predicting the deforma-tion capacity of members.
Confinement effect on concrete ultimate compressive strain is re-flected inFig. 13(a) and an expression for concrete strain was derived on the basis of confinement effect. The dataset was organized graphi-cally to reflect the effect of different parameters on the ultimate com-pressive strain capacity of reinforced concrete columns. As clearly seen in Fig. 13(a), the ultimate strain capacity increases with increasing transverse reinforcement ratio up to 0.007. After this value the ultimate strain capacity seemed to be capped and whenρs> 0.007 the ultimate
strain capacity displays considerable variation depending on other parameters. To perform detailed analysis of other coexisting conditions and discard possible interactions that leads to such observation the data is grouped according to ultimate strain value in theρs> 0.007 range.
In the ρs< 0.007 range (36 specimens) the average concrete
strength is 29.5 MPa with 43.6 MPa maximum. The average column aspect ratio (L/h) is 3.58 with standard deviation of 0.9 and only one data point has an aspect ratio 7.64 in this region. Excluding this value (Specimen No. 29) from dataset reduces the standard deviation to 0.6.
The average axial load ratio is 0.18 with standard deviation of 0.137. As outliers, if specimens No38, 41, 44, 56 are excluded, the mean and standard deviation for axial load ratio becomes 0.14 and 0.0085 re-spectively. So, the properties of columns in this range can be sum-marized as made of normal strength concrete, under low to moderate axial load ratios (P/Po< 0.25) and have medium aspect ratios, L/
h∼ 3.5.
It was also seen that the confinement effectiveness factor α is a good parameter to estimate the concrete compressive strain capacity in ρs< 0.007. From the regression analysis, the coefficient of
determi-nation R2of the trendline ofα-εcuis 0.79 compared to 0.66 ofρs-εcu
trendline. This parameter besides including the transverse reinforce-ment spacing s, also reflects the effect of distance between longitudinal rebars on the confinement effectiveness, especially when the transverse reinforcement ratio is low. Inρs< 0.007 region,α takes values between
0.19 and 0.83.
In theρs> 0.007 range the properties of data in each group is
summarized in Table 4. According to this table increasing concrete strength in the high strength concrete range, increasing axial load and increasing column aspect ratio leads to decrease in the deformation capacity of columns. Although Group I attains slightly higher values for axial load ratio and concrete strength values compared toρs< 0.007
range, it displays similar deformation characteristics, but the strain capacity is limited to 0.03 approximately. The primary reason of re-duced strain capacity between Group I and II is seem to be increased concrete strength. When Group II and III is compared it is seen that both aspect ratio and axial load ratio increases leading to reduced strain capacities. Among the column properties, only L/h displays a consistent trend with strain values in all the groups. Inρs> 0.007 region,
con-finement effectiveness factor α takes values between 0.61 and 0.82, covering a narrow range.
Alternative equation for predicting ultimate compressive strain of extremefiber of reinforced concrete section is given by Eq.(10). The form of Eq.(7)was adopted for the proposed equation for predicting concrete strain capacity depending on the observed trends for ρs< 0.007. Forρs> 0.007 since the best parameter seen to be the
column aspect ratio, an expression is derived based on this parameter. Inclusion of concrete strength and axial load ratio did not make any improvement over the estimation capacity of the basic equation. Pre-dictions are compared with FEM results inFig. 13(b). The results show a clear dispersion around the mean trends. The errors in prediction normalized with respect to actual values (εcu_Eq-εcu_ave)/εcu_avedisplay
nearly equal dispersion on both sides of the mean trend. The predictions deviate from the actual values by 23% and 18% in average on the overestimation and the underestimation sides, respectively. If the pre-dicted values reduced by Cc= 0.80 (default value is 1.0 giving mean
prediction), Eq.(10)can be used as lower bound codified performance assessment limits.
= ⎧ ⎨ ⎩ + ⩽ > ⎫ ⎬ ⎭ < − ε C for ρ C e for ρ (0.0035 0.11 ) 0.007 (0.0675 ) 0.007 0.035 cu c αρ f f s c 0.355 /L h s s yw c (10) where fcand fyware the concrete compressive strength (in MPa) and the
stirrup yield strength (in MPa), ρs is volumetric ratio of transverse
reinforcement,α is the confinement effectiveness factor, L and h is the distance from critical section to point of contra-flexure and section depth of the column, respectively.
5. Conclusion
Besides traditionally used plastic rotation limits, local deformation measures like strain and curvature began to gain acceptance as per-formance criteria due to developments in the computational field especially owing to nonlinear modelling with fiber-based elements. There are various studies investigating the predictability and reliability of these measures as damage limit mainly employing statistical eva-luation of experimental data. However, the strains and curvatures are rarely available from experiments impeding thorough evaluation of strain-based criteria. This study using nonlinearfinite element model-ling strategy investigates deformation measures calculated on 69 ex-perimental column specimens. Depending on the results of investiga-tion, the following conclusions were derived,
•
Thefinite element modelling strategy used in this study yields sa-tisfactory estimations of the peak experimental results. The models predicted the lateral load capacity with a minor dispersion (R-squared 0.99). The regression model for ultimate drift gives 0.80 variance while for plastic rotation this value is 0.77.•
The plastic zone over the column length extends over a region ap-proximately slightly higher than the column depth h. The plastic hinge length taken as h/2 yields acceptable estimations of plastic rotations and tip displacements.•
Another important conclusion is in regards to the determination of strains in experimental and analytical studies. The actual strains calculated or measured at a single point or on a very limited region is obviously greater than the average values of strains calculated over a larger region. The average core outerfiber concrete strains are approximately 1.3 times higher than the pointwise maximum values at the same location. The difference between the core and cover average strains isεcu,ave_cover= 1.17εcu,ave. Variation of strainin different locations and lengths exhibits the need of using con-sistent length in analyses and experiments in order to directly compare the results.
•
Comparison of average steel and concrete strains fromfinite element analyses calculated over plastic hinge length (h/2) and section analyses yields very close correlation between the results of both analyses (R-squared displaying the variance equals 0.92 and 0.98 forconcrete and steel strains, respectively). The use of gage length h/2 in analyses and for measurement in tests is recommended for direct interpretation of the experimentally determined section deformation capacity with section analysis.
•
In general, plastic rotation appear to be more stable and predictable parameter than the concrete ultimate strain. Calculated results are mostly conservative in terms of plastic rotation limits as re-commended in ASCE/SEI 41[2]and by Eq.(9) [7]except columns under high axial load and made of high strength concrete. Haselton et al.’s[7]proposal significantly improve ASCE/SEI 41 limit defi-nitions, yet also increasing the variability and possibility of esti-mating the plastic rotation capacity on the unsafe side. Their equation provides a larger room for the plastic rotation at the capped region for ASCE/SEI 41. Chord rotation angle limits sug-gested by CEN (Eq.(4)) and Eq.(6) [3]are ineligible to determine deformation capacity of columns.•
TSC-Draft, CEN and Grammatikou et al.[7]set deformation limits in respect of concrete strain for RC columns. Expression of Gramma-tikou et al.[7]given in Eq.(7)is the most accurate one, but for columns under high axial load, having large aspect ratio and made of high strength concrete the estimations need to be improved.•
Investigating the effect of different design parameters on the columndeformation capacity revealed that the volumetric ratio of the confinement reinforcement when become greater than 0.007 lose to correlate with the increased ductility capacity. Factors such as the applied loading regime, axial load level and distinct brittle behavior of high strength concrete may be accountable for this observation, nevertheless the existence of large amount of confinement re-inforcement should not be interpreted as the indication of high ductility capacity of the member. The column aspect ratio L/h found to be the most effective parameter correlating with the compressive strain capacity in the high confinement range.
•
It is clearly seen that the damage limit expressions in existing reg-ulations and previous studies partially satisfy the need for being a reliable deformation measure as a damage limit. Based on a form similar to the Eq.(7)proposed by Grammatikou et al.[7]a concrete core ultimate strain prediction equation is developed to assess the structural performance of the RC columns. It is observed that the new formula is highly efficient when compared to existing strain equations and proposed formula can be used as a code performance assessment limit using a reduction factor of 0.8.As a concluding remark, the authors of this study think that the experimental studies are indispensable to the understanding of the behavior of reinforced concrete members. On the other hand, compu-tational methods may produce considerable insight to the behavior of structural elements where it is difficult to measure local response and enables obtaining results that are more consistent among themselves by conducting large amount of analyses using several variables.
Fig. 13. (a) Effect of transverse reinforcement ratio on concrete strain; (b) comparison of calculated and estimated concrete strains using Eq.(10).
Table 4
Mean and standard deviation (μ ± σ) of different column parameters for ρs> 0.007 range.
Group No L/h P/Po fc(MPa) εcu
I (13 specimen) 2.8 ± 0.65 0.27 ± 0.18 46.5 ± 19.9 0.0293 ± 0.0052 II (7 specimen) 3.25 ± 1.0 0.22 ± 0.14 65 ± 15.5 0.0170 ± 0.003 III (13 specimen) 5.45 ± 0.92 0.43 ± 0.12 66 ± 18.5 0.0084 ± 0.0029
Acknowledgements
This research is supportedfinancially by Turkish National Science Foundation, TUBITAK Project No: 113M442.
References
[1] CEN (European Committee for Standardization). Design of structures for earthquake resistance. Part 3: Assessment and retrofitting of buildings. Eurocode 8, EN 1998-3. Brussels: Comite Europeen de Normalisation; 2005.
[2] ASCE. Seismic rehabilitation of existing buildings. ASCE/SEI 41–13; 2013, Reston, VA.
[3] Panagiotakos TB, Fardis MN. Deformations of RC members at yielding and ultimate. ACI Struct J 2001;98(2):135–48.
[4] Haselton CB, Liel AB, Taylor LS, Deierlein GG. Beam-column element model cali-brated for predictingflexural response leading to global collapse of RC frame buildings. PEER Rep. No. 2007/03. Berkeley: Pacific Engineering Research Center, Univ. of California; 2008.
[5] TSC. Turkish seismic design code for buildings: Specification for structures to be built in disaster areas. Ministry of Public Works and Settlement, Ankara, Turkey, 2007.
[6] TSC-Draft. Turkish seismic design code for buildings. Ankara, Turkey: Ministry of Public Works and Settlement; 2016.
[7] Grammatikou S, Biskinis D, Fardis MN. Ultimate strain criteria for RC members in monotonic or cyclicflexure. J Struct Eng 2016;142(9). 04016046-1-13. [8] Elwood KJ, Moehle JP. Idealized backbone model for existing reinforced concrete
columns and comparisons with FEMA 356 criteria. Struct Des Tall Spec Build 2006;15(5):553–69.
[9] Acun B, Sucuoğlu H. Performance of reinforced concrete columns designed for flexure under severe displacement cycles. ACI Struct J 2010;107(3):364–71. [10] Bae S, Bayrak O. Drift capacity of reinforced concrete columns. ACI Struct J
2009;106(4):405–15.
[11] Kazazİ. Analytical study on plastic hinge length of structural walls. J Struct Eng 2013;139(11):1938–50.
[12] Kazazİ, Gülkan P, Yakut A. Deformation limits for structural walls with confined boundaries. Earthq Spectra 2012;28(3):1019–46.
[13] Kazazİ, Gülkan P, Yakut A. Performance limits for structural walls: an analytical perspective. Eng Str 2012;43:105–19.
[14] Elwood KJ, Matamoros AB, Wallace JW, Lehman DE, Heintz JA, Mitchell AD, et al. Update to ASCE/SE 41 concrete provisions. Earthq Spectra 2007;23(3):493–523. [15] Elwood KJ, Moehle JP. Drift capacity of reinforced concrete columns with light
transverse reinforcement. Earthq Spectra 2005;21(1):71–89.
[16] Berry M, Parrish M, Eberhard M. PEER Structural performance database user’s manual. Berkeley, CA: Pacific Engineering Research Center, Univ. of California; 2004.
[17] ANSYS 14.5 [Computer software]. Canonsburg, PA, Ansys.
[18] Kazaz I. Dynamic characteristics and performance assessment of reinforced concrete structural walls Ph.D. Thesis Ankara, Turkey: Civil Engineering Dept., Middle East Technical University; 2010.
[19] Saatcioglu M, Razvi SR. Strength and ductility of confined concrete. J Struct Eng (ASCE) 1992;118(6):1590–607.
[20] Willam KJ, Warnke ED. Constitutive model for the triaxial behavior of concrete. Int Assoc Bridge Struct Eng Proc 1975;19:174–203.
[21] Dhakal RP, Maekawa K. Modeling for postyield buckling of reinforcement. J Struct Eng (ASCE) 2002;128(9):1139–47.
[22] Eligehausen R, Popov EP, Bertero VV. Local bond stress-slip relationships of de-formed bars under generalized excitations. Rep. No. UCB/EERC 83–23. Berkeley, CA: Earthquake Engineering Research Center, Univ. of California; 1983.
[23] Corley WG. Rotational capacity of reinforced concrete beams. J Struct Div, ASCE 1966;92(ST5):121–46.
[24] Mattock AH. Rotational capacity of hinging regions in reinforced concrete beams. Farmington Hills, MI: American Concrete Institute; 1964;SP-12:143–81. [25] Park R, Priestley MJ, Gill WD. Ductility of square confined concrete columns. J
Struct Div, ASCE 1982;108(ST4):929–50.
[26] Paulay T, Priestley MJN. Seismic design of reinforced concrete and masonry buildings. New York: John Wiley and Sons NY, USA; 1992.
[27] Bayrak O, Sheikh SA. Confinement reinforcement design considerations for ductile
HSC columns. J Struct Eng 1998;124(9):999–1010.
[28] Bae S, Bayrak O. Plastic hinge length of reinforced concrete columns. ACI Struct J 2008;105(3):290–300.
[29] Saatcioglu M, Ozcebe G. Response of reinforced concrete columns to simulated seismic loading. ACI Struct J 1989;86(1):3–12.
[30] Priestley MJN, Calvi GM, Kowalsky MJ. Displacement-based seismic design of structures. Pavia, Italy: IUSS Press; 2007.
[31] Ohno T, Nishioka T. An experimental study on energy absorption capacity of col-umns in reinforced concrete structures. Proc JSCE, Struct Eng/Earthquake Eng JSCE 1984;1(2):23–33.
[32] Montejo LA. Set of codes for the analysis of reinforced concrete members Ph.D. dissertation Raleigh, NC: Dept. of Civil, Construction and Environmental Engineering, North Carolina State Univ.; 2007.
[33] Ludovico DM, Verderame G, Prota A, Manfredi G, Cosenza E. Cyclic behavior of nonconforming full-scale RC columns. J Struct Eng 2014;140(5):04013107. [34] Bayrak O, Sheikh, S. Confinement steel requirements for high strength concrete
columns. In: Proc., 11th World Conf. on earthquake engineering, Aculpulco, Mexico, Paper No. 463; 1996.
[35] Saatcioglu M, Grira M. Confinement of reinforced concrete columns with welded reinforcement grids. ACI Struct J 1999;96(1):29–39.
[36] Xiao Y, Yun HW. Experimental studies on full-scale high-strength concrete columns. ACI Struct J 2002;99(2):199–207.
[37] Bayrak O, Sheikh S. Design of rectangular HSC columns for ductility. Special Publ ACI Struct J 2003;213:61–82.
[38] Imai H, Yamamoto Y. A study on causes of earthquake damage of izumi high school due to miyagi-ken-oki earthquake in 1978. Trans Japan Concr Inst 1986;8:405–18. [39] Tanaka H, Park R. Effect of lateral confining reinforcement on the ductile behavior of reinforced concrete columns. Rep. 90-2. Christchurch, New Zealand: Dept. of Civil Engineering, Univ. of Canterbury; 1990.
[40] Park R, Paulay T. Use of interlocking spirals for transverse reinforcement in bridge columns. Strength and ductility of concrete substructures of bridges, RRU (Road Research Unit). Bulletin 1990;84(10):77–92.
[41] Nosho K, Stanton J, MacRae G. Retrofit of rectangular reinforced concrete columns using tonen forca tow sheet carbonfiber wrapping. Rep. No. SGEM 96-2. Washington: Department of Civil Engineering, Univ. of Washington, SE; 1996. [42] Wehbe N, Saiidi MS, Sanders D. Confinement of rectangular bridge columns for
moderate seismic areas. National Center for Earthquake Engineering Research (NCEER) Bulletin 1998;12(1).
[43] Lynn AC, Moehle JP, Mahin SA, Holmes WT. Seismic evaluation of existing re-inforced concrete building columns. Earthq Spec 1996;12(4):715–39.
[44] Xiao Y, Martirossyan A. Seismic performance of high strength concrete columns. J Struct Eng 1998;124(3):241–51.
[45] Mo YL, Wang SJ. Seismic behavior of RC columns with various tie configurations. J Struct Eng 2000;126(10):1122–30.
[46] Arai Y, Hakim B, Kono S, Watanabe F. Damage assessment of reinforced concrete columns under high axial loading. ACI Special Publ 2006;237:165–76. [47] Takemura H, Kawashima K. Effect of loading hysteresis on ductility capacity of
bridge piers. J Struct Eng 1997;43A:849–58. [in Japanese].
[48] Sezen H, Moehle J. Strength and deformation capacity of RC columns with limited ductility. In: Proc., 13th WCEE, Vancouver, Canada; 2004.
![Fig. 2. Finite element model of RC column specimen tested by Ohno and Nishioka [31] displaying the necessary components of deformation calculations.](https://thumb-eu.123doks.com/thumbv2/9libnet/3909302.44938/5.892.174.691.737.1071/finite-specimen-nishioka-displaying-necessary-components-deformation-calculations.webp)
![Fig. 4 (a) displays the experimental load-deformation curve for a typical tested column by Saatcioglu and Ozcebe [29] and FEA analysis results](https://thumb-eu.123doks.com/thumbv2/9libnet/3909302.44938/6.892.68.828.704.1077/displays-experimental-deformation-typical-saatcioglu-ozcebe-analysis-results.webp)

![Fig. 11. Comparison between concrete strains of FEA and proposed limits: (a) Eq. (3) , TSC-Draft [6] ; (b) Eq](https://thumb-eu.123doks.com/thumbv2/9libnet/3909302.44938/10.892.131.767.82.287/fig-comparison-concrete-strains-fea-proposed-limits-draft.webp)

