Children and Adolescents Between 11 and 18 Years of Age
Mehmet Kenan Kanburoglu MD, Fevzi Murat Ozdemir,
Secil Ozkan MD, and Fatma Sedef Tunaoglu MD
INTRODUCTION: Normal values of the 6-min walk distance (6MWD) for children have not been well demonstrated. This limits the interpretation of the 6MWD in children. METHODS: A cross-sectional prospective study was designed. A total of 949 (467 males, 482 females) healthy children were recruited randomly from 7 Turkish secondary schools in Ankara. The 6-min walk tests were conducted according to the American Thoracic Society guidelines. RESULTS: The mean 6MWD decreased between the ages of 12 and 14 y for both boys and girls, and then gradually increased until 17 y of age. In the best fitting and most efficient linear, quadratic, and categorical regression models, the age of the subjects, heart rate after the test, and physical activity level of the subjects were significantly related to the 6MWD. Nevertheless, these variables explained < 20% of the variance in the 6MWD. CONCLUSIONS: The 6MWD does not increase in a straight linear fashion from the age of 12 until adulthood. Correlation of the 6MWD with anthropometric features is very weak, so in evaluating the 6MWD, the standard curves should be used. Key words: child; exercise
capacity; exercise test; obesity; physical activity. [Respir Care 2014;59(9):1369 –1375. © 2014 Daedalus Enterprises]
Introduction
The 6-min walk test (6MWT) measures the distance that a participant can walk as far as possible along a 30-m corridor in a period of 6 min. It is easy to perform, can be repeated at a low cost, and is unlike laboratory-based tests of exercise tolerance that require technical expertise and sophisticated equipment.1 Participants exert submaximal
effort while performing the 6MWT; thus, the 6MWT closely resembles the patient’s ability to perform daily activities2
and correlates well with formal measures of quality of life.3
The 6MWT is increasingly used on healthy children and children with pulmonary hypertension,4congenital cardiac
diseases,5cystic fibrosis,6 interstitial lung disease,7
juve-nile idiopathic arthritis,8 obesity,9 cerebral palsy,10
end-stage renal disease,11 hemophilia,7 and spina bifida,7 as
well as those waiting for cardiac and lung transplanta-tion.12Nevertheless, normal values of the 6-min walk
dis-tance (6MWD) for children vary greatly according to different studies and countries.13-20 This limits the
inter-pretation of the 6MWD in children and poses problems for clinicians wishing to use the 6MWT in a research setting. We aimed to establish anthropometric specific reference values for the 6MWT in healthy children and adolescents between 12 and 18 y of age.
Methods
This cross-sectional study was conducted in Ankara, where there are 200,265 students between the ages of 12 and 18 y being educated in local schools. The proportional cluster sampling method was used, and the sample popu-lation was weighted according to the popupopu-lation density in
Dr Kanburoglu is affiliated with the Department of Pediatrics, Fatih University Medical School, Ankara; Mr Ozdemir is affiliated with the Department of Sport Sciences, Baskent University, Ankara; Dr Ozkan is affiliated with the Department of Public Health, Gazi University Medical School, Ankara; and Dr Tunaoglu is affiliated with the Department of Pediatric Cardiology, Gazi University Medical School, Ankara, Turkey. The authors have disclosed no conflicts of interest.
Correspondence: Mehmet Kenan Kanburoglu MD, Department of Pedi-atrics, Fatih University Medical School, Alparslan Turkes Bulvari 57, Bestepe/Yenimahalle, Ankara 06510, Turkey.
central and suburban areas in Ankara. A total of 1,112 students were recruited randomly from 7 selected schools (4 high schools, 3 primary schools).
The study protocol was reviewed and approved by the institutional human subjects research review board of Gazi Medical University and the institutional boards of the par-ticipating local schools. The study was conducted through the pediatric cardiology and public health departments of Gazi Medical University between March and April, 2010. Thirty-four intern medical doctors who were in rotation in the public health department carried out the study. Four resident medical doctors and one sport coach accompanied them as observers during the study to maintain the quality of the research.
Body mass index (BMI) values were plotted on the standard growth charts of the official Centers for Disease Control.21According to the subject’s age and sex, weight
status was categorized as obese if BMI was ⬎ 95th per-centile, overweight if BMI was between 85th and 95th percentiles, normal if BMI was between 5th and 85th per-centiles, and underweight if BMI was ⬍ 5th percentile.
6MWT Protocol
The intern medical doctors and the observers were given a 2-d training on how the study and 6MWT would be performed. The 6MWT was performed following the stan-dardized approach provided by the American Thoracic So-ciety guidelines,1except only one test was done per child,
because there is a high degree of test-retest reliability in pediatric population.9,22
The students were informed about the study and how to perform the 6MWT 1 d before the test. The 6MWTs were carried out during sports lessons before the beginning of the activity time, so all students were in sports clothes. The study was completed in 3 wks during nonrainy spring days. Altitudes of the schools were very similar, and all the tests were done on the asphalt surfaces of the school-yards.
Informed consent was obtained from both the subjects and their parents. Before the test, the height and weight of the subjects were measured without shoes using an elec-tronic scale (Seca 769, readability 100 g, capacity 200 kg; Seca, Chino, California) and a wall stadiometer (Seca 222, graduation 1 mm). Heart rate and sphygmomanometric blood pressure measurements were performed using the Omron M6 (HEM 711) blood pressure monitor (Omron, Kyoto, Japan).23 Cuff sizes of the sphygmomanometers
were appropriate for the sizes of the arms of the subjects. Subjects rated their baseline dyspnea and overall fatigue using the Modified Borg scale before and after the test.24,25
The test area was arranged over a length of 30 m and was marked every 3 m. Each end of the course had clearly identified turning points. The students sat on a chair for
5 min before the test. Observers measured the test time using stopwatches and said the same encouraging sen-tences as stated by the American Thoracic Society to the students every minute. At the end of the test, the 6MWD was calculated by adding the distance walked during pre-vious laps (number of laps⫻ 30 m) to the distance walked at the final lap by using a tape measure.
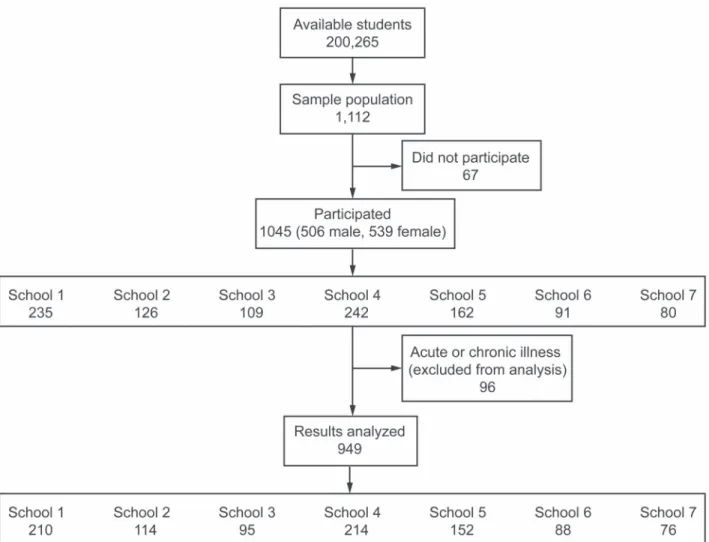
Sixty-seven of the 1,112 students opted not to join the test, and the remaining 1,045 (506 male, 539 female) stu-dents participated in the test. All of the participants and their parents were asked whether the participant had any acute or chronic illnesses. Ninety-six (9.18%, 39 male, 57 female) students had an acute respiratory infection or had a chronic respiratory, cardiac, or skeletal disease. These students were allowed to participate in the 6MWT so that any chance of social discrimination of unhealthy students by their peers was eliminated. However, their results were excluded from the final results of the study. In total, 949 (467 male, 482 female) healthy students were included in the data analysis (Fig. 1). At least one doctor certified in cardiopulmonary resuscitation with a minimum of basic life support and appropriate technical equipment was on hand at the test area.
Level of Physical Activity
The subjects were classified according to self-reported physical activity as very active (activityⱖ 30 min, 5 or more times/wk), active (activityⱖ 30 min, 3 or more times/wk), or sedentary (activity⬍ 30 min, or 3 times/wk) in the last 3 months.26None of the participants were
in-volved in any competitive sport.
Statistical Analysis
By defining the type-1 error probability (␣) as .05, power as 0.80, and SD of 6MWD as 2%; we calculated that 1,112
QUICK LOOK Current knowledge
The 6-min walk distance (6MWD) is an established method of determining exercise limitation in adults with chronic lung disease. Normal values of the 6MWD for children have not been well demonstrated, limiting the utility of the test in children.
What this paper contributes to our knowledge
The mean 6MWD decreases between the ages of 12 and 14 y but then gradually increases until age 17. The correlation of 6MWD with anthropometric features is very weak. The 6MWD cannot be predicted by using reference equations in pediatric ages.
students were needed in the study sample (PS 3.0.43 soft-ware by WD Dupont and WD Plummer).
Data are presented as mean⫾ SD for normally distrib-uted continuous variables, and as absolute or relative fre-quencies and percentage for categorical variables. Student t tests and analysis of variance with Tukey and least sig-nificant difference (LSD) post hoc tests were used for comparison of continuous variables. Frequencies were com-pared using chi-square analysis. Bivariate and partial cor-relation analyses were performed by parametric Pearson correlation. Percentile charts were constructed using the 5th, 25th, 50th, 75th, and 95th percentiles of the 6MWD for male and female subjects. R2values for multiple linear, quadratic, and categorical regression models were calcu-lated according to forward and backward stepwise selec-tion of possible independent predictors of the 6MWD si-multaneously for boys and girls with the use of standard regression techniques. However, only the best-fitting mod-els are presented. Significance levmod-els for all tests were established as a two-tailed P value⬍ .05. Descriptive
anal-ysis of data and analanal-ysis of variance were undertaken us-ing the Statistical Package for the Social Sciences (SPSS) 16.0 program (SPSS, Chicago, Illinois).
Results
From the 949 children (467 male, 482 female) analyzed, the number of individuals in each age group and school, gender distribution, weight, height, BMI, heart rate values before and after the test, 6MWD, and blood pressure val-ues before and after the test are given in Table 1. In no case was it necessary to stop the test prematurely, and there were no unexpected events during the tests.
Boys had a significantly higher 6MWD than girls
be-tween the ages of 12 and 17 y (P ⬍ .001). The mean
6MWD decreased to a nadir at 14 y of age and then grad-ually increased again until 17, where it continued to in-crease for girls but slightly dein-creased for boys until the age of 18 (Fig. 2). Correlation values (r) of the 6MWD with age and height were very similar: 0.23 and 0.22,
tively. We used age values to establish percentile charts of 6MWD, because there would be missing values if we chose height instead. The percentile graphics and numeric per-centiles for the 6MWD according to sex and age groups are depicted in Figures 3 and 4.
The 6MWD significantly correlated with height, weight, BMI, heart rate before and after the test, modified Borg scales for fatigue and dyspnea after corrected for age; however, the calculated correlation (r) values were weak (Table 2). Correlation of the 6MWD with age was not directly linear (Fig. 2), so we calculated a curvilinear gression model by linear, quadratic, and categorical re-gression analysis. In the best-fitting models, age (P⬍ .001),
Table 1. Demographic, Anthropometric, Physical Features, and 6MWD of the Participants According to Age and Sex
Sex Age (y) 6MWD (m) Weight (kg)* Height (cm)* BMI (kg/m2)*
Before Test After Test
Pulse (beats/min) BP (mm Hg) Pulse (beats/min) BP (mm Hg)
n Mean⫾ SD Min Max Systolic Diastolic Systolic Diastolic
Female 12 108 604⫾ 77 300 750 46⫾ 10 152 ⫾ 7 19.92 ⫾ 3.6 91⫾ 15 101⫾ 11 67 ⫾ 10 105⫾ 17 104 ⫾ 13 66 ⫾ 12 13 54 537⫾ 79 360 710 51⫾ 10 158 ⫾ 6 20.39 ⫾ 3.5 88⫾ 11 102⫾ 14 65 ⫾ 10 97⫾ 13 105 ⫾ 12 67 ⫾ 9 14 63 502⫾ 88 330 740 57⫾ 11 161 ⫾ 6 21.83 ⫾ 3.8 87⫾ 14 105⫾ 11 66 ⫾ 10 98⫾ 15 109 ⫾ 10 70 ⫾ 8 15 95 508⫾ 99 360 810 55⫾ 10 162 ⫾ 6 20.82 ⫾ 3.2 81⫾ 12 111⫾ 11 70 ⫾ 11 99⫾ 17 110 ⫾ 11 69 ⫾ 11 16 90 516⫾ 92 345 840 58⫾ 8 164⫾ 6 21.56 ⫾ 2.9 84⫾ 15 106⫾ 13 67 ⫾ 11 94⫾ 17 110 ⫾ 11 70 ⫾ 10 17 48 541⫾ 103 366 850 56 ⫾ 9 162⫾ 6 21.40 ⫾ 3.3 86⫾ 12 108⫾ 17 70 ⫾ 12 95⫾ 16 107 ⫾ 16 68 ⫾ 13 18 9 561⫾ 92 420 660 54⫾ 10 162 ⫾ 7 20.67 ⫾ 3.1 91⫾ 15 112⫾ 10 71 ⫾ 16 97⫾ 12 108 ⫾ 11 70 ⫾ 14 Male 12 112 608⫾ 95 312 840 48⫾ 11 151 ⫾ 7 20.76 ⫾ 3.7 89⫾ 13 101⫾ 11 66 ⫾ 8 101⫾ 15 104 ⫾ 10 69 ⫾ 9 13 42 586⫾ 89 444 870 50⫾ 12 157 ⫾ 9 20.15 ⫾ 3.2 92⫾ 14 105⫾ 11 65 ⫾ 9 100⫾ 19 105 ⫾ 11 66 ⫾ 9 14 43 528⫾ 89 240 720 63⫾ 12 167 ⫾ 7 22.40 ⫾ 4.0 86⫾ 11 112⫾ 15 71 ⫾ 11 98⫾ 20 116 ⫾ 14 73 ⫾ 10 15 123 542⫾ 87 300 815 61⫾ 12 172 ⫾ 8 20.60 ⫾ 3.4 83⫾ 11 114⫾ 12 70 ⫾ 9 94⫾ 16 118 ⫾ 12 73 ⫾ 11 16 77 545⫾ 112 300 780 65 ⫾ 10 176 ⫾ 7 20.85 ⫾ 2.6 86⫾ 11 115⫾ 10 72 ⫾ 9 93⫾ 14 116 ⫾ 14 73 ⫾ 16 17 55 543⫾ 124 252 930 71 ⫾ 13 178 ⫾ 7 22.40 ⫾ 3.5 84⫾ 11 119⫾ 10 75 ⫾ 9 92⫾ 16 119 ⫾ 16 76 ⫾ 14 18 30 541⫾ 109 363 735 70 ⫾ 11 177 ⫾ 8 22.47 ⫾ 2.7 83⫾ 10 118⫾ 8 76⫾ 9 92⫾ 17 115 ⫾ 14 73 ⫾ 10 * Mean⫾ SD.
6MWD⫽ 6-min walk distance BMI⫽ body mass index BP⫽ blood pressure
Fig. 2. Mean 6-min walk distance (6MWD) according to age and sex.
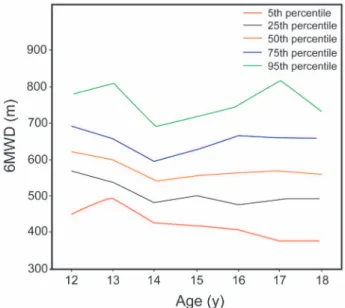
Fig. 3. Percentiles for 6-min walk distance (6MWD) in boys, ac-cording to age.
age2(P⬍ .001), heart rate after the test (P ⬍ .001), and
physical activity levels (P ⬍ .001) of the subjects were significantly related with the 6MWD; nevertheless, these variables explained about only 19% of the variability of the 6MWD in boys and 13% in girls. Height, weight, and BMI did not have significant influence on the 6MWD in regression analysis.
Most of the females had a sedentary lifestyle, whereas boys were more active (chi-square test, P⬍ .01) (Table 3). The 6MWD was significantly different according to fre-quency of physical activity; students with sedentary life styles had shorter 6MWD results than very active students
(male P ⫽ .003, female P ⫽ .09). The 6MWD was not
significantly different between active and very active stu-dents.
A total of 6.5% of the subjects were obese, 15.7% of them were overweight, and 3.5% of them were under-weight. The mean 6MWD was not statistically different according to obesity status of the subjects (P⫽ .64).
Discussion
A wide range of reference values of the 6MWT for children between the ages of 12 and 18 y have been re-ported in previous studies.13,15,17,20Nevertheless, only one
of them (Ulrich et al)20gave age-by-age reference values
(Table 4). This study along with ours demonstrated a de-cline in the 6MWD after the age of 12; however, both the decline and resurrection of the 6MWD were more obvious in our study.
The fact that 6MWD results do not linearly increase with age was an unpredictable finding. This may be due to the ever-changing hormones and energy levels or the discrepancy of inner motivation of teenagers at different ages.27During a self-paced test, the motivation of the
par-ticipant is of paramount importance.1 The motivational
aspects during the 6MWT have not been assessed, and no qualifying criteria for a 6MWT in children have been de-fined. The heart rate variation in our study was lower than previous studies, which may also be due to motivational discrepancies.13,15
Table 2. Partial Correlation Values (r) of 6MWT With Anthropometric Measurements, Corrected for Age
Male P Female P
Height (m) ⫺0.21 ⬍ .001* ⫺0.15 .001*
Weight (kg) ⫺0.20 ⬍ .001* ⫺0.13 .004*
BMI (kg/m2) ⫺0.14 .003* ⫺0.09 .05
HRrest(beats䡠 min⫺1) 0.12 .009* 0.12 .011*
HRpost(beats䡠 min⫺1) 0.11 .014* 0.22 ⬍ .001*
⌬HR (beats 䡠 min⫺1) 0.01 .823 0.15 ⬍ .001*
MBSf,rest ⫺0.19 ⬍ .001* ⫺0.19 ⬍ .001*
MBSf,post ⫺0.17 ⬍ .001* ⫺0.21 ⬍ .001*
MBSd,rest ⫺0.11 .014* ⫺0.14 .002*
MBSd,post ⫺0.14 .003* ⫺0.18 ⬍ .001*
* Pearson correlation (467 male, 482 female), P⬍ .05. 6MWT⫽ 6-min walk test
BMI⫽ body mass index
HRrest⫽ heart rate at rest, before 6MWT
HRpost⫽ heart rate after 6MWT
⌬HR ⫽ HRpost⫺HRrest
MBSf,rest⫽ modified Borg scale, fatigue before 6MWT
MBSf,post⫽ modified Borg scale, fatigue after 6MWT
MBSd,rest⫽ modified Borg scale, dyspnea before 6MWT
MBSd,post⫽ modified Borg scale, dyspnea after 6MWT
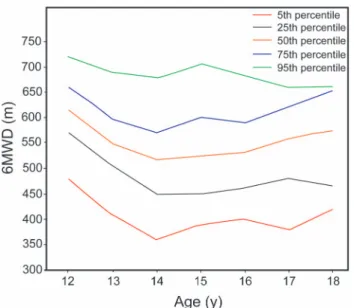
Fig. 4. Percentiles for 6-min walk distance (6MWD) in girls, ac-cording to age.
Table 3. 6MWD According to Frequency of Physical Activity Frequency of Physical Activity
Sedentary Active Very Active % 6MWD (m)* % 6MWD (m)* % 6MWD (m)* Male 33.4 542⫾ 97 26.6 562⫾ 103 40.0 575⫾ 107 P† .10‡ .003§ .10‡ .003§ Female 60.5 530⫾ 92 21.0 549⫾ 96 18.5 550⫾ 107 P† .09‡ .09‡ .09§ .09§ * Mean⫾ SD.
† P values were calculated by using analysis of variance and least significant difference post hoc test.
‡ Sedentary and Active. § Sedentary and Very Active. 6MWD⫽ 6-min walk distance
Sedentary⫽ self-reported physical activity: ⬍ 30 min, or 3 times/wk Active⫽ self-reported physical activity: ⱖ 30 min, ⱖ 3 times/wk Very Active⫽ self-reported physical activity: ⱖ 30 min, ⱖ 5 times/wk26
The decline in the 6MWD between the ages of 12 and 14 y is especially important for patients with chronic con-ditions, because, according to our results, it may be due to an expected phenomenon rather than deterioration caused by the primary disease.
According to our results, the correlation of the 6MWD with height, weight, and BMI is not sufficient to recom-mend routine usage of predictive equations. Instead, the present study provides new 6MWD standard curves that can be used in the care of pediatric patients between the ages of 12 and 18 y. It is frequently proposed that predic-tive equations derived from anthropometric measurements may be used to estimate 6MWD.14,22,28In most of these
studies, the predictive equations show a high variability in their predictive power.
To prevent discrepancies between nations, Li et al15
suggested using height-specific standards for the 6MWT. However, age and height were equally correlated with the 6MWD in our study, and the reference values reported by Li et al were not the exact values; instead, they were constructed using the maximum penalized likelihood LMS method.
The 6MWD does not differ between active and very active students, even though it is significantly different between sedentary and very active students. This finding supports the basic feature of the 6MWT, which is that it assesses the submaximal level of functional capacity, and most of the patients do not achieve maximal exercise ca-pacity during the 6MWT.1For the same reason, if a child
has a result lower than the corresponding 5th percentile, a treadmill exercise test will be needed to reveal the under-lying mechanism. In children who are moderately or se-verely impaired, the 6MWT represents a maximal exercise test.29A less detailed analysis of physical activity by Ben
Saad et al17also showed that sports activity significantly
affected the 6MWD.
Due to the selection method of the students and the sociocultural reasons which permits girls to start and finish school earlier, the number of 18-y-old girls was limited to 9. Therefore, the reliability of the reference value for this age for girls is less than the other age groups. Furthermore, we could not evaluate the pubertal status of the students due to cultural restrictions.
Our results presented a small inverse correlation of body weight with distance walked (Table 2). Even so, we did not find any relationship between the obesity and the 6MWD, although it was shown that obese children and adolescents have shorter 6MWD than normal subjects.9It
may be due to the fact that the prevalence of overweight children in our study sample (girls 14.8%, boys 16.0%) was lower than that of the expected prevalence of this condition in Europe (girls 28%, boys 31.7%) and in the United States (girls 16%, boys 18.2%).30,31
All the observers who carried out the 6MWT were vol-unteers from among interns. Although, we tried to dimin-ish inter-rater variability as much as possible by perform-ing pretest education and controllperform-ing the observers individually by one of the writers, the study may still possess a bias.
We performed only one 6MWT per child. In an adult population, it has been shown that there might be a train-ing effect, and a longer distance might be reached on repeated tests.32However, there is a high degree of
test-retest reliability in pediatric populations.9,22 Moreover,
Priesnitz et al16reported that most of the participants in
their study walked longer distances during the first test than during the second. There was a high variability in 6MWD, which may limit the use of reference values. Be-cause all of our subjects were healthy, we believe that 5th percentile may be used as a cutoff value. Further studies are needed in this regard.
To the best of our knowledge, this is the largest study that gives reference values of the 6MWD for individual age groups in children between 12 and 18 y of age.
Conclusions
The mean 6MWD decreases between the ages of 12 and 14 y but then gradually increases until the age of 17. Correlation of the 6MWD with anthropometric features is very weak; thus, the 6MWD cannot be predicted by using reference equations in pediatric ages. When evaluating 6MWT results, standard curves should be used.
ACKNOWLEDGMENTS
We thank the intern doctors for their intense effort and help in this study. Table 4. Studies That Have Reported Reference Values for 6MWT
in Children 11–18 y of Age Age
(y) n Country, Year Results Li et al15 7–16 1,445 China, 2007 Height-specific values
Geiger et al13
3–18 528 Austria, 2007 Age-specific, categorized into 5 groups (3–5, 6–8, 9–11, 12–15, 16 and older)
Ben Saad et al17
6–16 200 Tunisia, 2009 Reference equation established from regression analysis Ulrich et al20 5–17 496 Switzerland, 2013 Age-specific, age by age values Present study
12–18 949 Turkey, 2013 Age-specific, age by age values 6MWT⫽ 6-min walk test
REFERENCES
1. ATS Committee on Proficiency Standards for Clinical Pulmonary Function Laboratories. American Thorax Society statement: guide-lines for the six-minute walk test. Am J Respir Crit Care Med 2002; 166(1):111-117.
2. Solway S, Brooks D, Lacasse Y, Thomas S. A qualitative systematic overview of the measurement properties of functional walk tests used in the cardiorespiratory domain. Chest 2001;119(1):256-270. 3. Guyatt GH, Townsend M, Keller J, Singer J, Nogradi S. Measuring
functional status in chronic lung disease: conclusions from a ran-domized control trial. Respir Med 1991;85 Suppl B:17-21; discus-sion 33-37.
4. Maiya S, Hislop AA, Flynn Y, Haworth SG. Response to bosentan in children with pulmonary hypertension. Heart 2006;92(5):664-670. 5. Moalla W, Gauthier R, Maingourd Y, Ahmaidi S. Six-minute walk-ing test to assess exercise tolerance and cardiorespiratory responses during training program in children with congenital heart disease. Int J Sports Med 2005;26(9):756-762.
6. Gulmans VA, van Veldhoven NH, de Meer K, Helders PJ. The six-minute walking test in children with cystic fibrosis: reliability and validity. Pediatr Pulmonol 1996;22(2):85-89.
7. Hassan J, van der Net J, Helders PJ, Prakken BJ, Takken T. Six-minute walk test in children with chronic conditions. Br J Sports Med 2010;44(4):270-274.
8. Paap E, van der Net J, Helders PJ, Takken T. Physiologic response of the six-minute walk test in children with juvenile idiopathic ar-thritis. Arthritis Rheum 2005;53(3):351-356.
9. Morinder G, Mattsson E, Sollander C, Marcus C, Larsson UE. Six-minute walk test in obese children and adolescents: reproducibility and validity. Physiother Res Int 2009;14(2):91-104.
10. Maher CA, Williams MT, Olds TS. The six-minute walk test for children with cerebral palsy. Int J Rehabil Res 2008;31(2):185-188. 11. Takken T, Engelbert R, van Bergen M, Groothoff J, Nauta J, van Hoeck K, et al. Six-minute walking test in children with ESRD: discrimination validity and construct validity. Pediatr Nephrol 2009; 24(11):2217-2223.
12. Yimlamai D, Freiberger DA, Gould A, Zhou J, Boyer D. Pretrans-plant six-minute walk test predicts peri- and post-operative outcomes after pediatric lung transplantation. Pediatr Transplant 2013;17(1): 34-40.
13. Geiger R, Strasak A, Treml B, Gasser K, Kleinsasser A, Fischer V, et al. Six-minute walk test in children and adolescents. J Pediatr 2007;150(4):395-399, 399 e391-392.
14. Lammers AE, Hislop AA, Flynn Y, Haworth SG. The 6-minute walk test: normal values for children of 4-11 years of age. Arch Dis Child 2008;93(6):464-468.
15. Li AM, Yin J, Au JT, So HK, Tsang T, Wong E, et al. Standard reference for the six-minute-walk test in healthy children aged 7 to 16 years. Am J Respir Crit Care Med 2007;176(2):174-180. 16. Priesnitz CV, Rodrigues GH, Stumpf Cda S, Viapiana G, Cabral CP,
Stein RT, et al. Reference values for the 6-min walk test in healthy children aged 6-12 years. Pediatr Pulmonol 2009;44(12):1174-1179. 17. Ben Saad H, Prefaut C, Missaoui R, Mohamed IH, Tabka Z, Hayot M. Reference equation for 6-min walk distance in healthy North
African children 6-16 years old. Pediatr Pulmonol 2009;44(4):316-324.
18. Tonklang N, Roymanee S, Sopontammarak S. Developing standard reference data for Thai children from a six-minute walk test. J Med Assoc Thai 2011;94(4):470-475.
19. Klepper SE, Muir N. Reference values on the 6-minute walk test for children living in the United States. Pediatr Phys Ther 2011;23(1): 32-40.
20. Ulrich S, Hildenbrand FF, Treder U, Fischler M, Keusch S, Speich R, Fasnacht M. Reference values for the 6-minute walk test in healthy children and adolescents in Switzerland. BMC Pulm Med 2013;13: 49.
21. Centers for Disease Control and Prevention NCfHS. CDC growth charts: United States 2000. http://www.cdc.gov/growthcharts/charts. htm. Accessed Nov 17, 2013.
22. Li AM, Yin J, Yu CC, Tsang T, So HK, Wong E, et al. The six-minute walk test in healthy children: reliability and validity. Eur Respir J 2005;25(6):1057-1060.
23. Midgley PC, Wardhaugh B, Macfarlane C, Magowan R, Kelnar CJ. Blood pressure in children aged 4-8 years: comparison of Omron HEM 711 and sphygmomanometer blood pressure measurements. Arch Dis Child 2009;94(12):955-958.
24. Borg GA. Psychophysical bases of perceived exertion. Med Sci Sports Exerc 1982;14(5):377-381.
25. Hommerding PX, Donadio MV, Paim TF, Marostica PJ. The Borg scale is accurate in children and adolescents older than 9 years with cystic fibrosis. Respir Care 2010;55(6):729-733.
26. Garber CE, Blissmer B, Deschenes MR, Franklin BA, Lamonte MJ, Lee IM, et al. American College of Sports Medicine position stand. Quantity and quality of exercise for developing and maintaining cardiorespiratory, musculoskeletal, and neuromotor fitness in appar-ently healthy adults: guidance for prescribing exercise. Med Sci Sports Exerc 2011;43(7):1334-1359.
27. Butt J, Weinberg RS, Breckon JD, Claytor RP. Adolescent physical activity participation and motivational determinants across gender, age, and race. J Phys Act Health 2011;8(8):1074-1083.
28. Poh H, Eastwood PR, Cecins NM, Ho KT, Jenkins SC. Six-minute walk distance in healthy Singaporean adults cannot be predicted using reference equations derived from Caucasian populations. Re-spirology 2006;11(2):211-216.
29. Roul G, Germain P, Bareiss P. Does the 6-minute walk test predict the prognosis in patients with NYHA class II or III chronic heart failure? Am Heart J 1998;136(3):449-457.
30. Ogden CL, Carroll MD, Curtin LR, McDowell MA, Tabak CJ, Fle-gal KM. Prevalence of overweight and obesity in the United States, 1999-2004. JAMA 2006;295(13):1549-1555.
31. Branca F, Nikogosian H, Lobstein T (eds). Current prevalence and trends of overweight and obesity. In: The challenge of obesity in the WHO European Region and the strategies for response. Copenhagen, Denmark: World Health Organization; 2007:5.
32. Gibbons WJ, Fruchter N, Sloan S, Levy RD. Reference values for a multiple repetition 6-minute walk test in healthy adults older than 20 years. J Cardiopulm Rehabil 2001;21(2):87-93.