Araştırma Makalesi/Research Article (2019) 36 (2), 135-144 do
i
:10.13002/jafag4640Quality Traits of Some New Sweet Corn (Zea mays saccharata Sturt.) Types in
Tokat/Kazova Conditions*
Mehmet Ali SAKİN
1*Abdulvahit SAYASLAN
2 1* Tokat Gaziosmanpaşa, Faculty of Agriculture, Field Crops Department, Tokat(orcid.org/0000-0002-9774-2478)
2Karamanoğlu Mehmetbey University, Faculty of Enginering, Department of Food Engineering, Karaman
(orcid.org/0000-0001-7161-1552)
*: e-mail: [email protected]
Alındığı tarih (Received): 09.03.2019 Kabul tarihi (Accepted): 15.05.2019 Online Baskı tarihi (Printed Online): 30.08.2019 Yazılı baskı tarihi (Printed): 31.08.2019
Abstract: This research was conducted to determine certain quality traits of new sweet corn varieties of sugary (su), sugar-enhanced (se) and shrunken (sh2) types in Tokat/Kazova conditions. A composite variety together with thirteen F1 sweet corn varieties with various sugar contents and grain colors were included in the research. The field trials were conducted in 2009 and 2010 growing seasons by the randomized complete block design with three replications, and water-soluble solids (WSS), sucrose contents, moisture contents and color traits (L*, hue and chromo) were investigated. Significant differences were obtained in the investigated characteristics, except for WSS contents by year and moisture contents by genotype. WSS contents of genotypes varied from 10.7 to 21.2 in °Brix. Average WSS contents as °Brix were 17.8 in the varieties of su-types, 18.9 in the se-types and 12.4 in the sh2-types varieties. Sucrose contents of the genosu-types, on a dry-matter basis, ranged from 14.6 to 40.9%, while mean sucrose contents of su-, se- and sh2-types were 17.0%, 30.4% and 35.0%, respectively. Mean moisture contents of the varieties at harvest were quite similar (75.4-75.9%). It is important that the genotypes with better performance in grain yield and quality by locations be cultivated accordingly.
Keywords: Sweet corn, Quality, Environment, Sucrose content, su, se, sh2
Bazı Yeni Şeker Mısırı (Zea mays saccharata Sturt.) Tiplerinin Tokat Kazova
Koşullarında Bazı Kalite Özelliklerinin Belirlenmesi
Öz:Bu araştırma, su, se ve sh2 tipindeki farklı şeker mısırı genotiplerinin Tokat Kazova koşullarında bazı
kalite özelliklerinin belirlenmesi amacıyla yürütülmüştür. Çalışmada, farklı şeker oranları ve tane renklerine sahip 13 adet F1 şeker mısırı çeşidi ile bir adet kompozit çeşit kullanılmıştır. Denemeler tesadüf blokları
deneme desenine göre
3 tekrarlamalı olarak 2009 ve 2010 yıllarında Tokat-Kazova koşullarında yürütülmüştür. Denemede suda çözünür kuru madde (SÇKM), şeker (sakkaroz) içeriği, nem oranı, parlaklık ve renk değerleri (L, Hue, Kroma) özellikleri incelenmiştir. Çalışmada, SÇKM hariç yıllar arasında nem oranı hariç genotipler arasında ele alınan özellikler bakımından önemli farklılıklar elde edilmiştir. İki yıllık ortalama sonuçlara göre; Genotiplerin SÇKM oranları 10.7 ile 21.1 °Brix arasında değişmiş, ortalama °Brix değerleri su tipli çeşitlerde 17.8, se tipli çeşitlerde 18.9 ve sh2 tipli çeşitlerde ise 12.4 olarak belirlenmiştir. Genotiplerin sakkaroz içerikleri % 14.6 ile % 40.9 arasında değişmiş, ortalama sakkaroz içeriği su, se ve sh2 tipli genotiplerde sırasıyla % 17.0, % 30.4 ve % 35.0 olarak tespit edilmiştir. Araştırmada, genotiplerin hasatta ortalama nem değerleri (% 75.4- % 75.9) oldukça yakın olarak elde edilmiştir. Farklı yörelerde tüketicilerin isteklerini yerine getirecek kalitedeki genotipler belirlenerek üretime alınmalıdır.
Anahtar Kelimeler: Şeker mısırı, kalite, çevre, şeker, su se sh2
*This research was financially supported by the Scientific and Technological Research Council of Turkey (TÜBİTAK project no: 108O727).
1. Introduction
Sweet corn has higher sugar content and thus better consumer acceptance than any other corn species when harvested at the end of milky stage.
Ears of sweet corn are consumed directly by boiling in water, grilling on the embers or roasting, whereas kernels are preserved by canning or freezing for extended shelf-life and consumption in various ways. Sugar contents of most corn species are rather low (1-3%, dry basis); however, sweet corn types contain much more sugar, ranging from 2-3% upto 30-40% (dry basis). Sucrose is the main sugar (60-70%), followed by glucose 15%), fructose (10-15%) and maltose (5%) in sweet corn (Hale et al. 2005a). In addition, sweet corn has the largest embriyo, resulting in the highest oil and protein accumation among all corn species (Orzolek et al. 2000; Tracy 2001).
Consumers take into consideration such quality characteristics as kernel color, texture and flavor (taste and aroma) in the preference of sweet corn (Wann et al. 1971). Varieties with homogene maturity, larger ear, yellow color and high sugar content are preferred by both producers and consumers. Kernel texture and sweetness are related to pericarp toughness, water-soluble solids (sugars and phytoglycogens) and moisture content (Azanza et al. 1996; Kleinhenz 2001). Sugar content, softness, flavor and other related characteristics of sweet corn are of low heritability (Azanza et al. 1994; Yousef and Juvik 2001). Asghar and Mehdi (1999) and Saleh et al. (2002) reported that heritabilities of most quality traits of sweet corns are generally low (h2< 0.50).
Different sugars are synthesized and stored in the endosperm of sweet corn, which are polymerized to phytoglycogens and starch during maturation and storage. The genes sugary (su), sugar-enhanced (se) and shrunken (sh2) dictate the rate and extent of sugar-to-starch conversion and in turn the degree of sweetness (Kleinhenz 2001; Tracy 2001). Moisture contents and water-soluble solids (WSS) of the su-type varieties vary, respectively, in the range of 71-73% and 11-12 in °Brix (Beckingham
2007). Hale et al. (2005a) reported that WSS concentrations were higher in su- and se-type varieties than those in sh2-type varieties. As su-type varieties convert sugars rapidly to starch after harvest maturity, their harvest period is rather narrow. In contrast, se- and sh2-types contain respectively 25-50% and 50-100% more sugars than su-types, resulting in more sweet taste and tender texture with prolonged harvest and market periods (Orzolek et al. 2000; Kleinhenz 2001; Lertrat and Pulam 2007). Hale et al. (2005b) determined that sucrose accounted for 55% of total sugars in su-types, 64% in se-types and 77% in sh2-se-types. Sweet corn products with tender/crispy texture and appetizing flavor are processed from genotypes with higher sugar and lower starch contents (Azanza et al. 1996).
Composite varieties of sweet corn have long been cultivated in Turkey; however, new varieties with higher sugar contents have started quickly displacing the old composite varieties. Composite and su-type varieties grown in Turkey had reportedly lower qualities as compared to se- and sh2-types (Sencar et al. 1992; Cesurer and Ülger 1997; Sencar et al. 1999; Turgut and Balcı 2001; Öktem and Öktem 2006).
Although WSS and total sugar contents are negatively correlated, WSS do not provide enough information on the contents and types of sugars (Hale et al. 2005a; Hale et al. 2005b). Therefore, determination of sugar profile is more meaningful than that of WSS. Michaels and Andrew (1986) ascertained that sugar content is an important quality trait. It is reported that sucrose concentration reached the highest level 20-25 days after pollination in sweet corn (Pajic et al. 1992; Lertrat and Pulam 2007). Zhu et al. (1992) reported that a sh2-type variety had the lowest WSS and the highest sucrose, whereas a su-type variety had the highest WSS and the lowest sucrose. Hale et al. (2005b) determined in su-, se- and sh2-types respectively that WSS varied between 22.0-25.7%, 21.8-23.6% and 14.7-15.4%, total sugars between 5.8-8.2%, 7.5-8.6% and 11.2-14.1%, sucrose contents between 3.7-4.0%, 4.7-5.6%
and 8.2-11.2%. WSS and sugar contents together with kernel characteristics related to eating quality in su- and sh2-type varieties were affected by environmental conditions. Azanza et al. (1996) reported that WSS was measured as 20.8% in su-type and 8.0% in sh2-type varieties, while sucrose was measured (on dry-matter basis) as 9.1% and 29.7%, respectively. Kleinhenz (2003) found that WSS contents ranged from 19.1 to 22.0% in se-type varieties, 15.9 to 17.6% in sh2-type varieties. Schultz and Juvik (2004) confirmed that sucrose levels were 8.3-9.1% in su-type, 16.4-31.2% in se-type and 24.8-34.4 in sh2-type genotypes. Eşiyok et al. (2004) reported that WSS contents significantly varied by varieties in three locations, where WSS ranged from 14.5 to 17.8 in °Brix. In that study, WSS were found to be the highest (21.2 °Brix) in Bornova location and the lowest (11.4 °Brix) in Cine location. Bozokalfa et al. (2004) and Tuncay et al. (2005) reported that WSS significantly changed in varieties as well as growth type, i.e, main or second crop. Sucrose levels were also affected by environment in another study (Ledencan et al. 2008). Ordas et al. (2008) obtained that the differences between the endosperm types were significant for WSS in two environments, though no difference was detected in another environment.
There were negative relationships between kernel moisture and starch contents (Kleinhenz 2001), and kernel moisture content varied with endosperm types and varieties (Beckingham 2007). Average kernel moisture contents at 22 days after pollination (DAP) were 70.8% in su-type, 71.3% in se-type and 74.4% in sh2-type varieties (Azanza et al. 1996). For optimum processing quality, su- and se-type varieties should have kernel moisture of about 73%, as opposed to 76% for sh2-type varieties. In fact, kernel moisture contents of sh2-type varieties change rather slowly (Anonymous 2010).
The varieties with various endosperm color (yellow, white and bicolor) were produced in the world; however, yellow color is habitually
preferred by consumers (Tracy 2001; Lerner and Dana 2007). Eşiyok et al. (2004) reported that L values (varied between 72.5 and 75.2), hue values (varied between 91.2 and 93.0) and choromo values (varied between 41.4 and 50.8), which are important color attributes, significantly changed among varieties. In addition, they reported that L, hue and choromo values of the sweet corns varied significantly by growth locations.
Since sweet corn consumption has been increasing in Turkey, this growing demand has to be satisfied through domestic production. The sweet corn varieties grown in Turkey were mostly composite and su-types. Additionally, almost all ready-to-eat cup-style sweet corn that has been widely consumed in Turkey is mostly imported. The purpose of this research was therefore to study quality characteristics of sweet corn varieties with different endosperm types and colors grown in Tokat/Kazova, Turkey.
2. Methodology
2.1. Description of growth location
The research was conducted in Tokat/Kazova in 2009 and 2010 growth years. Tokat/Kazova location has an altitude of 608 m, latitude of 40°13'N, longitude of 36°1'E. The average monthly temperatures in the first and second trial years were respectively 18.3 °C and 20.7 °C (Table 1), total rainfalls 200.0 mm and 179.5 mm and the average relative humidity 56.5% and 60.1%
Certain physical and chemical properties of the soil (0-20 cm) are given in Table 2. The soil was clay-loamy, slightly alkaline, medium in calcium carbonate (9.4-13.6%) and poor in organic matter (1.84-0.16%) in both years.
The available phosphorus was satisfactory in the first year but inadequate in the second year, whereas the soil was poor in potassium in the first year but rich in the second year (Karaman and Brohi 2004).
Table 1. Monthly mean temperature, rainfall and relative humidity parameters of Tokat/Kazova experimental location
Çizelge 1. Tokat/Kazova lokasyonunda aylık ortalama sıcaklık, yağış ve nispi nem parametreleri
Month Mean temperature (°C) Total rainfall (mm) Mean relative humidity (%)
2009 2010 2009 2010 2009 2010 April 11.2 12.0 45.5 64.6 60.1 63.2 May 15.6 17.9 60.1 45.3 62.3 59.0 June 21.4 22.3 20.0 59.8 52.2 62.4 July 22.5 25.0 73.9 6.4 55.5 60.8 August 20.6 26.3 0.5 3.4 52.5 54.9 Mean 18.3 20.7 200.0 179.5 56.5 60.1
Tablo 2. Soil physical and chemical properties in Tokat/Kazova experimental location (0-20 cm layer)
Çizelge 2. Tokat/Kazova lokasyonunda toprağın fiziksel ve kimyasal özellikleri (0-20 cm derinlik)
Year Texture Total salt (%) pH CaCO3 (%) Available
P2O5 (kg/da) Available K2O (kg/da) Organic C (%) 2009 Clay-loam 0.023 7.88 13.6 7.56 4.64 1.84 2010 Clay-loam 0.034 7.82 9,4 2.06 99.31 0.16
2.2. Plant growth and harvest
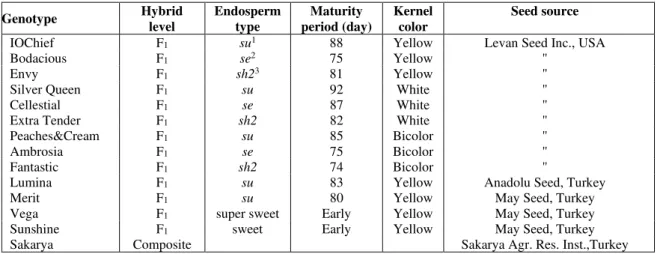
A composite variety and thirteen F1 sweet corn varieties with varying sugar contents and grain colors were included in the research (Table 3).
The experiment was designed in a randomized complete block design with three replications. Each plot consisted of eight rows, 5.0 m long with 70 cm row spacing. The seeds were planted 20 cm in distance on the rows. Two rows of sorghum were planted at the edge of each plot to avoid cross-pollination of varieties. The seeds were sown on May 11 in 2009 and April 28 in 2010. The dates of field
emergences were recorded as May 19 in the first year and May 10-15 in the second year. In both years of the trials, hoeing was done twice with the help of a hand-hoe. Tillers were removed in knee-high stage and hilling was applied. Three and four irrigations were carried out at the stages of knee-high, tasseling and grain-filling in both years through a drop-irrigation system (Kırtok 1998). A full dose of phosphate (3 kg in the first year and 5 kg in the second year as P2O5 / da) along with a half dose of nitrogen (14 kg / da) were applied at sowing. The remaining half of the nitrogen was applied when
Table 3. Sweet corn genotypes included in the study and their certain properties
Çizelge 3. Çalışmada kullanılan şeker mısırı genotipleri ve bazı özellikleri.
Genotype Hybrid level Endosperm type Maturity period (day) Kernel color Seed source
IOChief F1 su1 88 Yellow Levan Seed Inc., USA
Bodacious F1 se2 75 Yellow "
Envy F1 sh23 81 Yellow "
Silver Queen F1 su 92 White "
Cellestial F1 se 87 White "
Extra Tender F1 sh2 82 White "
Peaches&Cream F1 su 85 Bicolor "
Ambrosia F1 se 75 Bicolor "
Fantastic F1 sh2 74 Bicolor "
Lumina F1 su 83 Yellow Anadolu Seed, Turkey
Merit F1 su 80 Yellow May Seed, Turkey
Vega F1 super sweet Early Yellow May Seed, Turkey
Sunshine F1 sweet Early Yellow May Seed, Turkey
Sakarya Composite Sakarya Agr. Res. Inst.,Turkey
the plants were 40-50 cm in height. In each experiment, weeds were controlled with harrowing. Harvesting of the were performed between July 29 and August 14 in the first year and between July 20 and August 2 in the second year. Harvest was carried out around 21 days after the appearance of the silks, i.e., at the end of milky stage (Dartt et al. 2002).
2.3. Water-soluble solids (WSS) content Milky endosperms at the optimum maturation stage from the middle of 10 different ears were separately squeezed by hand onto refractometer and WSS contents were measured in °Brix (Eşiyok et al. 2004).
2.4. Sugar (sucrose) content
The sucrose contents of samples at harvest time were determined through enzymatic-spectroscopic assay kit (Biyozim, Ankara) based on the method of Outlaw and Mitchell (1988) and Kunst et al. (1988). For this purpose, 2-3 kernels each from the middle of 10 ears (total 20-30 kernels, about 10 g) were taken and homogenized with ten-fold water followed by clarification through centrifugation and 22-µm syringe filter. Sucrose contents of samples were expressed on dry-matter basis.
2.5. Color properties
Brightness (L), hue and chroma values of corn ears were measured by Minolta Colormeter (Osaka, Japan) as described by Eşiyok et al. (2004).
2.6. Statistical analysis
The collected data were subjected to the analysis of variance (MSTAT-C software) employing the growing year as the random factor and the genotypes as the fixed factor. The means were compared using the Duncan multiple comparison test (Duzgunes et al. 1987).
3. Results and Discussion
3.1. Water-soluble solids (WSS) contents of sweet corns
The mean WSS contents of sweet corn varieties are presented in Table 5. The WSS of
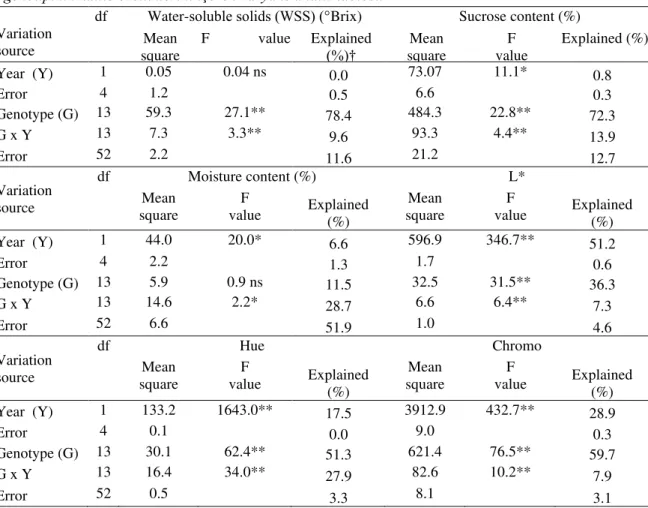
the genotypes were not significantly different by the mean of the years, but varied significantly by both years and combined years (Table 4). Kleinhenz (2003) reported that se- and sh2-types varieties had significant differences by years. The WSS contents were reported to vary by the growing location and year (Eşiyok et al. 2004). In another study, it was determined that sugar corn varieties grown as the second crop had significantly higher WSS than those grown as the main crop, which was explained by the fact that vegetative season in the second crop was warmer and ear maturating period was cooler (Tuncay et al. 2005).
Two-year results show that WSS contents of genotypes ranged from 10.7 to 21.1 in °Brix (Table 5). Eşiyok et al. (2004) reported that WSS varied between 14.5 and 17.8 in °Brix. Other researchers (Gençtan and Uçkesen 2001; Bozkalfa et al. 2004; Tuncay et al. 2005) also determined that WSS varied by the genotype. In this study, °Brix values were 15.0-21.1 in su-type varieties, 18.5-19.4 in se-su-type varieties and 10.7-13.6 in sh2-type varieties, while average °Brix values were respectively 17.8, 18.9 and 12.4. WSS contents of se-type varieties was also determined higher than in sh2-type varieties in another study (Kleinhenz 2003). Zhu et al. (1992) determined that the lowest °Brix in a sh2- type variety whereas the highest °Brix in a su- type varety. Similarly, it was determined that °Brix value was 20.8 in su-type and 8.0 in sh2-type sweet corns (Azanza et al. 1996). Hale et al. (2005a) reported that WSS contents were higher in su- and se-type varieties than in sh2-type varieties. In addition, Kleinhenz (2003) reported that se- and sh2-type varieties with high yield had lower °Brix values.
3.2. Sucrose contents of sweet corns Average sucrose contents of sweetcorn varieties are given in Table 5. Sucrose contents of genotypes varied from 11.6 to 39.6% (dry basis) in the first year and from 8.4 to 42.1% in the second year. The differences among genotypes were significant in both years (Table 4). Genotypic effects for sucrose contents were mainly observed (Table 4). Among the varieties,
Fantastic had the highest sucrose content in both years, whereas the composite variety (Sakarya) had the lowest sucrose content in the first year and Peaches&Cream in the second year. Other
researchers also reported genotypic variations in sucrose contents of sweet corns (Michaels and Andrew 1986; Pajic et al. 1992).
Table 4. Variance analysis table for quality characteristics of 14 sweet corn genotypes grown in Tokat/Kazova location for two years with three replications
Çizelge 4. Tokat/Kazova lokasyonunda iki yılda üç tekerrürlü olarak yetiştirilen 14 şeker mısır
genotipinin kalite özelliklerini içeren varyans analiz tablosu Variation
source
df Water-soluble solids (WSS) (°Brix) Sucrose content (%) Mean square F value Explained (%)† square Mean F value Explained (%) Year (Y) 1 0.05 0.04 ns 0.0 73.07 11.1* 0.8 Error 4 1.2 0.5 6.6 0.3 Genotype (G) 13 59.3 27.1** 78.4 484.3 22.8** 72.3 G x Y 13 7.3 3.3** 9.6 93.3 4.4** 13.9 Error 52 2.2 11.6 21.2 12.7 Variation source df Moisture content (%) L* Mean square F value Explained (%) Mean square F value Explained (%) Year (Y) 1 44.0 20.0* 6.6 596.9 346.7** 51.2 Error 4 2.2 1.3 1.7 0.6 Genotype (G) 13 5.9 0.9 ns 11.5 32.5 31.5** 36.3 G x Y 13 14.6 2.2* 28.7 6.6 6.4** 7.3 Error 52 6.6 51.9 1.0 4.6 Variation source df Hue Chromo Mean square F value Explained (%) Mean square F value Explained (%) Year (Y) 1 133.2 1643.0** 17.5 3912.9 432.7** 28.9 Error 4 0.1 0.0 9.0 0.3 Genotype (G) 13 30.1 62.4** 51.3 621.4 76.5** 59.7 G x Y 13 16.4 34.0** 27.9 82.6 10.2** 7.9 Error 52 0.5 3.3 8.1 3.1 **P<0.01, *P<0.05
Based on two-year results, sucrose content varied from 14.6 to 21.3% in su-type, 28.3 to 33.3% in se-type and 32.6 to 40.9% in sh2-type varieties. The mean sucrose contents were respectively 17.0, 30.4 and 35.0% for su-, se- and sh2-type varieties. The composite variety (Sakarya) is categorized in the same statistical group as su-type varieties. Similarly, Schultz and Juvik (2004) determined that sucrose contents were 8.3-9.1% in su-type, 16.4-31.2% in se-type and 24.0- 34.4% in sh2-type of sweet
corns. It was determined in previous studies that sh2-types had higher sucrose content than su-types (Michaels and Andrew 1986; Zhu et al. 1992; Azanza et al. 1996). It was also determined that sh2-types with low WSS contents had higher sucrose contents. A negative relationship between WSS and sucrose contents was established by Hale et al. (2005a). Mean sucrose contents of the genotypes were significantly affected by year, i.e., average sucrose content was found 25.9% in the first
Table 5. Water soluble solids (WSS), sucrose contents, moisture contents and color properties of sweet corn genotypes with their Duncan groups
Çizelge 5. Şeker mısırı genotiplerinin suda çözünür kuru madde (WSS), sakkaroz içerikleri, nem içerikleri ve renk içerikleri ait ortalamalar ve Duncan
gruplandırması
Genotype WSS (°Brix) Sucrose content (dry basis) (%) Moisture content (%)
2009 2010 2009-2010 2009 2010 2009-2010 2009 2010 2009-2010
IOChief (su) 19.5 a** 19.4 b** 19.5 ab** 17.9 def** 14.1 def** 16.0 d** 79.1 72.3 e** 75.7
Lumina (su) 14.5 bcd 16.1 bc 15.3 cde 20.4 b-f 22.2 cd 21.3 cd 75.3 74.2 b-e 74.7
Peaches&Cream (su) 19.3 a 22.8 a 21.1 a 21.7 b-f 8.4 f 15.1 d 76.8 69.2 f 73.0
Merit (su) 12.8 d 17.2 b 15.0 de 16.6 ef 12.7 def 14.6 d 78.6 75.1 a-e 76.8
Silver Queen (su) 17.5 ab 17.7 b 17.6 bc 19.2 c-f 20.0 cd 19.6 d 75.9 77.5 a 76.7
Sunshine (su) 17.5 ab 18.0 b 17.8 b 20.3 b-f 10.1 ef 15.2 d 76.3 74.0 cde 75.2
Sakarya (Composite) 17.1 abc 17.6 b 17.3 bcd 11.6 f 20.8 cd 16.2 d 76.4 72.4 de 74.4
Bodacious (se) 19.9 a 17.0 b 18.5 b 37.5 a 19.1 cde 28.3 bc 75.7 75.5 abc 75.6
Cellestial (se) 20.3 a 17.2 b 18.7 ab 31.5 abc 27.4 bc 29.5 b 74.8 77.1 ab 76.0
Ambrosia (se) 20.2 a 18.6 b 19.4 ab 33.4 ab 33.2 ab 33.3 b 75.0 75.3 a-d 75.2
Envy (sh2) 11.9 d 9.4 e 10.7 g 29.0 a-e 38.4 a 33.7 b 77.2 75.2 a-e 76.2
Vega (sh2) 12.5 d 11.0 de 11.8 fg 31.2 a-d 34.6 ab 32.9 b 75.2 75.8 abc 75.5
Extra Tender (sh2) 13.5 cd 13.6 cd 13.6 ef 32.3 abc 32.9 ab 32.6 b 75.6 75.6 abc 75.6
Fantastic (sh2) 13.4 cd 13.4 cd 13.4 ef 39.6 a 42.1 a 40.9 a 74.9 77.3 a 76.1
Mean 16.4 16.4 16.4 25.9 a* 24.0 b 24.9 76.2 a* 74.8 b 75.5
C.V. (%) 9.4 8.6 9.0 20.2 16.2 18.5 4.5 1.5 3.4
Genotype L* Hue Chromo
2009 2010 2009-2010 2009 2010 2009-2010 2009 2010 2009-2010
Yellow IOChief 68.02 g** 74.54 de** 71.28 fg** 89.16 a** 89.05 ab** 89.10 a** 32.18 abc** 52.38 ab** 42.28 ab**
Lumina 70.71 ef 76.05 cde 73.38 b-e 87.50 ab 89.72 a 88.61 ab 33.98 a 56.56 a 45.27 a
Merit 66.47 g 74.49 de 70.48 g 83.23 d 87.89 bc 85.56 ef 30.18 a-d 49.25 ab 39.72 bcd
Sunshine 67.36 g 73.43 e 70.39 g 88.55 a 85.73 d 87.14 cd 28.75 cde 46.22 bc 37.49 cde
Sakarya 70.63 ef 75.02 cde 72.82 def 88.36 ab 88.93 ab 88.64 ab 33.45 ab 49.56 ab 41.51 abc
Bodacious 71.21 def 74.90 de 73.06 cde 81.41 ef 88.39 abc 84.90 fg 29.78 b-e 43.28 bc 36.53 def
Envy 73.01 bcd 80.30 a 76.65 a 86.71 bc 89.14 ab 87.93 bc 32.83 ab 55.51 a 44.17 ab
Vega 70.89 ef 76.04 cde 73.46 b-e 88.27 ab 86.02 d 87.14 cd 33.89 a 52.39 ab 43.14 ab
Bicolor Peaches&Cream 72.58 cde 76.87 cd 74.73 bc 83.59 d 88.81 ab 86.20 de 26.30 ef 39.86 cd 33.08 ef
Ambrosia 67.68 g 75.93 cde 71.81 efg 79.98 f 88.66 ab 84.32 gh 24.54 f 31.86 de 28.20 gh
Fantastic 70.16 f 77.15 bcd 73.65 bcd 85.33 c 86.22 d 85.78 ef 27.39 def 37.36 cde 32.38 fg
White Silver Queen 77.19 a 77.94 abc 77.57 a 81.92 de 85.45 d 83.68 h 15.20 h 20.00 f 17.60 ı
Cellestial 73.47 bc 76.16 cde 74.81 b 80.72 ef 81.52 e 81.12 ı 14.09 h 11.04 g 12.57 j
Extra Tender 74.64 b 79.83 ab 77.23 a 82.43 de 86.86 cd 84.64 fgh 20.26 g 28.67 e 24.46 h
Mean 71.00 b** 76.33 a 73.67 84.80 b** 87.31 a 86.06 27.35 b** 41.00 a 34.17
C.V. (%) 1.2 1.5 1.4 0.8 0.8 0.8 5.5 9.1 8.3
Different letters in the same column indicate significant difference (**P<0.01, *P<0.05).
3.3. Moisture contents of sweet corns Moisture contents of sweet corn genotypes at harvest did not differ significantly in the first year, whereas the differences were significant in the second year (P<0.01) (Tablo 4). In this study, mean moisture contents were 75.4% in su-type, 75.6% in se-type and 75.9% in sh2-type varieties (Tablo 5). Azanza et al. (1996) reported that mean moisture contents at harvest were respectively 75.7 and 77.6% in su- and sh2- type varieties. It was reported that moisture content in sweet corn varied by genotype and endosperm type (Beckingham 2007).
3.4. Color properties (L*, hue and chromo) of sweet corns
Color related values (L*, hue and chromo) of sweet corn genotypes are presented in Table 5.
The lightness (L*) values, significantly affected by year (Table 4), were 71.00 in the first year and 76.33 in the second year (Table 5). The L value is to a large extent enviromentally controlled (Tablo 4). L value was changed by environment (Eşiyok et al. 2004). Tuncay ve ark. (2005) reported that L values of sweet corn cultivars were higher in main crops compared to second crops.
Two-year results show that L* values of the genotypes changed from 70.39 to 77.57 (Table 5) and that differences between the genotypes were significant (Table 4). Eşiyok et al. (2004) and Tuncay et al. (2005) determined that L* values varied from 72.52 to 77.55 in yellow varieties. As shown in Table 5, L* values changed between 70.39-76.65 in the yellow varieties, 71.81-74.73 in the bicolor varieties and 74.81-77.57 in the white varieties. The average L* values were 72.69 in the yellow varieties, 73.40 in the bicolor varieties and 76.54 in the white varieties.
It has been well established that hue values of sweet corn varieties differ by both genotype and environment, yet genetic factors are more dominant in hue values (Table 4). Eşiyok et al. (2004) determined significant differences in hue values of genotypes. As seen in Table 5, the highest hue values were observed on IOChief
yellow variety with 89.10, Peaches&Cream bicolor variey with 86.20 and Extra Tender white variey with 84.64. The hue values were decrased as the ear colors turned from yellow to white. In a study with yellow varieties, hue values varied from 91.24 to 93.00, which significantly differed by variety, location and growing season (Eşiyok et al. 2004; Tuncay et al. 2005).
Chromo values are to a large extent genetically controlled (Table 4). As listed in Table 5, chromo values of the genotypes ranged from 12.57 to 45.27 and the differences were statistically significant. Additionally, chromo values obtained in the second growth year were higher (Table 5). Tuncay et al. (2005) found differences in chroma values of main and second crops. In this research, chromo values were determined to be 36.53-45.27 in the yellow varieties, 28.20-33.08 in the bicolor varieties and 12.57-24.46 in the white color varieties. Eşiyok et al. (2004) determined that chromo values changed significantly from 41.35 to 50.77 in the yellow varieties. As the chromo values express the brightness of grains (Eşiyok et al. 2004), it can be deduced from the results that Lumina, Peaches&Cream and Extra Tender were the brightest varieties respectively among the yellow, bicolor and white varieties.
4. Conclusions
Quality traits, such as texture, color and taste, are key factors in consumer acceptance and preference of sweet corn products. In this study, significant differences by year were obtained in the moisture and sucrose contents of sweet corn varieties. Climatic factors were determined to be influential on the quality characteristics. WSS contents of the varieties varied from 10.7 to 21.1 in °Brix with mean values of 17.8 in su-type, 18.9 in se-type and 12.4 in sh2-type varieties. Sucrose contents of the genotypes changed from 14.6 to 40.9% (dry basis) with average values of 17.0%, 30.4% and 35.0% respectively for su-, se- and sh2-types varieties. Lightness (L*), hue and chroma values of the sweet corns ranged respectively from 70.39-76.65, 84.90-89.10 and 36.53-45.27 in the 142
yellow varieties, 71.81-74.73, 84.32-86.20 and 28.20-33.08 in the bicolor varieties and 74.81-77.57, 81.12-84.64 and 12.57-24.46 in the white varieties. The results indicate that chief quality characteristics of sweet corn genotypes should be evaluated in different ecological regions so that suitable varieties with better consumer acceptance are adapted and cultivated. References
Anonymous (2010). Vegetable Crop Management. www.extension.umn.edu/distribution/cropsystems/ DC7061.html.
Asghar MJ, Mehdi SS (1999).Variability for grain yield, its components and quality traits in a sweet corn population. Pakistan Journal of Biological Sciences, 2 (4): 1366-1370.
Azanza F, Juvik JA, Klein BP (1994). Relationships between sensory quality attributes and kernel chemical composition of fresh- frozen sweet corn. J. Food Quality, 17: 159–172.
Azanza F, Bar-Zur A, Juvik JA (1996). Variation in sweet corn kernel characteristics associated with stand establishment and eating quality. Euphytica, 87: 7-18.
Beckingham C (2007). Commodity growing guides-
Sweet corn.
http://www.dpi.nsw.gov.au/agriculture/horticulture /vegetables/commodity/sweet-corn.
Bozkalfa MK, Eşiyok D, Uğur A (2004). Ege Bölgesi koşullarında ana ve ikinci ürün bazı hibrit şeker mısır (Zea mays L. var. saccharata) çeşitlerinin verim kalite ve bitki özelliklerinin belirlenmesi. Ege Üniv. Ziraat Fak. Derg., 41(1): 11-19.
Cesurer L, Ülger AC (1997). Farklı ekim zamanlarının bazı şeker mısır çeşitleri üzerindeki etkisi. II. Tarla Bitkileri Kongresi, 25-29 Eylül, S:134-138, Samsun.
Çetinkol M (1989). Tatlı mısır üretimi. Hasat Aylık Tarım Dergisi. İstanbul.
Dartt B, Black R, Marks P, Morrone V (2002). Cost of fresh market sweet corn production in Monroe County, Michigan Staff Paper 2002-40 November, http://www.msu.edu/user/blackj/Staff_Paper_2002-40.pdf.
Düzgüneş O, Kesici T, Kavuncu O (1987). Gürbüz F Araştırma ve Deneme Metotları (İstatistik Metotları II). Ankara Üniv. Ziraat Fak. Yay. No: 1021, 381 s., Ankara.
Eşiyok D, Bozkalfa MK, Uğur A (2004). Farklı lokasyonlarda yetiştirilen şeker mısır (Zea mays L. var. saccharata) çeşitlerinin verim kalite ve teknolojik özelliklerinin belirlenmesi. Ege Üniv. Ziraat Fak. Derg., 41(1): 1-9,
Gençtan T, Uçkesen B (2001). Tekirdağ koşullarında ana ürün ve ikinci ürün şeker mısır (Zea mays saccharata Sturt.) yetiştirme olanaklarının araştırılması. Türkiye 4. Tarla Bitkileri Kongresi 17-21 Eylül, Tekirdağ.
Hale TA, Hassell RL, Phillips T, Halpin E (2005a). Taste panel perception of sweetness and sweetness acceptability compared to high pressure liquid chromatography analysis of sucrose and total sugars among three phenotypes (su, se, and sh2) at varying maturities of fresh sweet corn. Horttechnology, 15(2): 313-317.
Hale TA, Hassell RL, Phillips T (2005b). Refractometer Measurements of Soluble Solid Concentration Do Not Reliably Predict Sugar Content in Sweet Corn. Horttechnology, 15(3): 668-672.
Karaman MR, Brohi A (2004). 3. Ulusal Gübre Kongresi. Tarım, Sanayi, Çevre Bildiri Kitabı. Cilt 2, Ek Tabloler Bölümü, 11-13 Ekim, S: 1415-1426, Tokat.
Kırtok Y (1998). Mısır Üretimi ve Kullanımı. Kocaoluk Basım ve Yayınevi, Tarsus,.
Kleinhenz MD (2001). Sweet corn quality - What is it? Excerpts from the Proceedings of the Ohio Fruit and Vegetable Growers Congress, February 7-9, Toledo, OH. http://www.oardc.ohio-state.edu/KLEINHENZ.
Kleinhenz MD (2003). Sweet corn variety trials in Ohio: Recent top performers and suggestions for future evaluations. Horttechnology, 13 (4): 711-718.
Kunst A, Draeger B, Ziegenhorn J (1988). D-Glucose. In Methods of Enzymatic Analysis (Bergmeyer, H. U., ed.), 3rd ed., Vol. VI, pp. 163-172, VCH Publishers (UK) Ltd., Cambridge, UK.
Ledencan T, Sudar R, Simic D, Zdunic Z, Brkic A (2008). Effects of the agroecological factors on sweet corn quality. Cereal Research Communications, 36: 1411-1414.
Lerner BR, Dana MN (2007). Growing Sweet Corn. HO-98.pdf. Purdue University Cooperative
Extension Service,
http://www.ces.purdue.edu/extmedia/hort.htm#9. Lertrat K, Pulman T (2007). Breedingi for Increased
Sweetness in Sweet Corn, International Journal of Plant Breeding, 1(1): 27-30.
Michaels TE, Andrew RH (1986). Sugar accumulation in
shrunken-2 sweet corn kernels. Crop Sci., 26: 104-107. Ordas B, Revilla P, Ordas A, Malvar RA (2008). Hybrids sugary x sugary enhancer of sweet corn: A valuable option for cool environments. Scientia Horticulturae 118: 111-114.
Orzolek MD, Greaser GL, (2000). Harper JK Agricultural Alternatives: Sweet corn production.. Penn State College ofAgricultural Sciences Agricultural Research and Cooperative Extension
http://pubs.cas.psu.edu/PubDept.asp?varDept=2&S ubmit2=Go&offset=45.
Outlaw WH, Mitchell CT (1988). Sucrose. In Methods of Enzymatic Analysis (Bergmeyer, H. U., ed.) 3rd ed., Vol. VI, pp. 96-103, VCH Publishers (UK) Ltd., Cambridge, UK.
Öktem A, Öktem AG (2006). Bazı şeker mısır (Zea mays saccharata Sturt) genotiplerinin Harran Ovası koşullarında verim karakteristiklerinin
belirlenmesi. Uludağ Üniv. Zir. Fak. Derg., 20(1): 33-46.
Pajić Z, Babić M, Radosavljević M (1992). Effect of environmental factors on changes in carbohydrate composition of sweet com (Zea mays L. saccharata). - Genetika, 24(1): 49-56.
Saleh GB, Alawi SAS, Panjaitan K (2002). Performance, correlation and heritability studies on selected sweet corn synthetic populations. Pakistan Journal of Biological Sciences, 5(3): 252-254. Schultz JA, Juvik JA (2004). Current models for starch
synthesis and the sugary enhancer1 (se1) mutation in Zea mays. Plant Physiology and Biochemistry, 42: 457-464.
Sencar Ö, Gökmen S, Koç H, Okutan M (1992). Tokat ekolojik şartlarında II. ürün olarak şeker mısır yetiştirme olanaklarının belirlenmesi üzerine bir araştırma. Cumhuriyet Üniversitesi Tokat Ziraat Fak. Dergisi, 9(1): 242-257.
Sencar Ö, Gökmen S, Sakin MA, Ocakdan M (1999). Şeker mısırında (Zea mays saccharata Sturt.) koltuk almanın verim ve bazı özelliklere etkileri. Türkiye 3. Tarla Bitkileri Kongresi, 15-18 Kasım, 1999, Cilt I, Genel ve Tahıllar: 456-461, Adana.
Tracy WF (2001). Sweet corn. In: Specialty Corns, 2nd edition, A.R. Hallauer, ed. CRC Press LLC, Boca Raton.
Tuncay Ö, Bozkalfa MK, Eşiyok D (2005). Ana ürün ve ikinci ürün olarak yetiştirilen bazı tatlı mısır çeşitlerinde koçanın agronomik ve teknolojik özelliklerinin belirlenmesi. Ege Üniv. Ziraat Fak. Derg., 42(1): 47-58.
Turgut İ, Balcı A (2001). Bursa koşullarında değişik ekim zamanlarının şeker mısırı (Zea mays saccharata Sturt.) çeşitlerinin taze koçan verimi ile verim öğeleri üzerine etkileri. Türkiye 4. Tarla Bitkileri Kongresi, 17-21 Eylül, Tekirdağ.
Wann EV, Brown GB, Hills WA (1971). Genetic modifications of sweet corn quality. J . American Soc . Hort. Sci . 96: 441-444.
Yousef GG, Juvik JA (2001). Comparison of phenotypic and marker-assisted selection for quantitative traits in sweet corn. Crop Sci., 41:645-655.
Zhu S, Mount JR, Collins JL (1992). Sugar and soluble solids changes in refrigerated sweet corn (Zea mays L). Journal of Food Science, 57(2): 454-457.