RESEARCH ARTICLE / ARAŞTIRMA MAKALESİ
Automatic Detection and Calculation of Drusen Areas in Retinal
Fundus Fluorescein Angiography Images
Retinal Fundus Anjiyografi Görüntülerinde Drusen Alanlarının Otomatik Tespiti ve
Hesaplanması
Önder DEMİR 1, Buket DOĞAN 1, Esra ÇALIK BAYEZİT 2, Kazım YILDIZ 1
1 Computer Engineering Department, Technology Faculty, Marmara University 34722, Kadıköy / İSTANBUL 2 Vocational School, Fatih Sultan Mehmet Vakif University, ISTANBUL,TURKEY
Abstract
Computer aided detection (CaD) systems are widely used in the analysis of biomedical images. In this paper, we present a novel CaD system to detect age-related macular degeneration (aRMD) on retinal fundus fluorescein angiography (FFa) images, and we provide an areal size calculation of pathogenic drusen regions. The purpose of this study is to enable identi-fication and areal size calculation of aRMD-affected regions with the developed CaD system; hence, we aim to discover the condition of the disease as well as facilitate long-term patient follow-up treatment. With the aid of this system, assessing the marked regions will take less time for ophthalmologists and observing the progress of the treatment will be a simpler process. The CaD system consists of four stages, a) preprocessing, b) segmentation, c) region of interest detection and d)feature ex-traction and drusen area detection. Detection through CaD and calculation of drusen regions were performed with a dataset composed of 75 images. The results obtained from the developed CaD system were examined by a specialist ophthalmolo-gist, and the performance criteria of the CaD system are reported as conclusions. as a result, with 66 correct detections and 9 incorrect detections, the developed CaD system achieved an accuracy rate of 88%.
Keywords: Computer aided Detection, age Related Macular Degeneration, Morphologic Image Processing, Retinal Fundus Fluorescein angiography
Öz
Bilgisayar destekli tespit (BDT) sistemleri biyomedikal görüntülerin analizinde geniş bir kullanım alanına sahiptir. Bu çalışmada retinal fundus anjiyografi görüntüleri üzerinde yaşa bağlı makula dejenerasyonu (YBMD) hastalığının tespiti için bir BDT sistemi gerçekleştirilmiş ve patojenik drusen alanlarının büyüklüğünün hesaplanması sağlanmıştır. Çalışmanın amacı YBMD hastalığının görüldüğü alanların tespitinin ve büyüklüğünü hesaplamanın yanında hastalığa karşı uygulanan tedavinin sonucunun takibini de sağlamaktır. Geliştirilen sistemin yardımıyla optalmoloji uzmanları işaretlenen alanları kısa sürede tespit edebilecek ve hastalığın tedaviye verdiği cevabı basit bir şekilde gözlemleyebileceklerdir. Geliştirilen BDT sistemi 4 aşamadan oluşmaktadır, a) önişleme aşaması, b) bölütleme aşaması, c) ilgi alanı tespiti ve d) öznitelik çıkarma ve tespit aşaması. Geliştirilen BDT sistemi 75 görüntüden oluşan bir verisetiyle test edilmiştir. BST sisteminin elde ettiği sonuçlar bir optalmoloji uzmanıyla karşılaştırılarak sonuç bölümünde sunulmuştur. Geliştirilen BDT sistemi 66 doğru, 9 ha-talı tespit yaparak %88 doğruluk oranı sağlamıştır.
Anahtar Kelimeler: Bilgisayar Destekli Tespit, Yaşa Bağlı Makula Dejenerasyonu, Morfolojk Görüntü İşleme, Retinal Fundus anjiyografi
Sorumlu Yazar/Corresponding Author: Önder Demir, Tel: 0216 3365770/1202 , e-posta: [email protected] Gönderilme/Submitted: : 20.11.2017, Düzenleme/Revised: 25.05.2018, Kabul/Accepted: 23.03.2018.
127 I. INTRODUCTION
Eye problems brought about by advanced age can have a serious impact, including loss of vision if untreated at an early stage. Macula (yellow spot) is a region in the retina la-yer where optic cells are most concentrated [1]. aRMD is an eye condition commonly known as “yellow spots” caused by deformation of the macula region of the eye.
according to the World Health organization (WHo), aRMD ranks third in vision disorders that result in loss of sight with 8.7% prevalence[2]. The disease affects the ma-cula in such a way that the eye gradually loses its ability to see. The early findings of aRMD-related loss of vision may include seeing shadowy areas in central vision and mostly blurred or distorted vision. The main risk factor in develo-ping macular degeneration is advancing age. In developed countries, the most significant reason for blindness in people over 50 years of age is macula disease [3,4].
Macular degeneration develops as a result of the aging of the macula region. FFa has been a standard tool in the in-vestigation and management of retinal diseases since 1961 [5,6].
In order to detect aRMD in retinal images, structures like optic discs, blood vessels, and macula should be iden-tified within the image. In the literature, relevant studies concentrating on detection of structures like optic discs, blood vessels, and macula in retina use various methods, such as phase congruency [7], morphological image proces-sing [8,9], Gabor filter [10], wavelet transform [11], region growing, Gaussian filter [12], and multilevel image proces-sing [13]. In light of the previous studies, detecting aRMD by using features like the position of optic disc in retina, the convergence of blood vessels on the optic disc, the distance of the macula region to the optic disc, pixel intensity values of the optic disc, blood vessels, and drusen is found to pro-vide successful outcomes in diagnosis of the disease.
Guven[14] uses Hough transform to determine optic disc localization, the thresholding method is used to obtain the brightest pixel region, and Canny’s method is used for edge detection. Contrast-limited adaptive histogram equalization is used for the segmentation and detection of aRMD. The aRMD segmentations created through the proposed method were then compared by an ophthalmologist through the pro-cess of manual segmenting. The positive predictive value of the proposed method was calculated as 95.68%. The study does not contain sensitivity information of the system.
köse and Yavuz use the retinal blood vessels as reagents to identify the positions of significant structures, such as the optic disc in the retina and macula in addition to the diag-nosis of the disease. For this purpose, in the aforementioned
study, the green band of the colored fundus image was filte-red through a Gabor filter to clarify the vessels. In order to bring the vessels to the forefront, top hat conversion and hi-ghest percentage thresholding (p-tile) were used. The study was tested on 20 images selected from STaRE database and reported to achieve 86.31% sensitivity and 92.9% ac-curacy[15]. Joseph employs a gradient-based segmentation algorithm to detect drusens that isolate drusens and provide basic drusen characterization for the modeling stage. The detected drusens are then fitted by using Modified Gaussian functions, producing a model of the image that is used to evaluate the affected area[16].
Brandon and Hoover use a multilevel analysis in the de-tection of drusens in retinal images. Their study was com-posed of a multilayered structure that contains a pixel la-yer, a region lala-yer, an area lala-yer, and an image layer. In area-layered classification, regions marked as false positive were eliminated with filtering and each area was separated into sub-regions that contain no drusens, fewer drusens, or many drusens. In image-layered classification used in the fi-nal stage, the regions marked by areal layer are counted and classified by checking their average area. The study consis-ted of 38 healthy images, 68 unhealthy images with drusens, and 19 abnormal drusen images without drusens. They re-ported a success rate of 87% [13].
In our previous work, a CaD system was developed using morphological image processing technique to detect regions of interest affected by aRMD disease on data set composed of 87 images. Following the segmentation phase, region of interests were labeled by analyzing the most im-portant morphological features that would identify aRMD. The accuracy of CaD system is tested by ophthalmologist and the accuracy of the system is %85.05 [9].
upon analysis of the studies in the literature, it can be concluded that even if the results show a high accuracy rate for some of the images, these could not provide a long-term tool in monitoring the whole treatment course of patients with aRMD, and how the patients respond to treatment. This study, on the other hand, differs from other studies in that it allows physicians to calculate the area of the diseased region during the whole course of the treatment, and moni-tor the growth and reduction in this area.
With contemporary treatments, it is possible not only to prevent loss of vision due to aRMD, but also to increase si-ght [17,18]. aRMD is a chronic disease that requires regu-lar treatment. Therefore, it is extremely important to observe follow-up and treatment plans recommended by the physi-cian. The physician should examine and monitor the patient frequently [3,18]. When the increasing number of patients
128 and the cost of healthcare are considered, this study provides advantages by reducing the duration of the detection pro-cess, increasing accuracy, and lowering costs.
This study develops a CaD system that can be used to diagnose deformations caused by aRMD in the macula re-gion and track their course in time. Thus, the study aims to achieve a higher assessment rate with fewer images in less time by decreasing the number of images an ophthalmo-logist should examine, and providing preliminary informa-tion during the follow-up phase of the disease.
II. MATERIALS AND METHODS
This study, which was conducted with the permission and approval of TR Ministry of Health and the Turkish Institute of Public Hospitals, used a dataset composed of 75 images, 16 of which were healthy images and 39 unhealthy images obtai-ned from the Beyoglu Eye Training and Research Hospital. In addition, the dataset was extended with the addition of 20 un-healthy images from STaRE dataset [19] downloaded from the website “http://www.parl.clemson.edu/stare”. The retinal images were composed of structures of blood vessels, optic discs, and the macula region. In order to identify the macula region where drusens develop, blood vessels and optic discs should be removed from the images. Despite having different shapes, the similarities in the colors and tissues of these struc-tures can cause the elimination of the region of interest(RoI), such as the macula region, from the images during the seg-mentation stage [15]. For this reason, an algorithm was used that allowed pixel neighborhood-dependent optic disc elimi-nation by using feature extraction for blood vessel segmenta-tion from the images, eliminasegmenta-tion of the optic discs, and iden-tification of the region of interest.
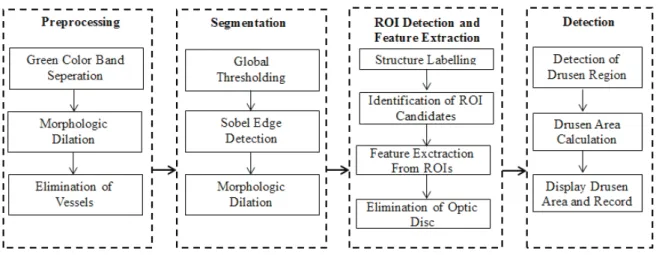
2.1 The Stages of the Developed CAD System The block diagram of CaD system is presented in Fi-gure 1. The developed CaD system consists of 4 stages. In the initial stage of preprocessing, the vessels are eliminated from the image. In the second stage, thresholding and edge detection are performed for segmentation. In the third stage, regions of interest are identified and features are extracted. In the final stage, decisions are made by evaluating the data obtained.
2.2 Preprocessing Stage
FFa images are RGB colored images. During the prepro-cessing stage, FFa images are initially separated into the green color band. The image in the green color band is then diluted and subjected to thresholding in order to eliminate the vessels in the image.
By running the colored image of the fundus in the retinal images through the green color band, better results were ac-hieved for optic discs and aRMD detection. By using morp-hological image processing and various operators, a number of operations were performed on the images, such as identifi-cation and extraction of structures like borders and skeletons in the image, and the removal of noises and segmentation [20]. Dilation is one of the main operators of mathematical morphology [20]. Dilation is the process of enlarging the ob-ject in the digital image to the size of the segments it interse-cts with structuring elements (SE). Dilation is performed by moving each pixel in the digital image to the center point of SE. SE adds pixels to the empty areas by moving onto each pixel value and hence provides a clearer image. In the initial stage of the developed CaD system, a dilation operator is
Marmara Fen Bilimleri Dergisi 2018, 2: 137-144 Drusen area Detection 2.1 The Stages of the Developed CAD System
The block diagram of CaD system is presented in Figure 1. The developed CaD system consists of 4 stages. In the initial stage of preprocessing, the vessels are eliminated from the image. In the second stage, thresholding and edge detection are performed for segmentation. In the third stage, regions of interest are identified and features are extracted. In the final stage, decisions are made by evaluating the data obtained.
Figure 1. The block diagram of CAD system
2.2 Preprocessing Stage
FFa images are RGB colored images. During the preprocessing stage, FFa images are initially separated into the green color band. The image in the green color band is then diluted and subjected to thresholding in order to eliminate the vessels in the image.
By running the colored image of the fundus in the retinal images through the green color band, better results were achieved for optic discs and aRMD detection. By using morphological image processing and various operators, a number of operations were performed on the images, such as identification and extraction of structures like borders and skeletons in the image, and the removal of noises and segmentation [20]. Dilation is one of the main operators of mathematical morphology [20]. Dilation is the process of enlarging the object in the digital image to the size of the segments it intersects with structuring elements (SE). Dilation is performed by moving each pixel in the digital image to the center point of SE. SE adds pixels to the empty areas by moving onto each pixel value and hence provides a clearer image. In the initial stage of the developed CaD system, a dilation operator is used to eliminate vessels as one of the morphological image processing operators. To be able to perform dilation, an appropriate structuring element should be selected. Since selecting the structuring element based on the shape sought in the image will provide better detection results, the structuring element selected for this system developed a disc shape to detect drusens caused by aRMD. By using this selected structuring element, the dilation process was performed. after the dilation operator is applied to attenuate the clarification of the vessels, the vessels with reduced visibility are eliminated by thresholding.
Figure 2 (a) shows the original image and Figure 2 (b) shows the separated image into the green color band. In the image where the dilation operator is applied, the vessels are substantially eliminated and their visibility reduced. after the dilation operator is applied, the elimination of the vessels with reduced visibility is achieved as seen in Figure 2 (c).
129 used to eliminate vessels as one of the morphological image processing operators. To be able to perform dilation, an ap-propriate structuring element should be selected. Since se-lecting the structuring element based on the shape sought in the image will provide better detection results, the structu-ring element selected for this system developed a disc shape to detect drusens caused by aRMD. By using this selected structuring element, the dilation process was performed. af-ter the dilation operator is applied to attenuate the clarifica-tion of the vessels, the vessels with reduced visibility are eli-minated by thresholding.
Figure 2 (a) shows the original image and Figure 2 (b) shows the separated image into the green color band. In the image where the dilation operator is applied, the vessels are substantially eliminated and their visibility reduced. after the dilation operator is applied, the elimination of the vessels with reduced visibility is achieved as seen in Figure 2 (c).
(a)
(b)
(c)
Figure 2. (a) original image (b), image separated into green, (c) and image obtained after the application of green color band of
the dilation operator
2.3 Segmentation Stage
Thresholding is the process of equalizing pixel values that form the image matrix from a larger or smaller value to another value. usually, for an image with 256 gray level in-tensity, this value is equalized to 0 (black) or 255 (white). Hence, regions with undesired intensity are removed from the image. Following the process of thresholding, the image is converted into a binary image to obtain a matrix compo-sed of 0 and 1.
In this study, global thresholding method is used. The resholding value (T) is determined by a value obtained th-rough the histogram graphic of the image. The appropriate T value is obtained by calculating the threshold value of the pixel values of the diseased regions at minimum level th-rough the histogram graphic analysis of the images in the data used. In line with the established T value, the threshold value is determined as well as the averages of the smaller and larger pixels. The average of these two values is used as the threshold value. after the application of thresholding value, Sobel edge detection algorithm is used to identify the structural borders in the data image as well as to clarify ver-tical and horizontal edges. applying Sobel edge detection algorithm on the image might cause some of the border lines to break. To remove these breaks, the dilation operator is re-applied. For this process, a disc-shaped structuring element of one unit is used. as a result, areal values are retained by minimally dilating the borders of regions of interest.
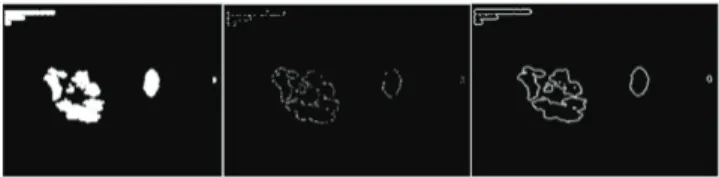
Figure 3 (a) shows the binary image converted after th-resholding a sample FFa image. Figure 3 (b), on the other hand, shows the image after Sobel edge detection algorithm is applied. Figure 3 (c) shows the Sobel edge detection al-gorithm applied the image of relevant pixels coupled with the dilation operator by using the disc-shaped structural ele-ment of one unit.
Figure 3. (a) Image after thresholding, (b) image after Sobel
algorithm, and (c) image after dilation
2.4 Identification of ROI and Feature Extraction Stage
In the case of images where edges are clarified by using the dilation operator, possible RoIs are identified. all stru-ctures located in these regions are separated from the ba-ckground image and labeled by identifying their borders.
130 These labels aid in extracting neighboring information of the objects through analysis of the number of objects in the image together with data about the borders. Information about the number of objects in the image as well as the ne-ighborhood of the identified objects is obtained by a matrix that contains information about the borders. Pixels in close proximity are combined within this neighborhood. This pro-cess facilitates monitoring the changes in the potential RoIs during the course of treatment. as can be seen in Figure 5 (b), potential RoIs are marked and its borders are indicated with different colors.
In the present study, after identification of the regions that could potentially be RoIs, the area, border, shape, and perimeter features of these RoIs are extracted. By using these features, RoIs are encircled in a specified region th-rough the algorithm developed.
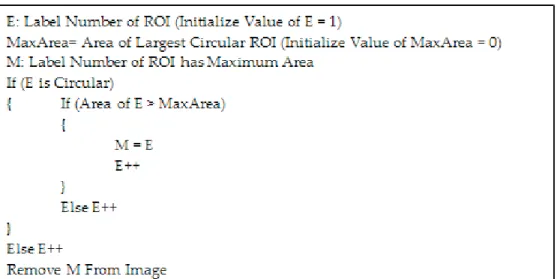
Since the aim of the present study is to detect aRMD de-veloped in the macula region, the optic disc should be eli-minated from the images. The optic disc has a diameter of around 1.5 mm. The blood vessels in the retina merge in the optic disc. Because of these characteristics of the optic disc, it is considered to be a region with fixed features in the re-tinal images. In the study conducted, a rule-based detection of the optic disc is performed. Then, the perimeter, area, and shape features of the detected RoI’s are identified according to the criteria and marked in the images.
The optic disc is usually located as the largest area in the spherical structure. The rule that detects and eliminates the optic disc in the images can be seen in Figure 4. Figure 5 shows the camera image of fundus when the optic disc is eliminated.
2.5 Detection Stage
In the final stage, aRMD in the macula region of the re-tina is detected and marked. Figure 5 (a) shows the calcu-lated value of the drusen region in a sample FFa image. In Figure 5 (b), the region where aRMD has developed is mar-ked and indicated with a perimeter in the original image. at this stage, the area of the detected macula region is compu-ted and recorded. This information aids ophthalmologists in assessing the progress of the disease and response to the tre-atment.
Figure 5. (a) Image with clarified borders (b) image obtained through optic disc elimination
III. RESULTS AND DISCUSSION
To be able to measure the success rate of the method emp-loyed in aRMD detection, the developed CaD system was tested by an ophthalmologist and the success rate of the app-lied method was determined. For accurate detection of RoI in the images obtained through the implementation of the CaD
131 system, certain criteria were defined. as seen in Table 1, the values calculated by using four basic values, True Positive (TP), False Positive (FP), False Negative (FN), True Nega-tive (TN), were used as the performance criteria to assess the results of all tests implemented on the medical images [21].
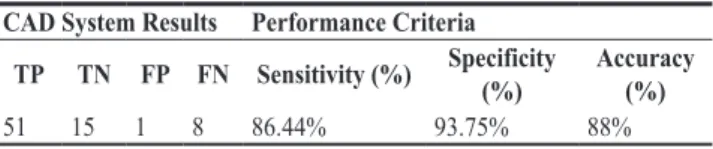
Table 1. CaD System Results and Performance Criteria
CAD System Results Performance Criteria
TP TN FP FN Sensitivity (%) Specificity (%) Accuracy (%)
51 15 1 8 86.44% 93.75% 88%
The developed CaD system was used on 75 retinal images, 16 of which were healthy and 59 of which exhibi-ted aRMD. Then, the elimination of the optic disc from the image and accurate marking of the macula region that develo-ped aRMD were tested. of the 75 images, 66 of them (TP and TN) were detected accurately while 9 (FP and FN) were false detections. The assessment results were expressed as perfor-mance criteria. Table 1 shows the perforperfor-mance criteria obta-ined by application of the CaD system. Based on the calcu-lations, the sensitivity value was found to be 86.44% and the specificity was 93.75%. Through the computer-aided detec-tion of aRMD developed in the retina, the test conducted on 75 FFa images achieved an accuracy rate of 88%. Further-more, the area of each region marked as diseased on FFa ima-ges was calculated, and individual sizes of each region as well as the total size of the diseased region were determined.
In addition to increasing the accuracy of our previous work [9], the areas of interests of the aRMD disease in the images were calculated in this study.The database has simi-lar feature with in [15]. our results show sensitive of the al-gorithm is higher but accuracy is not as good as [15]. But our algorithm has capability to find area and can make a compa-rison with time. In [15] authors only work with selected 20 images. In this work, the algorithm was tested on more ima-ges so the accuracy could be rule out.
IV. CONCLUSIONS
In this study, a computer-aided detection system for aRMD was performed on healthy and diseased FFa images. For the detection of aRMD, by utilizing the shape differ-ences of the blood vessels, their visibility was reduced from the images. Following the segmentation stage, the character-istic structural features that could differentiate aRMD were analyzed, RoIs were labeled, and the optic disc was elimi-nated by using its specific features on the retina to separate the optic disc from the macula region, where aRMD had de-veloped. on the image, the regions labeled as drusen were
marked over the original image to be detected, and their ar-eal sizes were calculated and then displayed. In this way, ophthalmologists can now compare FFa images of patients taken in different times, and monitor the changes in drusen regions that occur over time.
The developed method contributes to the literature with morphological image processing stages and the designed ap-proach. In the designed CaD system, the aim is to develop a method that could be used in the diagnosis and monitoring of a number of eye diseases, such as retinopathy of prema-turity, diabetic retinopathy, and retinal detachment, to facili-tate the work processes of ophthalmologists.
In the literature, studies conducted on retinas are per-formed on two-dimensional images. In the future, the tar-get is to develop three-dimensional retinal images to assist in the diagnosis of retinal diseases.
References
[1] Edwards, M., Bressler, N., & Raja, S. (1999). Macular
disor-ders-Age-related macular degeneration. Ophthalmology, 1st
ed. London, UK: Mosby International, 8.
[2] kılınç, D., Borandağ, E., Yücalar, F., Tunalı, V., Şimsek, M.,
& Özçift, a. (2016). kNN algoritması ve r dili ile metin ma-denciliği kullanılarak bilimsel makale tasnifi.
[3] Coleman, H. R., Chan, C.-C., Ferris, F. l., & Chew, E. Y.
(2008). age-related macular degeneration. The Lancet,
372(9652), 1835-1845.
[4] Ding, X., Patel, M., & Chan, C.-C. (2009). Molecular
patho-logy of age-related macular degeneration. Progress in retinal
and eye research, 28(1), 1-18.
[5] Novotny, H. R., & alvis, D. l. (1961). a method of
photog-raphing fluorescence in circulating blood in the human retina.
Circulation, 24(1), 82-86.
[6] kwan, a. S., Barry, C., Mcallister, I. l., & Constable, I.
(2006). Fluorescein angiography and adverse drug reactions
revisited: the Lions Eye experience. Clinical & experimental ophthalmology, 34(1), 33-38.
[7] Geng, l., Shao, Y.-T., Xiao, Z.-T., Zhang, F., Wu, J., li, M.,
& Shan, C.-Y. (2014). Fundus optic disc localization and seg-mentation method based on phase congruency. Bio-medical
materials and engineering, 24(6), 3223-3229.
[8] Pourreza, R., Pourreza, H., & Banaee, T. (2010).
Segmenta-tion of blood vessels in fundus color images by Radon trans-form and morphological reconstruction. Paper presented at
the advanced Computational Intelligence (IWaCI), 2010 Third International Workshop on.
[9] Calik, E., Dogan, B., & ucan, o. N. (2015). Computer Aided
Detection of age related macular degeneration in retinal ima-ges. Paper presented at the Signal Processing and
132 [10] Soares, J. V., leandro, J. J., Cesar, R. M., Jelinek, H. F., &
Cree, M. J. (2006). Retinal vessel segmentation using the 2-D Gabor wavelet and supervised classification. Medical
Ima-ging, IEEE Transactions on, 25(9), 1214-1222.
[11] Freund, D. E., Bressler, N., & Burlina, P. (2009). Automated
detection of drusen in the macula. Paper presented at the
Bio-medical Imaging: From Nano to Macro, 2009. ISBI’09. IEEE International Symposium on.
[12] abramoff, M. D., & Niemeijer, M. (2006). The automatic
de-tection of the optic disc location in retinal images using optic disc location regression. Paper presented at the Engineering
in Medicine and Biology Society, 2006. EMBS’06. 28th an-nual International Conference of the IEEE.
[13] Brandon, l., & Hoover, a. (2003). Drusen detection in a
reti-nal image using multi-level areti-nalysis Medical Image
Compu-ting and Computer-Assisted Intervention-MICCAI 2003 (pp.
618-625): Springer.
[14] Güven, a. (2013). automatic detection of age-related
macu-lar degeneration pathologies in retinal fundus images.
Com-puter methods in biomechanics and biomedical engineering, 16(4), 425-434.
[15] Yavuz, Z., & köse, C. (2011). Retinal blood vessel
seg-mentation using Gabor filter and top-hat transform. Paper
presented at the Signal Processing and Communications app-lications (SIu), 2011 IEEE 19th Conference on.
[16] Joseph, M. S. G. (2015). automated Drusen Detection and
Quantification for Early Identification of age Related Macu-lar Degeneration in Retinal Images using analytical Model-ling Algorithms.
[17] Vingerling, J. R., Dielemans, I., Hofman, a., Grobbee, D.
E., Hijmering, M., kramer, C. F., & de Jong, P. T. (1995). The prevalence of age-related maculopathy in the Rotterdam Study. Ophthalmology, 102(2), 205-210.
[18] Jonasson, F., arnarsson, a., Sverrisson, T., Stefánsson, E.,
Sigurdsson, H., Gislason, I., . . . Bird, a. (2003). 5-year in-cidence of age-related maculopathy-Reykjavik Eye study.
Investigative Ophthalmology & Visual Science, 44(13),
3083-3083.
[19] McCormick, B., & Goldbaum, M. (1975). STARE=
Structu-red Analysis of the Retina: Image processing of TV fundus image. Paper presented at the Jet Propulsion laboratory,
Pa-sadena, Ca: uSa-Japan Workshop on Image Processing.
[20] Dougherty, G. (2009). Digital image processing for medical
applications: Cambridge university Press.
[21] Dhawan, a. P. (2011). Medical image analysis (Vol. 31): John