1 2 3 4 5 6 7 8 9 10 11 12 13 14 15 16 17 18 19 20 21 22 23 24 25 26 27 28 29 30 31 32 33 34 35 36 37 38 39 40 41 42 43 44 45 46 47 48 49 50 51 52 53 54 55 56 57
Lyotropic Liquid Crystalline Mesophases Made of
Salt-Acid-Surfactant Systems for the Synthesis of Novel Mesoporous
Lithium Metal Phosphates
Işıl Uzunok,
[a]Jeonghun Kim,
[b, c]Tuluhan O. Çolak,
[a]Dae Sik Kim,
[d]Hansu Kim,
[d]Minjun Kim,
[c]Yusuke Yamauchi,
[b, c, e]and Ömer Dag*
[a, f]Mesoporous lithium metal phosphates are an important class of materials for the development of lithium ion batteries. However, there is a limited success in producing mesoporous lithium metal phosphates in the literature. Here, a lyotropic liquid crystalline (LLC) templating method was employed to synthe-size the first examples of LiMPO4(LMP) of Mn(II), Co(II), and Ni (II). A homogeneous aqueous solution of lithium and transition metal nitrate salts, phosphoric acid (PA), and surfactant (P123) can be spin coated or drop-cast coated over glass slides to form the LLC mesophases which can be calcined into mesoporous
amorphous LMPs (MA-LMPs). The metal salts of Mn(II), Co(II) and Ni(II) produce MA-LMPs that crystallize into olivine structures by heat treatment of the LLC mesophase. The Fe(II) compound undergoes air oxidation. Therefore, both Fe(II) and Fe(III) precursors produce a crystalline Li3Fe2(PO4)3phase at over 400°C. The MA-LMPs show no reactivity towards lithium, however the crystalline iron compound exhibits electrochemical reactivity with lithium and a good electrochemical energy storage ability using a lithium-ion battery test.
Introduction
Mesoporous silicate was discovered more than 25 years ago[1,2] and has been explored extensively in order to fully control on its structure and morphology. Currently, several methods to synthesize mesoporous silica with various structures and morphologies[5–8]
are available. A similar effort has also been devoted to periodic mesoporous organosilicates[9]
and titania.[10]
There have been also many preparation methods to produce mesoporous metal oxides[10]
by hard-[11]
or soft-templating[12] approaches. However, there are few methods to synthesize metal chalcogenides,[13]
metal phosphates,[14–16]
and metal sulphates[17]
which are highly important for applications in energy production and storage.[14–22]
To fully understand and control the properties of these materials, many efforts must be undertaken. Recent investigations show that mesoporous materials (MMs) have many advantages in energy generation, conversion, and storage.[16–22]
MMs offer many advantages over their bulk counterparts, such as high surface area, size effects (both electronic and thermodynamic), reactivity in confined space, better electronic and ionic conductivity.[23–27]
Mesoporous metal phosphates (MMPs) are important in energy applications. Many transition metal phosphates are as good candidates as cathode materials in lithium ion batteries or supercapacitors.[16,28–32] However, the synthesis of mesoporous lithium metal phosphates (LMPs) is still a big challenge. A fast reaction between the metal ion precursors and phosphate ions in the solution phase yields large crystallites that are impossible to assemble into mesostructures by surfactants or micelles. A good kinetic control, during the formation of the LMPs, is necessary in order to develop the desired morphology and pore systems. Optimal kinetic control in the assembly process may have a positive impact on the development of high power energy storage systems.[33,34] There are still limited number of synthetic methods for the successful synthesis of mesoporous metal phosphates (MMPs) and none for the LMPs in the literature.[14,16,31,32,35–38] However, there have been attempts to control the formation kinetics in these processes using sub-stituted phosphates.[14,37] The metal phosphate formation kinetics and self-assembly kinetics need to be adjusted to expand the possibilities of MMPs and LMPs for their use in [a] I. Uzunok, T. O. Çolak, Prof. Ö. Dag
Department of Chemistry Bilkent University 06800 Ankara (Turkey) E-mail: [email protected] [b] Dr. J. Kim, Prof. Y. Yamauchi
Key Laboratory of Eco-Chemical Engineering College of Chemistry and Molecular Engineering Qingdao University of Science and Technology Qingdao 266042 (P. R. China)
[c] Dr. J. Kim, M. Kim, Prof. Y. Yamauchi School of Chemical Engineering and Australian Institute for Bioengineering and Nanotechnology (AIBN)
The University of Queensland Brisbane, QLD 4072 (Australia) [d] Dr. D. S. Kim, Prof. H. Kim
Department of Energy Engineering Hanyang University
Seoul 133-791 (Republic of Korea) [e] Prof. Y. Yamauchi
International Center for Materials Nanoarchitectonics (WPI-MANA) National Institute for Materials Science (NIMS)
1-1 Namiki, Tsukuba, Ibaraki 305-0044 (Japan) [f] Prof. Ö. Dag
UNAM-National Nanotechnology Research Center and Institute of Materials Science and Nanotechnology Bilkent University
06800 Ankara (Turkey)
Supporting information for this article is available on the WWW under https://doi.org/10.1002/cplu.201900435
1 2 3 4 5 6 7 8 9 10 11 12 13 14 15 16 17 18 19 20 21 22 23 24 25 26 27 28 29 30 31 32 33 34 35 36 37 38 39 40 41 42 43 44 45 46 47 48 49 50 51 52 53 54 55 56 57
energy applications. A good kinetic control may be achieved by reducing/controlling the phosphate (PO43 ) ion concentration in the synthesis to control the metal phosphate formation and enhancing the micelle formation to increase the speed of the assembly process.
Here, we show that a better kinetic control over the metal phosphate formation could be achieved using phosphoric acid (PA, weak acid) as a phosphate source and by introducing lyotropic anions (such as phosphate related ions, H2PO4 , HPO42 , and PO43 ) for the assembly of surfactant molecules into micelles.[15,16]
PA-non-ionic surfactant[39]
and salt-non-ionic surfactant mesophases[40–42]
are all important in the process and need further exploration. Here, we show that salt-PA-surfactant mesophases can be used as a media to synthesize mesoporous LMP powders in various morphologies. Four different transition metal precursors (nitrate salts of Mn(II), Fe(II), Co(II) and Ni(II)) and lithium salts (LiNO3 and LiH2PO4) and P123 have been employed to develop a general method to obtain the mesoporous lithium metal phosphates (MLMPs).
Results and Discussion
PA-P123 Mesophases
PA C12E10 (C12EO10 is 10-lauryl ether) surfactant mesophase is known in the literature.[39]
This work investigates, for the first time, the formation of LLC mesophase of PA-P123, a mixture of PA and P123, over a broad range of PA/P123 mole ratios, from 10 to 100. Coating of a clear aqueous solution of PA and P123 produces a clear gel, and a gelation happens upon complete evaporation of the excess water within a few minutes to hours, depending on the thickness. The gels, in all compositions, diffract at small angles. Figure 1 shows small angle XRD patterns of 10PA-P123 and 20PA-P123 and ATR-FTIR spectra of 10, 30, 60, and 90 PA/P123 mole ratio PA-P123 mesophases (numbers are PA/P123 mole ratio). The gels, spread over glass slides, display intense diffraction lines at low PA/P123. The samples of 10 up to 30PA-P123 are highly ordered/oriented, such that the 20PA-P123 displays up to 8 diffraction lines that can be indexed to a cubic mesostructure with a unit cell parameter a of 108.9 Å. However, the order is lost at higher acid concentrations (over 30 up to 100 PA/P123) and only the (100) line and broader diffractions lines at higher angles are present in the XRD patterns.
ATR-FTIR spectra of the gels (PA-P123) display two sharp peaks at 978 and 471 cm 1 due to anti-symmetric stretching and bending modes of PA in the gel phase, respectively. The tail to lower energy of the peak at 978 cm 1 is likely due to symmetric stretching of the PA in the media, showing the interaction of PA with water and P123. The peaks at 1007 and 488 cm 1, observed in 10PA-P123 gradually red-shift by 30 and 17 cm 1, respectively, by increasing the PA/P123 mole ratio from 10 to 90 and some changes in the surfactant related peaks (broadening in the ν-CH stretching modes around 2800– 3000 cm 1 and δ-CH
2 around 1250–1500 cm 1 and a red-shift by 30 cm 1 in the ν-CO stretching modes) are observed. The
peaks due to the P-OH and water (both stretching and bending) are extremely broad and the stretching mode of water is quite red-shifted, indicating that the water species are highly protonated and are strongly interacting with the surfactant moiety. The δ-P O H, bending mode, appears as a broad feature tailing from 850 to 650 cm 1
. These spectral changes indicate strong interactions between the water and PA and between the water-PA and P123 in the gel-phase to form stable mesophases in such broad PA/P123 mole ratios.
Lyotropic Liquid Crystalline Mesophases
The salt-P123 systems of Li(I), Zn(II), Cd(II), and Co(II) salts have also been previously investigated.[40,41]
However, the LiH2PO4 -P123, Fe(II)--P123, Mn(II)--P123, Ni(II)-P123 and Li(I)-M(II)-PA-P123 mesophases were investigated for the first time in the content of this work. Establishing the lyotropic liquid crystalline (LLC) mesophases of individual salt-P123, PA-P123, and a mixture of salts-acid-surfactants are important to establish a background information for this work. The salts-P123 and PA-P123 meso-phases are stable for a long time both in the solution phase and in the LLC mesophase. However, combining phosphate and metal precursors initiates the formation of metal phosphates, where the LLC phase slowly transforms to a disordered mesostructured solid. Therefore, the salt-P123 and PA-P123 solutions were prepared separately and then mixed prior to synthesis of mesostructured metal phosphates. It is also important to note that the Li(I)-Ni(II)-P123 and Li(I)-Co(II)-P123 clear solutions are stable indefinitely (no precipitation), but the Mn(II) and Fe(II) solutions require some attention and need to be immediately coated and converted into the lithium metal phosphates (LMPs) using freshly prepared solutions. The
Figure 1. XRD patterns of #PA-P123 mesophases, where # is (a) 10 and (b) 20
(black line is fresh and red line is aged samples). (c) ATR-FTR spectra of #PA-P123 mesophases, # is 10, 30, 60, and 90 as indicated in the spectra.
1 2 3 4 5 6 7 8 9 10 11 12 13 14 15 16 17 18 19 20 21 22 23 24 25 26 27 28 29 30 31 32 33 34 35 36 37 38 39 40 41 42 43 44 45 46 47 48 49 50 51 52 53 54 55 56 57
homogenization to obtain clear solutions may require addi-tional time, during this period in the Mn(II) system, there is a small amount of precipitation (less than 1 % of the initial precursors). However, the filtered solutions are stable and remain clear in all metal systems, investigated in this work. Note also that the solutions are highly acidic, typically in the pH range of 1.08 to 1.64 depending on the PA concentrations in the solutions, and also that the precipitation of some metal phosphate, such as in the Mn(II) solution, further acidifies those solutions, therefore the Mn(II) solutions are slightly more acidic. This is important for the growth and assembly of the growing LMP particles into mesostructures.
Adding the salts (both lithium and transition metal salts) to the PA-P123 mesophase also enhanced the meso-order; the fresh Li(I)-M(II)-PA-P123 mesophases with a very high ingre-dients/P123 mole ratios (up to 90 : 90 : 90 : 1 Li(I) : M(II) : PA : P123) also broadly diffract 2 lines at small angles in the 1.5 to 4°(2θ) region, see Figure 2. However, the Li(I)-M(II)-PA-P123 LLC mesophases are not stable to aging, even at room temperature (RT) and/or mild heat treatments (see the inset in Figure 2), the meso-order is partially lost. The diffraction lines lose intensity and disappear upon aging and/or heating at around 50°C, see Figure 2.
The LiNO3-Fe(NO3)3· 9H2O-PA-P123 solutions are not stable due to the Fe(III) that slowly undergoes hydrolysis and condensation reactions to form FeO(OH) species in the solution. To prevent this, we used [Fe(H2O)6]Cl2 as the iron source, but the presence of the nitrate from the LiNO3 also results in the formation of Fe(III) species. Therefore, the lithium source was also changed to LiCl to form stable mesophases with P123.[40] The solutions of LiCl-FeCl2-PA-P123 are stable for an extended period (days to months). However, coating over a substrate cause slow oxidation of the Fe(II) to Fe(III), which can be
observed by the change of the colour in the drop-cast coated film, from colourless to brick-red. The drop-cast coated Li(I)-Fe (II)-PA-P123 mesophases must be quickly calcined to prevent the formation of Fe2O3. Therefore, the Mn(II) and Fe(II) systems needs more investigation, both in the solution and gel phases.
Synthesis and Characterization of Mesoporous LMPs
By aging the drop-cast coated samples at room temperature or at higher temperatures, amorphous mesostructured LMP par-ticles form and further heating to 300°C produces amorphous mesoporous LMPs. The synthesis of LMPs has been carried out in all composition (10 to 90 mole ratios, keeping the Li(I) : M (II) : PA mole ratio of 1 : 1 : 1) using Li(I)-Mn(II)-PA-P123 LLC mesophases. The samples were prepared using either drop-cast coating or spin coating methods. The spin coated samples were used for TEM analysis and the drop-cast coated samples were used to collect the XRD patterns, N2 adsorption-desorption isotherms, and temperature dependent crystallinity and poros-ity related data.
The coated gel samples slowly undergo a polymerization reaction to form LMPs at as low as RT. Figure 3 shows a set of ATR-FTIR spectra of 60Li(I)-60Ni(II)-60PA-P123 upon aging at RT over time and elevated temperatures. The peaks related to water, nitrate, and PA lose their intensity during RT aging, indicating the formation of metal phosphate and the removal of the nitrate as nitric acid or nitric oxides from the media, see Figure 3a. The ATR-FTIR spectrum of the Li(I)-Ni(II)-PA-P123 further changes upon heating to 50°C, Figure 3b. The peaks corresponding to PA slowly disappear and metal phosphate related peaks appear over time, see Figure 3. The nitrate peaks completely disappear from the spectra at 250°C and the spectra of the samples do not change at higher temperatures up to the crystallization temperature, compare spectra in Figure 3b. Similar spectral changes were also observed in all other LMP systems; therefore, they are not included in the text.
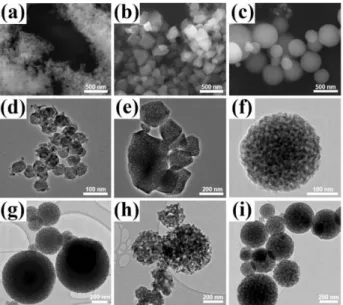
The quantity of inorganic ingredients (Li(I) and M(II) salts and PA) and the temperature of aging/calcination determine the morphology of the LMP particles, see Figure 4. These samples were abbreviated as DLMP# (where D stands for drop-cast coated, L, M, and P stands for lithium, transition metal, and phosphate and the # is the PA/P123 mole ratio). Figure 4 shows
Figure 2. XRD patterns of Li(I) : Ni(II) : PA : P123 with mole ratios of
30 : 30 : 30 : 1, 60 : 60 : 60 : 1, and 90 : 90 : 90 : 1. Inset is same as 30 : 30 : 30 : 1 mole ratio of Li(I) : Ni(II) : PA : P123 heated from RT to 100°C.
Figure 3. ATR-FTIR spectra of Li(I)-Ni(II)-PA-P123 at (a) RT over time and (b)
1 2 3 4 5 6 7 8 9 10 11 12 13 14 15 16 17 18 19 20 21 22 23 24 25 26 27 28 29 30 31 32 33 34 35 36 37 38 39 40 41 42 43 44 45 46 47 48 49 50 51 52 53 54 55 56 57
a set of representative SEM and TEM images of the samples, obtained from DLCoP10, DLCoP40, and DLCoP90 and DLNiP60, DLMnP60, and DLCoP60, calcined at 300°C. The particles are uniform with a crystal-like morphology, obtained from the low ingredient (10 to 40) or high P123 concentrations and low temperatures (RT to 100°C), but they are spherical at higher ingredient (40 to 90) concentrations and high temperatures (above 100°C). Both the SEM and TEM images confirm the formation of uniform spherical particles with large pores and pore-walls. Note also that the amorphous samples are beam sensitive and undergo crystallization during HRTEM imaging, see Figure S1 (Supporting Information).
In general, the particles are big (typically < 100 nm) in low and small (> 50 nm) in the high P123 concentrations, likely due to enhanced seeding step with increasing the ingredients concentrations in the LLC media. Both LiMnPO4 and LiCoPO4 samples were prepared over a broad range of transition metal ion (M(II)) concentrations, from 10 to 90 M(II)/P123 mole ratio by an increment of 10 M(II) per P123 to show how the mesophases are flexible to the ingredient concentrations, see Figure S2. However, 3 concentrations (30 as low, 60 as intermediate, and 90 as high Mn(II)/P123 mole ratio) were chosen to investigate and to optimize the synthesis conditions for all LMPs. Note also that the shape of the particles, obtained from these 3 compositions, are very similar in all LMPs.
The N2adsorption-desorption isotherms of all LMPs display type IV isotherms, characteristic of the mesoporous materials and consistent with the images, see Figures 5a and S2. All DLMP30, DLMP60, and DLMP90 particles are amorphous and spherical up to 400°C. However, the surface area of DLMP60 is the largest of all samples, therefore most data were collected using the calcined DLMP60 samples. The Brunauer-Emmett-Teller (BET) surface area of LMPs, calcined at 300°C, vary between 19 and 79 m2/g, depending on the transition metal
and inorganic ingredient concentration in the mesophase. The largest surface area was observed in the Ni(II) samples with a surface area of 79 m2
/g, a Barret-Joyner-Halenda (BJH) pore size of 8.9 nm, and pore-wall thickness of about 15 nm, Table 1. The BET surface areas are 35 and 23 m2
/g for the mesoporous LiMnPO4 and LiCoPO4 samples, and 19 m2/g in Li3Fe2(PO4)3, respectively, calcined at 300°C. The lowest surface area was observed in the iron samples, likely due to the presence of some bulk Fe2O3, see latter. Further annealing of the samples at 500°C reduces the surface area from 79 to 14, 35 to 2, 23 to 5, and 19 to 7 m2
/g in the LiNiPO4, LiMnPO4, LiCoPO4 and iron compound, respectively, indicating a large increase in the pore-size and pore-wall thickness. The expansion of the pore-pore-size to 25–30 nm and crystallization of the pore-walls were observed in all LMPs, see Figures 5b and S3. The line shape of the isotherms reflects these changes in the pore system as observed in mesoporous calcium hydroxyapatite, prepared using a similar method.[15]
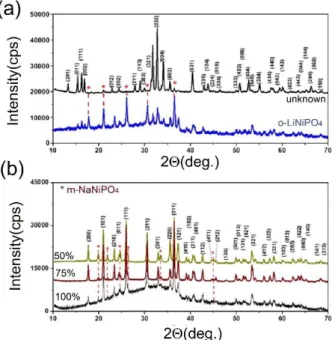
The crystallization of the pore-walls has also been shown using XRD and TEM imaging techniques. Figures 6 and 7 show sets of XRD patterns, obtained from the DLMP60 of Ni(II), Mn(II), and Co(II). Clearly, all LMPs are amorphous up to 400°C and become highly crystalline above 500°C. We also noticed a profound difference between direct heating of the drop cast coated samples over glass substrates to 500°C and 300°C calcination over a glass slide, followed by annealing at 500°C in an alumina sample holder. The second method produced the LMPs but the first method produced an Na version, NaMPs with a maricite structure. An ion exchange reaction occurs between the LMPs and glass substrates (the exchange behaviour will be
Figure 4. SEM (a-c) and TEM (d-f) images of LiCoPO4, obtained from
DLCoP10, DLCoP40, and DLCoP90 and TEM images of (g) LiNiPO4, (h)
LiMnPO4, and (i) LiCoPO4.
Figure 5. (a) N2adsorption-desorption isotherms of 300 and
DNi60-500 and (b) their BJH pore-size distribution plots.
Table 1. N2adsorption-desorption related data of LMPs (SA = surface area,
PS = pore size, and PV = pore volume).
Samples SA [m2/g] PS [nm] PV [cm3/g] DLCoP60-300 23 14.8 0.124 DLCoP60-500 5 28.1 0.008 DLFeP60-300 19 14.2 0.072 DLFeP60-500 7 36.7 0.059 DLMnP60-300 35 30.4 0.243 DLMnP60-500 2 26.5 0.009 DLNiP60-300 79 8.9 0.236 DLNiP60-500 14 42.6 0.137
1 2 3 4 5 6 7 8 9 10 11 12 13 14 15 16 17 18 19 20 21 22 23 24 25 26 27 28 29 30 31 32 33 34 35 36 37 38 39 40 41 42 43 44 45 46 47 48 49 50 51 52 53 54 55 56 57
discussed elsewhere, and not be included in this work to mainly focus on LMPs).
The DLCoP60 and DLMnP60 display diffraction lines that can be indexed to an olivine phase (orthorhombic, Pnba space group), denoted as o-LiMnPO4and o-LiCoPO4, see Figure 6. The unit cell parameters, evaluated from the patterns, are consistent with the PDF cards and listed in Table 2. The DLFeP60 and DLNiP60 also produce amorphous compounds at 300°C, but they crystallize over 500°C to a mixture of a few crystalline
metal phosphate phases. Interestingly, all metals formed an olivine structure of LMPs, except Ni(II), which produces a nickel deficient metal phosphate under a similar reaction condition. The reaction conditions are slightly modified by increasing the amount of Li(I) in the initial solution by 10 to 20 mol % to produce an olivine rich mixture. However, the synthesis condition must be set properly. In the excess LiNO3cases, the calcination at low temperature and annealing to 500°C produces o-LiNiPO4 with another crystalline unknown phase. However direct calcination, over glass substrate, at 500°C even with excess lithium produces the unknown phase, see Figure S4 and Table 2. The formation of the olivine phase can also be enhanced by adjusting the pH of the initial solution. To increase the pH of the solution, we systematically added LiH2PO4in place of both PA and LiNO3as the phosphate and Li(I) source in the initial solutions.
Figure 7 shows the changes in the XRD patterns of the LNiP samples, calcined at 300°C and then annealed at 500°C; the samples were prepared using the solutions with an increasing LiH2PO4/PA ratio of the initial solution. Clearly, if the lithium and phosphate sources are LiNO3and PA, the unknown phase forms at 500°C. However, replacing the LiNO3and PA with a 25 mol % LiH2PO4 source produces a mixture of o-LiNiPO4 and the unknown phases, see Figure 7a. Further increase of the LiH2PO4 amount in the initial solution to a 50 % LiH2PO4 (50 % of Li(I) and PO43 source is LiH2PO4 and the other 50 % is from LiNO3 and PA) and to a 75 % LiH2PO4produce a mixture with much of the olivine phase.
In addition to the o-LiNiPO4 (orthorhombic, unit cell parameters of a = 10.032(7) Å, b = 5.853(9) Å, c = 4.677(8) Å and a unit cell volume of 274.7 Å3
) phase, a maricite NaNiPO4 (m-NaNiPO4, orthorhombic, unit cell parameters of a = 6.123(5) Å, b = 8.935(8) Å, c = 4.560(0) Å, and V = 249.5 Å3) phase also forms.[43–45]
We found that the further calcination of the drop-cast coated samples undergo an ion-change reaction over the glass slides at higher temperatures. Over 300°C the ion-exchange of Na(I) of glass and Li(I) of the samples begins and completes at around 500°C. Therefore, the further annealing processes must be carried by collecting the samples from the glass surface and annealing in alumina sample holders. This ensures crystalline o-LMPs. Otherwise, the direct synthesis over glass slides at 500°C or calcination at 300°C followed by 500°C annealing over glass slides produces the maricite NaMP (m-NaMP) phases.[46,47] The m-NaMP formation will be discussed elsewhere. This article focuses on the synthesis of the meso-porous olivine phase of LMPs.
Figure 6. PXRD patterns of calcined (a) LiCoPO4and (b) LiMnPO4at 300°C
(bottom) and annealed to 500°C (top) and middle ones are reference data.
Figure 7. PXRD patterns of LiNiPO4, prepared using (a) 0 and 25 % and (b) 50,
75, and 100 % LiH2PO4(top to bottom) as lithium and phosphate source at
500°C.
Table 2. Unit cell parameters of the mesoporous LiMPO4s. .
Materials a [Å] b [Å] c [Å] V [Å3] o-LiMnPO4[a] 10.435 6.096 4.735 301.2 o-LiCoPO4[a] 10.202 5.923 4.703 284.2 o-LiNiPO4[a] 10.033 5.854 4.678 274.7 FePO4[b] 5.035 5.035 11.245 246.9 Li3Fe2(PO4)3[c] 8.571 12.017 8.616 887.4
1 2 3 4 5 6 7 8 9 10 11 12 13 14 15 16 17 18 19 20 21 22 23 24 25 26 27 28 29 30 31 32 33 34 35 36 37 38 39 40 41 42 43 44 45 46 47 48 49 50 51 52 53 54 55 56 57
Since the LFeP system behaved differently than the other LMPs, we also investigated the lithium iron phosphate (LFeP) system using two different iron sources, namely Fe(NO3)3· 9H2O and FeCl2· 6H2O salts. Figure 8 shows the XRD pattern of the calcination products that were identified as a mixture of Fe2O3, orthorhombic and monoclinic Li3Fe2(PO4)3 and Na3Fe2(PO4)3, respectively, depending on the ingredients and pH of the initial solutions. The stoichiometric ingredient concentrations (1 : 1 : 1, Li : Fe : PA for LiFePO4) produced various Fe(III) compounds. Although, the iron ion in solution phases are stabilized as 2 + (in case of FeCl2) and 3 + (in case of Fe(NO3)3) by adding excess acid to the solutions, the calcination in the oven produced Fe (III) compounds. Since the products are predominantly Fe(III), we changed the stoichiometry in the solution phase as 3 : 2 : 3 (Li(I) : Fe(III) (or Fe(II)) : PA) to produce pure phase of the Li3Fe2(PO4)3phase and to 1 : 1 (Fe(III) : PA) to produce the FePO4. If the Fe(NO3)3was used as an iron source, the calcination of the gel phase produced a pure Li3Fe2(PO4)3 but the FeCl2 also produced the same compound with a small amount of Fe2O3 impurity.
We also employed the LiH2PO4 as the lithium and phosphate source. However, the solution phase was not stable and FePO4· 2H2O crystallites precipitated at room temperature, see Figure S5a. Notice that the pH of this solution is above 3.5 and adding excess HCl (decreasing the pH) stabilized the solution phase (no precipitation) and produced the same products. We also prepared the gel phase and calcination product of iron nitrate, PA, and P123 mixture (without a lithium source) to obtain FePO4. Figure S5b shows the XRD pattern of the calcination product, FePO4 powder with some undefined phase (marked with * in the pattern). The unit cell parameters of FePO4were evaluated to be a = b = 5.034 Å, c = 11.245 Å, V = 246.85 Å3, and a space group of P321. The product has a mixture of two morphologies, spherical and film particles, see Figure S6. Further investigation is needed to elucidate the undefined phases in the LFePs and FePO4.
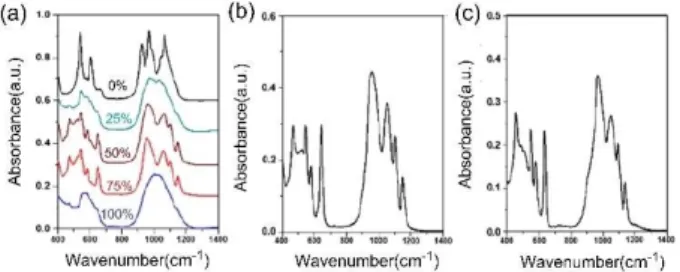
Both the amorphous and crystalline phases of the above materials were further investigated using ATR-FTIR spectro-scopy. The amorphous phases display broad features in the phosphate stretching (900–1200 cm 1) and bending regions (450–650 cm 1), see Figure 9. The origin of broadening is due to
presence of defects and the breaking of the periodicity of the lattice sides in the amorphous LMPs.[48]
However, the crystalline samples have characteristic peaks of the olivine phases in all LMPs, Figure 9b–c. Spectra of the olivine LMPs display very similar features and can be used to identify the olivine phases. The sharp peaks at 1138, 1092, 1049 (due to antisymmetric stretching modes), 967 cm 1
(symmetric stretching mode) and peaks at 634, 577, 548, 509, 488, 454 cm 1
(due to bending modes of the phosphate units and Li O and Mn O stretching modes) are observed in the o-LiMnPO4. These features are slightly blue shifted and observed at 1150, 1101, 1052, 958, 643, 578, 545, 522, and 467 cm 1
in the o-LiCoPO4.
Increasing the lithium salt amount by 10 to 20 mol % (after the calcination at 300°C and then annealing at 500°C) produces the o-LiNiPO4 phase but direct calcination at 500°C produces the unknown phase. ATR-FTIR spectra of these samples are given in Figure S7. Clearly, the spectral changes correlate with the XRD results (Figures 9 and S7). The spectral changes, with increasing LiH2PO4 in the initial solution, were also monitored using the ATR-FTIR spectroscopy. With a replacement of 25 % of LiNO3and PA with LiH2PO4, new peaks emerge (in the ATR-FTIR spectra) at 1147 (sharp), 1098 (sharp), 1058 cm 1
(broad) due antisymmetric stretching modes and a broad peak at 958 cm 1 due to symmetric stretching mode of the phosphate units of the o-LiNiPO4phase. The peaks at 661, 647, 580, 542, 520, and 470 cm 1
belong to the bending modes of phosphate units and the stretching modes of the Li O and Ni O bonds. These features gradually dominate the spectra with an increasing LiH2PO4ratio in the synthesis solution, see Figure 9a. The broad spectra are observed in both 25 and 100 % LiH2PO4cases, due to presence of the amorphous phases in the samples. The spectral features and changes accord well with the changes in the XRD patterns. Simply, the olivine phase dominates in the spectra with an increasing LiH2PO4 precursor in the synthesis. The shape of the LNiP particles also change with increasing LiH2PO4, as shown in the SEM images, see Figure S8.
To further analyse the LMPs, K-edge X-ray absorption near edge structure (XANES) data were also collected in the SESAME (Jordon) synchrotron facility. Figure 10 shows a series of K-edge XANES spectra of the LMPs. The XANES spectra display weak pre-edge peaks on the low energy side of Eo, due to a 1s!3d transition, a strong 1s!4p transition on the K-edge, and a peak at high energy of the edge due to a 1s! continuum transition.[49]
Figure 8. PXRD pattern of DLFeP60, calcined at (a) 300°C and (b) 500°C, with PDF data of Fe2O3, Li3Fe2(PO4)3, and Na3Fe2(PO4)3.
Figure 9. ATR-FTIR spectra of (a) a set of LiNiPO4prepared using 0 to 100 %
1 2 3 4 5 6 7 8 9 10 11 12 13 14 15 16 17 18 19 20 21 22 23 24 25 26 27 28 29 30 31 32 33 34 35 36 37 38 39 40 41 42 43 44 45 46 47 48 49 50 51 52 53 54 55 56 57
The XANES spectra of LiCoPO4samples display a weak pre-edge signal at around 7710 eV due to a 1s!3d, a strong 1s! 4p transition on the K-edge, and a 1s!continuum transition at around 7724 eV, all characteristic for the Co2 +oxidation state.[49] The XANES spectrum of Co3O4 is also given in Figure 10a to compare the oxidation state of cobalt in the LiCoPO4. Notice that in Co3O4, the Co2 + and Co3 + co-exist and the 1s! continuum transition is observed at 7729 eV. The olivine structure, calcined at 300°C and 700°C displays a sharp peak at around 7724 eV, see Figure 10a.
Figure 10b shows the Ni K-edge XANES spectra of LiNiPO4 and NiO. The other phases of LNiPs also display a very similar XANES features, indicating that the Ni is in 2 + oxidation states in all LNiPs, investigated in this work. Figure 10c shows 3 spectra in the Fe K-edge region, collected from LFePs. Notice that the pre-edge line is observed at around 7114 eV due to 1s!3d transition. However, the Fe2 +
species display two peaks in this region at around 7112 eV due to 1s!3d (t2g and eg levels) transition but the Fe3 +
species display one peak at 7114 eV. Also, the 1s!continium transition is observed above 7132 eV in the iron phosphates. The sample that contains Li(I), heated at 200 and 500°C, displays relatively sharper peaks at around 7132 eV, but FePO4display two broad features at 7137 and 7148 eV region. A similar broad feature is observed after charging the LiFePO4 to FePO4, where the iron is in 3 + oxidation state. The XANES data also show that it is difficult to keep iron in a 2 + oxidation state even at 200°C. If we start with FeCl2as iron source, the iron in the product is in 3 + oxidation state under our reaction conditions (likely due to air oxidation during the calcination process).
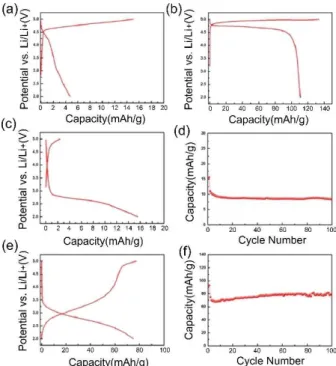
The electrochemical energy storage ability of LMPs were further investigated by making coin cells. The cells were charged/discharged on a constant current mode in the 2.0 to 5.0 V for LMPs (where M is Co, Mn, and Fe) and 2.0 to 5.4 V for LNiP versus Li/Li+
using a 1 M LiPF6in EC/DMC (3 : 7 v/v ratio) at a current density of 20 mA/g. The LMPs, calcined at 300°C showed a very low charge capacity likely due to their amorphous nature. However, the crystalline samples (calcined at 300 and annealed at 500°C) of o-LiCoPO4and LFeP showed reasonable capacities. Figure 11 shows the related data for
o-Figure 10. K-edge XANES spectra of LMPs: (a) I) 300°C and II) 500°C of LCoP and III) Co3O4, (b) I) LNiP and II) NiO, and (c) I) 200°C and II) 500°C LFeP and
III) FePO4.
Figure 11. Electrochemical performances of lithium ion cells,
dis-charge curves (a-c, and e) and cycling performances (d and f). The dis- charge-discharge curves of DLCoP60, calcined at (a) 300°C and (b) 500°C and of DLFeP60, calcined at (c) 300°C and (e) 500°C and their cycling performances (d and f), respectively.
1 2 3 4 5 6 7 8 9 10 11 12 13 14 15 16 17 18 19 20 21 22 23 24 25 26 27 28 29 30 31 32 33 34 35 36 37 38 39 40 41 42 43 44 45 46 47 48 49 50 51 52 53 54 55 56 57
LiCoPO4and LFeP samples. The Co sample showed a capacity of 110.9 mAh/g in the first cycle, but it decreased to a 14.5 % capacity after 100 cycles. Even though the LFeP is not a pure phase (as detected in the XRD and ICP-MS data, a small amount of Fe2O3and Na3Fe2(PO4)2exist in the samples, see XRD section of LFeP), it retained its 86.2 % capacity of 93 mAh/g after 100 cycles. However, both LMnP and LiNiP samples showed no reaction with the lithium ion. To improve reactivity with lithium and cyclability of mesoporous LiMPO4, further electrochemical studies are required by further optimizing the synthesis conditions.
Conclusion
The PA-P123 and LiNO3-M(II)-PA_P123 (M(II) is Mn(II), Fe(II), Co (II), and Ni(II) and also Fe(III)) form LLC mesophase in a very broad range of inorganic ingredient concentrations. The mesophase of PA-P123 is stable indefinitely in the presence of 2–3 water per PA in the media. The PA-P123 is highly ordered up to 30 PA/P123 and becomes disordered up to 100 PA/P123 mole ratios. Addition of the salts to the media enforces the meso-order up to 90 PA/P123, in the presence of 90 Li(I) and 90 M(II) per P123. However, the mixed ingredient mesophases are not stable and slowly undergo polymerization reaction to form MA-LMPs. All compositions produce MA-LMPs, with differ-ent morphologies and particle sizes up to 400°C and which have crystalline LMPs above 400°C.
The LMPs of Co(II) and Mn(II) have an olivine structure upon calcining the drop-cast coated solutions to 300°C and then annealing to 500°C. Direct calcination of the drop-cast coated samples, over glass substrates, undergo Na + ion exchange with the substrate at 500°C to produce a maricite phase (NaMPs). A similar procedure, in the case of Ni(II), produces an amorphous LNiP that undergoes ion exchange and produces Na4Ni3(PO4)2P2O7either by calcination at low temperature and then crystallization at higher temperatures or by directly calcining at high temperatures. However, increasing the LiNO3 amount by 10 % or using LiH2PO4as Li(I) and phosphate source (also higher pH) produces the olivine phase of LiNiPO4. The LFeP system is the most complicated system. Even though the Fe(II) could be stabilized in the solution phase, the calcination of Li(I)-Fe(II)-PA-P123 resulted a mixture of Fe(III) species, namely Fe2O3, Li3Fe2(PO4)3, and Na3Fe2(PO4)3. However, adding excess HNO3or HCl eliminates the Fe2O3formation. Excess acid and right composition (Li(I) : Fe(II) or Fe(III) : PA 3 : 2 : 3 in the initial Fe(II) or Fe(III) solutions) yields mesoporous Li3Fe2(PO4)4. To stop the formation of the sodium phases (NaMPs) and eliminate Na+
ion exchange (Na+
contamination), an appro-priate substrate (such as quartz, alumina or silicon etc, resist to high temperature and free of Na) must be used.
The mesoporous LMPs were further investigated using electrochemical methods to understand the reaction towards lithium of both the amorphous LMP and crystalline o-LiMPO4of all metals (Mn(II), Fe(II), Co(II), and Ni(II)). The amorphous phases showed very low charge capacities but crystalline o-LiCoPO4 and a mixture of mixed Fe(III) sample displayed around 110 and
93 mAh · g 1
charge capacities, respectively. Even though the LFeP samples were not pure, they show high durability. However, both o-LiMnPO4and LNiPs showed very low charge capacities. All mesoporous LMPs and NaMPs need further investigations to understand their applications in the synthesis of energy storage materials.
Experimental Section
General Method
10 ml clear aqueous solutions of LiNO3: [M(OH2)6](NO3)2(where M is Mn(II), Fe(II), Co(II), and Ni(II)) : H3PO4 (PA) : surfactant (P123) were first prepared. The Li : M(II) : H3PO4 mole ratio was kept 1 and the acid/P123 mole ratio has been varied from 30 to 90 mole ratio, by 30 increments.
Preparation of Salt-Surfactant Solutions (Solution A)
Solution A contains salts, half of the required surfactant and 5 ml of water. For a typical solution of 30Li–30Ni-P123 (solution A1), 359.7 mg LiNO3, 1517 mg [Ni(OH2)6](NO3)2, and 500 mg P123 were dissolved in 5 ml deionized water. The solution was stirred until all ingredients become completely dissolved (typically 6–8 hrs). The same procedure was used for the other conditions using the amounts of ingredients described in Table S1.
Preparation of Acid-Surfactant Solutions (Solution B)
Solution B contains PA, the other half of P123, and deionized water. For 30PA-P123 solution (B1), 600 mg of 85 % PA and 500 mg of P123 were dissolved in 5 ml deionized water. The solution was stirred until it becomes a clear solution (typically 3–4 hrs). For the other conditions, the PA amount was doubled (B2: 1200 mg PA) and tripled (B3: 1800 mg PA), respectively, while keeping the P123 and water amount the same as B1.
Preparation of the Mixtures and Coating
Corresponding solutions A# and B# were mixed and stirred for 1 day to obtain clear homogeneous solutions, see Figure S9. Then, each homogeneous solution was coated by either spin coating (typically at 1500 rpm for 10 sec) or drop-cast coating over glass substrates or petri dishes, respectively, for further heat treatments. The films were labelled as FM30, FM60, FM90 (F stands for film, M is Mn, Fe, Co, or Ni, and # is PA/P123 mole ratio (or Li(I)/P123 or M(II)/ P123 mole ratios that are the same as PA/P123). Drop cast-coated samples are labelled as DM#, D is used in place of F for drop-cast coated samples, see Figure S9.
Calcination and Annealing
Above films (gel like) were calcined at different temperatures (300°C or 500°C) by putting into preheated furnace for 1 hr. The further annealing was carried out at 500°C for 1 hr. All heat treatments were carried air condition. The duration of calcination and annealing was also 1 hr in the samples prepared by drop-cast coating method.
1 2 3 4 5 6 7 8 9 10 11 12 13 14 15 16 17 18 19 20 21 22 23 24 25 26 27 28 29 30 31 32 33 34 35 36 37 38 39 40 41 42 43 44 45 46 47 48 49 50 51 52 53 54 55 56 57 Characterization
A Rigaku Miniflex diffractometer equipped with a CuKα (λ = 1.5405 Å) X-rays source, operating at 30 kV/15 mA and a Scintillator NaI (T1) detector with a Be window was used for the small angle (1–5°) measurements of the gels on the glass microscope slides. For the powder samples, Pananalytical Multipurpose X-ray diffractom-eter equipped with a CuKα(λ = 1.5405 Å) X-rays source, operating at 45 kV/40 mA was used for the wide angle (10–80°) measure-ments. A Bruker Alpha Platinum ATR-IR spectrometer with a Digi Tect TM DLATGS detector was used for the ATR-IR spectra with a resolution of 4 cm 1 and 64 scans in 400–4000 cm 1 range. The spectra were measured by putting a few drops of the solution for the gel phase or a powder sample on the diamond ATR crystal. The transmittance electron microscope (TEM) images were recorded on a FEI Technai G2 F30 at an operating voltage of 200 kV. The samples were scraped and grinded well in a mortar using 5 ml of absolute ethanol and dispersed using a sonicator for 30 min. A few drops of dispersed solution were put on a TEM grid and heated under powerful light for drying. The N2sorption (77.4 K) measure-ments were carried using a Micromeritics Tristar 3000 automated gas adsorption analyser, in a relative pressure range P/P0, from 0.01 to 0.99 over 5 min intervals. The powder samples collected by scraping from the glass slides were dehydrated under vacuum (35– 40 mTorr) for 2 hrs at 200°C before the N2adsorption-desorption measurement. The electrodes were prepared by coating slurries containing the LiMPO4 (80 wt.%), a conducting agent (Super-P, 10 wt.%), and poly(vinylidene fluoride) (PVDF, 10 w%) dissolved in NMP on Al foil with a mass loading of ~ 2.2 mg cm 2. The electrodes were dried at 120°C for 12 h in a vacuum oven. The electrochemical performance was examined by assembling CR2032 coin-type half cells in an Ar-filled glove box with a polyethylene (PE) membrane. Li metal was used for the counter and reference electrodes. The electrolyte was composed of 1 M LiPF6dissolved in a mixed solvent of ethylene carbonate (EC) and ethyl methyl carbonate (EMC) (3 : 7 v/v). The cells were galvanostatically charged (Li+ insertion) and discharged (Li + extraction) at a constant current of 20 mA/g in a voltage window of 2.0–5.4 V vs. Li/Li+
at room temperature.
Acknowledgements
We would like to thank to beam line scientist, Dr. M. Harfouche (from SESAME), Mr. K. E. Ercan and Ms. I. Karakaya for their helps in XANES and Mr. M. Güler for TEM measurements. We also thank to TÜBİTAK (under the project number 215Z193) for the financial support of this work and Turkish Atomic Agency for the travel grant for the XANES measurements. This work was also performed in part at the Queensland node of the Australian National Fabrication Facility, a company established under the National Collaboration Research Infrastructure Strategy to provide nano and microfabrication facilities for Australia’s researchers. Ö.D. is a member of the Science Academy, Istanbul, Turkey.
Conflict of Interest
The authors declare no conflict of interest.
Keywords: electrochemical energy storage · lithium ion
batteries · lithium metal phosphates · lyotropic liquid crystals · mesoporous
[1] C. T. Kresge, M. E. Leonowicz, W. J. Roth, J. C. Vartuli, J. S. Beck, Nature
1992, 359, 710–712.
[2] T. Yanagisawa, T. Shimizu, K. Kuroda, C. Kato, Bull. Chem. Soc. Jpn. 1990, 63, 988–992.
[3] D. Zhao, J. Feng, Q. Huo, N. Melosh, G. H. Fredrickson, B. F. Chmelka, G. D. Stucky, Science 1998, 279, 548–552.
[4] H. P. Lin, C. Y. Mou, Acc. Chem. Res. 2002, 35, 927–935. [5] H. Yang, N. Coombs, G. A. Ozin, Nature 1997, 386, 692–695. [6] A. S. Poyraz, Ö. Dag, J. Phys. Chem. C 2009, 113, 18596–18607.
[7] H. Yang, A. Kuperman, N. Coombs, S. Mamiche-Afara, G. A. Ozin, Nature
1996, 379, 703–705.
[8] G. S. Attard, J. C. Glyde, C. G. Göltner, Nature 1995, 378, 366–368. [9] T. Asefa, M. J. MachLachlan, N. Coombs, G. A. Ozin, Nature 1999, 402,
867–871.
[10] D. M. Antonelli, J. Yang, Angew. Chem. Int. Ed. 1995, 34, 2014–2017. [11] W. C. Li, A. H. Lu, C. Waidenthaler, F. Schüth, Chem. Mater. 2004, 16,
5676–5681.
[12] Y. Wan, D. Zhao, Chem. Rev. 2007, 107, 2821–2860.
[13] I. Vamvasakis, K. S. Subrahmanyam, M. Kanatzidis, G. S. Armatas, ACS Nano 2015, 9, 4419–4426.
[14] B. Tian, X. Liu, B. Tu, C. Yu, J. Fan, L. Wang, S. Xie, G. D. Stucky, D. Zhao, Nat. Mater. 2003, 2, 159–163.
[15] E. Tunkara, Ö. Dag, Eur. J. Inorg. Chem. 2016, 13–14, 2114–2121. [16] P. Mei, Y. V. Kaneti, M. Pramanik, T. Takei, Ö. Dag, Y. Sugahara, Y.
Yamauchi, Nano Energy 2018, 52, 336–344.
[17] X. M. Liu, S. L. Zhang, M. Yang, X. Z. Liao, H. Yang, X. D. Shen, Z. F. Ma, Chem. Commun. 2014, 50, 15247–15250.
[18] M. Paramanik, R. R. Salunkhe, M. Imura, Y. Yamauchi, ACS Appl. Mater. Interfaces 2016, 8, 9790–9797.
[19] C. Liu, F. Li, L. P. Ma, H. M. Chang, Adv. Mater. 2010, 22, E28-E62. [20] X. Y. Yu, L. Yu, X. W. Luo, Adv. Energy Mater. 2015, 6, 1501333(14). [21] H. Liu, R. Zhou, B. Sun, G. Wang, S. Z. Qiao, Adv. Energy Mater. 2012, 2,
970–975.
[22] M. R. Gao, Y. F. Xu, J. Jiang, S. H. Yu, Chem. Soc. Rev. 2013, 42, 2986– 3017.
[23] L. Mercier, T. J. Pinnavaia, Adv. Mater. 1997, 9, 500–503.
[24] T. Wagner, S. Haffer, C. Weinberger, D. Klaus, M. Tiemann, Chem. Soc. Rev. 2013, 42, 4036–4053.
[25] C. Perego, R. Millini, Chem. Soc. Rev. 2013, 42, 3956–3976.
[26] Y. Ren, A. R. Armstrong, F. Jiao, P. G. Bruce, J. Am. Chem. Soc. 2010, 132, 996–1004.
[27] K. Ariga, A. Vinu, Y. Yamauchi, Q. Ji, J. P. Hill, Bull. Chem. Soc. Jpn. 2012, 85, 1–32.
[28] B. Kang, G. Ceder, Nature 2009, 458, 190–193.
[29] B. Scrosati, J. Garche, J. Power Sources 2010, 195, 2419–2430. [30] A. Manthiram, J. Phys. Chem. Lett. 2011, 2, 176–184.
[31] D. Yang, Z. Lu, X. Rui, X. Huang, H. Li, J. Zhu, W. Zheng, Y. M. Lam, H. H. Hng, H. Zhang, Q. Yan, Angew. Chem. Int. Ed. 2014, 53, 9352–9355. [32] G. Wang, H. Liu, J. Liu, S. Qiao, G. M. Lu, P. Munroe, H. Ahn, Adv. Mater.
2010, 22, 4944–4948.
[33] S. Y. Chung, J. T. Bloking, Y. M. Chiang, Nat. Mater. 2002, 1, 123–128. [34] C. Masquelier, L. Croguennec, Chem. Rev. 2013, 113, 6552–6591. [35] S. Zhu, H. Zhou, T. Miyoshi, M. Hibino, I. Honma, M. Ichihara, Adv. Mater.
2004, 16, 2012–2017.
[36] Y. Fang, L. Xiao, J. Qian, X. Ai, H. Yang, Y. Cao, Nano Lett. 2014, 14, 3539–3543.
[37] M. Pramanik, Y. Tsujimoto, V. Malgras, S. X. Dou, J. H. Kim, Y. Yamauchi, Chem. Mater. 2015, 27, 1082–1089.
[38] B. P. Bastakoti, Y. Li, S. Guragain, M. Pramanik, S. A. Alshehri, T. Ahamad, Z. Liu, Y. Yamauchi, Chem. Eur. J. 2016, 23, 7463–7467.
[39] E. Tunkara, C. Albayrak, E. O. Polat, C. Kocabas, Ö. Dag, ACS Nano 2014, 8, 11007–11012.
[40] Ö. Çelik, Ö. Dag, Angew. Chem. Int. Ed. 2001, 40, 3800–3803. [41] A. F. Demirörs, B. E. Eser, Ö. Dag, Langmuir 2005, 21, 4156–4162. [42] G. Barım, C. Albayrak, E. Yılmaz, Ö. Dag, Langmuir 2014, 30, 6938–6945. [43] F. Sanz, C. Parada, J. M. Rojo, C. Ruiz-Valero, Chem. Mater. 2001, 13,
1334–1340.
[44] H. Kim, I. Park, D. H. Seo, S. Lee, S. W. Kim, W. J. Kwon, Y. U. Park, C. S. Kim, S. Jeon, K. Kang, J. Am. Chem. Soc. 2012, 134, 10369–10372.
1 2 3 4 5 6 7 8 9 10 11 12 13 14 15 16 17 18 19 20 21 22 23 24 25 26 27 28 29 30 31 32 33 34 35 36 37 38 39 40 41 42 43 44 45 46 47 48 49 50 51 52 53 54 55 56 57
[45] S. M. Wood, C. Eames, E. Kendrick, M. S. Islam, J. Phys. Chem. C 2015, 119, 15935–15941.
[46] M. Avdeev, Z. Mohamed, C. D. Ling, J. Lu, M. Tamaru, A. Yamada, P. Barpanda, Inorg. Chem. 2013, 52, 8685–8693.
[47] B. Senthilkumar, K. V. Sankar, L. Vasylechko, Y. S. Lee, R. K. Selvan, RSC Adv. 2014, 4, 53192–53200.
[48] A. A. Salah, P. Jozwiak, K. Zaghib, J. Garbarczyk, F. Gendron, A. Mauger, C. M. Julien, Spectrochim. Acta Part A 2006, 65, 1007–1013.
[49] O. Haas, A. Deb, E. J. Cairns, A. Wokaun, J. Electrochem. Soc. 2005, 152, A191-A196.
Manuscript received: July 11, 2019
Revised manuscript received: August 26, 2019 Accepted manuscript online: August 28, 2019