RESPONSE OF SURFACE ACOUSTIC WAVE IMAGING
SYSTEMS T O CYLINDRICAL INHOMOGENEITIES
Nilgiin Gunalp, Biilent Baygun, Fahri Siiriicii
t
and Abdullah Atalar
1
Middle East Technical University, Ankara, TURKEY
t
University
of
Illinois at Urbana-Champaign, Il., U.S.A.
3
Bilkent University, Ankara TURKEY
Abstract
Characterization of near-surface properties of materials by acoustic means is most conveniently done by surface acoustic waves (SAW). A conventional acoustic microscope lens excites focused SAW on the object surface, but with a low efficiency. SAW can be excited with a high efficiency and be focused to a diffraction limited spot using conical wavefronts as obtained from a conical axicon. The purpose of this paper is to present the response of the imaging systems utilizing convergent SAW to certain kind of defects. In particular, circular cylin- drical cavities, whose axes are perpendicular to surface, are considered. The scattering of the SAW is formulated with some approximations. SAbW incident upon the cavity is initially found as an angular spectrum of plane waves. To apply the boundary conditions, the incident field has to be transformed in a form of superposition of cylindrical waves. Similarly, the scattered field, which is found in the form of outgoing cylindrical SAW’S, is converted back to a plane wave spectrum to com- plete the formulation. At the end, a formula is obtained for the output voltage in terms of the position and the radius of the cylinder. By con- sidering various locations for the cylinder, the sensitivity of the system around the focal point is studied. Also, by comparing the output volt- ages for cylinders of different radii, sensitivity of the system to the size of the inhomogeneity is examined. The numerical results are found to be in agreement with the experimental observations.
I. INTRODUCTION
Surface acoustic waves (SAL’) are frequently used for near surface eval- uation of materials, because they are very sensitive to surface inhomm geneities like surface breaking cracks [l]. If the characterization is of primary concern rather than j u s t detection of faults, an imaging s y s tem may be utilized. The scanning acoustic microscope has been used successfully, because of its ability to excite surface waves [2,3]. The dis- advantage of scanning acoustic microscope is that all such modes are excited simultaneously and each with a low efficiency. The efficiency can be increased by use of other configurations. Recently, Koymen and Atalar introduced a method of focusing SAW’s on the surface of non- piezoelectric materials by using a new type of conical axicon [4]. Ayter [5] achieved the same, using a conical transducer.
The purpose of this paper is to present a theoretical study of the imag- ing systems utilizing focused leaky SAW, and their response to cer- tain kind of defects. In particular, circular cylindrical inhomogeneities with perpendicular axes to surface are considered. The surface wave incident upon the inhomogeneity is initially found as an angular spec- trum of plane waves. Then, the angular spectrum is converted into a cylindrical wave expansion. At the end, a formula is obtained for the transducer output voltage in terms of the position and the radius of the cylinder, and it is suitable for computer evaluation. By considering various locations for the cylinder, the sensitivity of the system around the focal point is studied. Also, by comparing the output voltages for
0090-5607/88/0000-0591
$1
.OO
0
1988 IEEE
cylinders of different radii, sensitivity of the system to the size of the inhomogeneity is examined.
11. FORMULATION
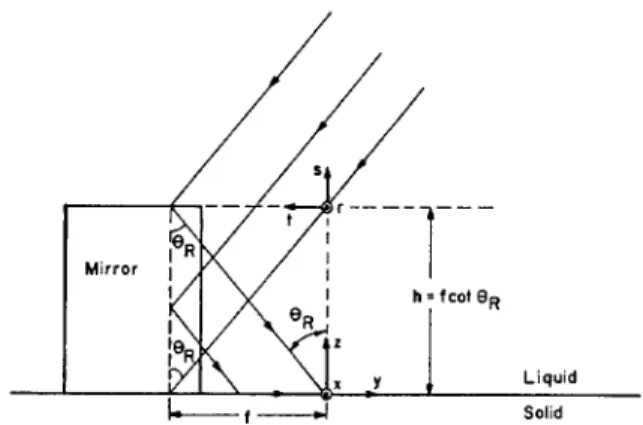
As a representative of SAW imaging systems, we consider the conical axicon focusing system. The operation principle of this system can be found elsewhere [4]. Consider the geometry shown in Fig. 1. The ( r , s, 1 ) coordinate system will be used to represent the bulk waves transmitted and received by the transducer, and ( z , y , r ) coordinates will be used for the surface waves in the solid. The origin of the ( 2 , y , z ) coordinate system is chosen a t the focal point. Inside the solid a circular cylindrical inhomogeneity is considered. This cylinder extends up to the interface and it is centered a t ( x o , y o ) with yo
> 0.
The formulation presented below employs two dimensional potentials
U+(., y) and U-(., y) to represent the incident and scattered surface waves. A time dependence of exp(-jut) is assumed in the formulation.
Surface Wave Field at the Focus
Let the velocity potential associated with the incident bulk wave be represented by u t ( . , s) a t the T - s plane. The surface wave field along z-axis and propagating in +y direction, u f ( x ) , can be written as (61
u F ( z ) =
7
{
T u : ( T , s)P(r,s)ds exp[-j(kR/f)rz] dr (1)where k R = 2 ? r / x R is the real part of the leaky Rayleigh wave number,
f
is the focal length, and P(r, s) is the pupil function due to finite size of the parabolic mirror. P(r,s) is obtained from a projection of the mirror surface onto r-
s plane: a rectangle of width 2xm and heightf
cot 8 ~ , where 8~ is the Rayleigh angle. We have-cc - m
1
e - a ~ ( f - t t a n 8 ~ ) e J k ~ a c o t 8 ~ for -
.,.,
<
,.
<
.,.,
a n d O < s < f c o t 8 ~ (2)
( 0 otherwise
P ( r , s) =
where ( I T
=
a~+
W L ; a~ and ( Y L are the dissipation and leak rates, respectively, of the surface wave.As the incident wave, we assume a unity amplitude uniform plane wave with n o r-dependence. The field distribution at r - s plane can be ex- pressed as ut(.,.)
= exp[-jkRscot
OR]. Using this distribution along with Eq. 2 in Eq. 1 results in the following focal field distribution:Field Incident Upon the Cylinder:
By using the angular spectum approach, the field in the region y
>
0 can be completely determined by the field distribution a t y=
0. We/
///
/
/ I t /x , i
h = f cat ORFigure 2: Top view depicting the primed coordinate system.
I d l \
\ I .
U” -, Y1
Liquidce---f---rl
SolidFigure 1: Description of the coordinates used in the formulation.
first define the angular spectrum, Uf+(k,), of U:(.) by
U/(k,)
=
3 { u T ( r ) } =im
uf(z)exp(-jk,z)dz (4)-m
where 3 is the Fourier Transform operator. Then, the angular spec- t r u m a t apositiony
>
Ocan bewrittenasU+(k,,y)= UT(k,) exp(jk,y)
The field u + ( z , y ) for y>
0 can then be written as+m
u+(z,Y) = 1/(24
J
U+(k,,y)exp(jk,z)dk,, Y2
o
(5)- m
k, and k, are related by
kz
+
ki
= k’, where
k is the complex wave numberk
= kR + j a ~ . We can express k, ask,
= (k’ - kz)’/’ with Zm{ky}>
0. For the assumed plane wave incidence and the pupil function of Eq. 2 we find the angular spectrum of surface waves a ty = o a s
Field Scattered by the Cylinder
To formulate the scattering, we first introduce a primed coordinate system (z’,y‘) with the origin a t the center of the cylinder, i.e. t’ =
I - z o , y’
=
y - yo as shown in Fig. 2 . To simplify the notation, wealso introduce the vectors r = (z, y), r’ = (d, y‘), ro = ( 1 0 , yo), k
=
(k,, ky). Then, the field incident upon the cylinder can be written as
ti+(’‘)
= 1/(2r)
A(k,)exp(jk*r’)dk,, y’2
-yo (7)- m
im
where
A(k,)
=
UT(k,)exp(jk*ro) (8)Let ’)i-(.t denote the field scattered by the cylinder. Then, the total
field outside the cylinder can be written as U(.‘)
=
u+(r‘)+
u-(r’).In order to relate the incident and the reflected fields by the boundary conditions on a cylindrical surface p’ = a , it is necessary to express these fields in terms of cylindrical wave functions. The incident field which will be evaluated a t p’
=
a can be expressed in terms of regular cylindrical wave functions as+m
u+(r‘)
=
I<, exp(jn#)J,(kp’) (9)n=--03
and the scattered field can be expanded in terms of outgoing cylindrical wave functions as
+W
U-(.’) = B, exp(jnqY)Hi’)(kp’), p’ 2 a (10)
n = - m
The relationship between {K,} of Eq. 9 and A(k,) of Eq. 7 can be established by substituting the following transformation formula [7] into Eq. 7 +m exp(jk*r’) = exp(jn./2)exp(jn4’)Jn(kp‘)(--_) kz - j k y 0, n=-m This yields
The next step in the formulation is to express {Bn}, the expansion coefficients of the scattered wave, in terms of { K , } . Although only the scattered surface wave, will induce an output voltage at the transducer, for an exact solution of the problem all possible field components should be taken into account. Such an exact formulation is quite complicated
[a],
therefore a simple approximate method will be applied: Since the finite value of c44 makes the surface of the cylinder a relatively hardboundary in the radial direction, the total surface wave along the in- terface will be forced to satisfy the rigid-boundary condition ( v p , = 0 a t p’ = a ) . Use of the free-boundary condition is not appropriate here, it approximates a cavity in a liquid medium where c44 is zero. Even though the inhomogeneity is a cavity, it is better approximated in the scalar approximation by a rigid cylinder. This approximate formula- tion does not give the actual “ratio” of the scattered surface wave to the incident. However, it can quite satisfactorily be used to compare the scattered fields due to various cylinders of different locations and sizes. When the boundary condition a / a p ’ { u + ( r ’ )
+
u-(r’)}lpj=a= 0
is applied with U+(’’) and U-(.’) as given by Eqns. 9 and 10, one obtains8,
=
T, IC, (12) whereThe scattered surface wave, which was expressed in cylindrical form in Eq. 10, must now be written as
+m
.-(.7Y)
=
1/(2%)J
U - f ( k,1
explj(k,z - jk,y)] dkz (14)- W
for points y
5
yo. Note that U;(kz) corresponds to the returning angular spectrum a t y = 0. Using the transformation formula [7]- m
0 2 4 6 8 IO I2 14 16 I8 2 0 -20- -24 - -28- -32-
-441
- 4 s\i
-52l " " " " ' IFigure 3: Normalized transducer output voltage as a function of the axial position of the cylinder for several a T / k R values. (zm/f
= 0.74,
kRa=
0.5, 20=
0.0, V,= output voltage when the cylinder is centered a t the focus. V, is 12.73 dB below K d g e )for y'
5
0 in Eq. 10, one can recognize Uy(kr) of Eq. 14 to beTransducer Output Voltage:
The scattered surface wave U-(., y) travels in backward direction and leaks into the liquid. This leak field gets collimated in the transducer direction after being reflected from the mirror. The field incident upon the tranducer, U;(.,.), can be obtained by [6]
kR
U;(., s)
=
a ~ .P(r,
s) U;(.) exp(-j-rz) dx (17)-m
7-
f
where U;(")
=
u - ( z , O ) is the scattered surface wave field along the x-axis. Eq. 17, when combined with the fact thatU;(k,)
= F { u ; ( z ) }as in Eq. 4, yields
Finally, since u ; ( r , s ) is to be received by the same transducer gener- ating the incident field, u t ( . , . ) , the output voltage of the transducer can be expressed as
-m - m
By the substituition of Eqs. 2 and 18, this expression simplifies to
- r m
Then, U;[(k~/f)r] is evaluated by combining Eqs. 16, 12, 11, 8 and 6, and the final form of Eq. 19 is obtained as
- 2 0 -
-24 -
-28- -32 -
- 60
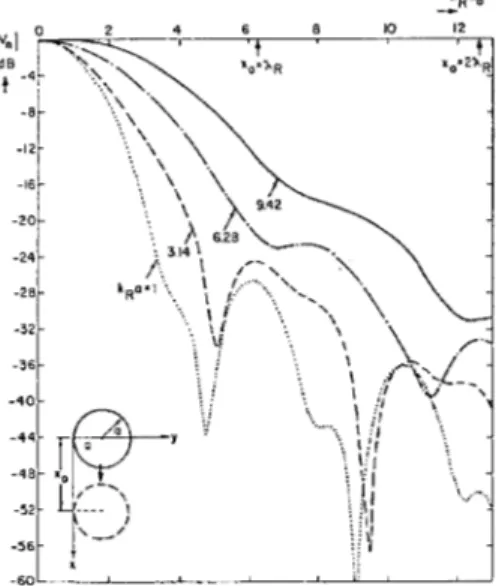
Figure 4: Normalized transducer output voltage as a function of the lateral position of the cylinder with the cylinder radius as the parame- ter.
where
( ~ - / J P R
k r - j k ,
P,(ro)
=
/
expb(krto+
YO)](-
k
1
dk= (21)-(*m/f ) k R
(rm/f )kR
k - j k ,
,,
Qn(ro) =
/
exp[-j(krzo - ky~o)l(-) dkr/ky (22)k,
= (kz
- .E:)'/', k= k~
+ j a ~ , andT,
is as given by Eq. 13. K d g .corresponds to the transducer output voltage when there is an infinitely long edge (plane reflector) along the x-axis. To find it we assume that U;(k,) = U T ( & ) which means a total reflection. In this case Eq. 19 yields
- ( Z = / J P R
This expression shows the factors effecting the output voltage with a perfect SAW reflector a t the focal line.
111. NUMERICAL RESULTS
Eq. 20 gives the transducer output voltage in terms of the center, ro = (xo,yo), and the radius, (I, of the scattering cylinder. The integrals
P, and
Q n
given by Eqs. 21 and 22 depend only on the position of the cylinder, whereas the coefficient T, depends only on the radius. Hence, these integrals, once evaluated a t a certain (20, yo) position, can be stored and be used subsequently for cylinders of different radii centered a t the same point. We put the integrals P, andQ n
into a form more suitable for numerical integration by using a simple change of variables: p= kr/[(Zm/f)kR]. For the calculation of
v / v e d g e r theonly parameters that must be specified are z m / f , a T / k R , kRzo, ~ R Y O
and kRa. T h e necessary number of integration points increases as R
and/or the distance of the center from focal point increases. For the calculation of
Tn,
the derivatives of the Bessel and Hankel functions of the complex argument ka = kRa( 1 + j a ~ / E ~ t ) are generated. For small cylinders with kRa<
1 only the terms with In/5
3 in the summation of Eq. 20 are sufficient. As the radius increases, more and more termsshould be included.
In order to compare our results with the previously published experi- mental results [9], we chose xm/f
=
0.74 in all of the calculations given below. The ratio aT/kR is equal to 0.03 for aluminum, and this value:::I
/
, ,-36
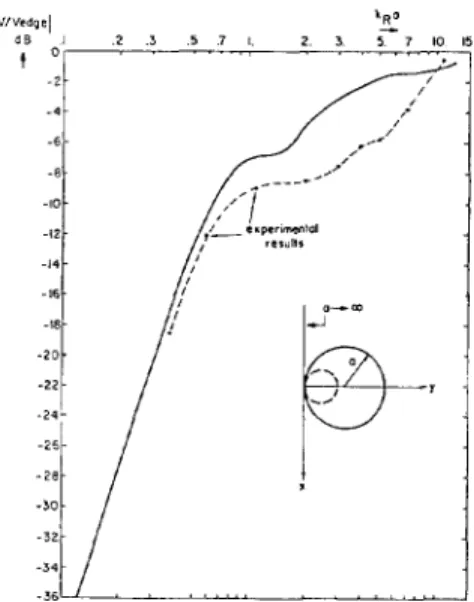
Figure 5: Variation of the output voltage with the cylinder radius. corresponding to the case a -+ CO).
( I m / f = 0.74, f f T / k R
= 0.03,
I o = 0.0, yo=
a , I/cdge: Output Voltage is used in all of the presented results, except in Fig. 3 , where severalLuT/kR ratios are considered.
The first set of results given in Fig. 3 corresponds to a small cylinder
( k ~ a
=
0.5, diameter N 0 . 1 6 X ~ ) moved along the y-axis to see the axial sensitivity of the imaging system. Here the results are normalized by the transducer output voltage, V I , obtained when the cylinder is centered a t the focus. Curves corresponding to different f f T / k R ratiosare presented. In each case it is seen that as the scatterer moves away from the focal point, the output voltage decreases monotonically. For the case of ( Y T / k R = 0.03 (Al), 2 0 dB drop at the output voltage
occurs at kRyo
=
13 which corresponds to a distance yo N 2 x R fromthe focal point. This result is in close agreement with o u r experimental observations. It is interesting to note that as the leak rate is increased the response of the system in y direction gets sharper, i.e. the resolution in y direction increases.
To examine the sensitivity of the system along x-direction (lateral di- rection), several calculations are carried out. Fig. 4 shows how the output voltage varies in the lateral direction. Here, the cylinders of dif- ferent radii are moved parallel to the x-axis (with their edges touching the x-axis), and the corresponding output voltages are plotted after be- ing normalized by their maximum values. It is seen that for cylinders whose diameters are larger than the width of the main beam of the incident sinc function, the transducer output voltage is related rather closely to the size of the cylinder. For k R a = 2 7 and k R a = 3?r, ap- proximately 20 dB drop in the output voltage is obtained when the cylinder is centered a t the position to = a . Hence images obtained in
such a system will correctly depict the size of the cylinders. But, for small cylinders, the response of the system is determined by the inci- dent sinc function. It is also observed that the resolution of the system in z direction is about 4 times better that in y direction for the case of aluminum sample, and this is consistent with experimental results. Finally, to investigate the sensitivity of the imaging system to the radius of the cylinder, the output voltages for different radii are calculated. Each cylinder is centered a t the point zo
=
0, yo= a , where a is its
radius, so that the edge of each cylinder is at the focus as demonstrated in Fig. 5. The case a-
00 corresponds to an infinite straight edge reflector along z-axis for which the transducer output voltage is & g e .All voltages are normalized by V e d g e and plotted vs k R a . It is observed
that the output voltage increases as the cylinder becomes larger, and for k R a = 3.1 (a rr X R / 2 ) , the output voltage is only 3 dB below L ’ d g e .
This is because the incident field uT(z) illuminates only a finite portion
along z-axis. Thus, increasing the radius further will not change the output voltage considerably. On the other hand, for small radii the signal drops about 10 dB for halving the the cylinder radius. The asymptotic line crosses the 0 dB axis a t around k R a = 1.
The curve in Fig. 5 exhibits another interesting feature. As k R a ap-
proaches 1 from smaller values, the output voltage tends to increase faster, thus forming a local maximum at k ~ a = 1. This corresponds
to a cylinder whose circumference is X R , i.e. the phase change around the cylinder is 2n
.
Such behaviour can be explained by the in-phase superposition of the creeping surface waves around the cylinder. The dots in the figure represent the experimental results obtained earlier [9]. Although in the experimental setup, the focal field had a wider beamwidth, the experimental curve possesses the same kind of signal enhancement around k R a= 1.
IV.
CONCLUSIONS
We have presented a theory to predict the response of a SAW imaging system. In particular, we calculated the response to cylindrical cavities as a function of position of cavity with respect to focus point. The calculations indicated that the leak rate affects the resolution of the system in the y-direction. A high leak rate material will result in a better resolution in y-direction. The theory also predicts an enhance- ment in the received signal level when the cylinder circumference equals a SAW wavelength. The images of cylinders obtained with such sys- tems will indicate the size of the cylinders correctly a t 20 dB below
its peak value as long as the cylinder diameter is larger than about a Rayleigh wavelength. For small cylinders the received peak amplitude can be used to determine the size of the cylinder.
References
[I] R.J. Dewhurst, A.D.W. McKie, and S.B. Palmer, “Further evi- dence for two-component surface acoustic wave reflections from surface breaking cracks,” A p p l . Phys. Lett., vol. 49, pp. 1694-1695, 1986.
[2] K. Yamanaka, Y. Enomoto and Y. Tsuya, “Acoustic microscopy of ceramic surfaces,’’ IEEE D a n s . Son. Ultroson., vol. 3 2 , pp. 313-
319, 1985.
[3] G.C. Smith, M.G. Gee, “Observation of a sub-surface defect in sapphire by Rayleigh wave reflection in the scanning acoustic mi- croscope,” J. M a t e r .
Sa.
Lett., vol. 5, pp. 1133-1134, 1986. [4] H.Koymen, and A.Atalar, “Focusing surface waves using an axi-con,” A p p l . Phys. Lett., vol. 47, pp. 1266-1268, 1985.
[5] S. Ayter, “Focusing surface waves using conical transducers,” in
Proc. of 1987 IEEE Ulirnson. Symp., pp. 301-304, 1987.
[6] A. Atalar, and H . Koymen, “V(Z) of the surface acoustic wave fo- cusing system,” in IEEE 1986 Ultrasonics Symposium Proceedings,
pp. 727-730, 1986.
[7] N . Giinalp, “Acoustic and electromagnetic scattering from cylin- ders burried in a half space,“ P h . D . Thesis, Middle East Tech. Univ.. 1981.
[8] A.Gautesen, “Scattering of an obliquely incident Rayleigh wave in an elastic quarterspace,” W a v e Motion, vol. 8 , pp. 27-41, 1986. [9] A.Atalar, and H.Koymen, “Use of a conical axicon as a surface
acoustic wave focusing device,” IEEE Trans. Ultrason. Perroelect.
Frep. Contr., vol. 34, pp. 53-63, 1987.