Pathways of bond topology transitions at the interface of silicon nanocrystals
and amorphous silica matrix
D. E. Yılmaz*and C. Bulutay†
Department of Physics, Bilkent University, Ankara 06800, Turkey T. Çağın‡
Artie McFerrin Department of Chemical Engineering, Texas A&M University, Jack E. Brown Engineering Building, 3122 TAMU, College Station, Texas 77843-3122, USA
共Received 7 January 2008; revised manuscript received 29 February 2008; published 4 April 2008兲 The interface chemistry of silicon nanocrystals共NCs兲 embedded in an amorphous oxide matrix is studied through molecular dynamics simulations with the chemical environment described by the reactive force field model. Our results indicate that the Si NC–oxide interface is more involved than the previously proposed schemes, which were based on solely simple bridge or double bonds. We identify different types of three-coordinated oxygen complexes that are previously not noted. The abundance and the charge distribution of each oxygen complex is determined as a function of the NC size as well as the transitions among them. The oxidation at the surface of NC induces tensile strain to SiuSi bonds, which become significant only around the interface, while the inner core remains unstrained. Unlike many earlier reports on the interface structure, we do not observe any double bonds. Furthermore, our simulations and analysis reveal that the interface bond topology evolves among different oxygen bridges through these three-coordinated oxygen complexes.
DOI:10.1103/PhysRevB.77.155306 PACS number共s兲: 61.46.Hk, 68.35.Ct
I. INTRODUCTION
After a long arduous effort, photoluminescence from sili-con has been achieved from its nanocrystalline form.1A
criti-cal debate, however, continues over the nature of the inter-face chemistry of silicon nanocrystals共Si NCs兲 embedded in amorphous silica, which has direct implications on the opti-cal activity of the interface.2–6Wolkin et al. reported that the
oxidation of porous silicon quantum dots results in a redshift in the photoluminescence 共PL兲 spectra, which indicates the importance of oxygen-related interface bond toplogy.2Along
this line, Puzder et al. compared PL calculations of nanoclus-ters with different passivants and surface configurations and proposed the main reason for the redshift to be double SivO bonds.3 Countering this, Luppi et al. reported
exci-tonic luminescence features caused by SiuOuSi bridge bonds at the surface of silicon nanoclusters.4As a supporting
evidence for the latter, Gatti and Onida recently demon-strated that the SiuOuSi bond is the most stable isomer configuration.5 To reconcile, Vasiliev et al. claimed that the
bridge bonds and double bonds have similar effects on PL.6
All of the work cited above represent density functional theory 共DFT兲–based calculations with small Si clusters of less than 100 atoms surrounded by either passivants such as hydrogen3–5or oxygen.2,3However, actual samples are
pro-foundly different: the fabricated systems consist of Si NC with a diameter larger than 1 nm, embedded in an
amor-phous silica 共a-SiO2兲 matrix. Identifying this fact, Tu and
Tersoff studied the Si/a-SiO2 interface using a bond order dependent empirical potential and proposed that SiuOuSi bridge bonds are the main blocks at the interface lowering the surface energy.7By using the same model potential,
Had-jisavvas and Kelires studied Si NCs embedded in a-SiO2and also reported bridge bonds as the mechanism for lowering surface strain energy.8In our previous work on the formation
and structure of Si NCs, we also observed that this model potential falls short in characterizing the system accurately, especially the structure and chemistry at the interface.9As a
rigorous approach to interface structure and dynamics, Pas-quarello et al. used first-principles molecular dynamics共MD兲 technique to investigate the planar Si/SiO2interface.10They
observed that the oxygen atoms are momentarily bonded to three silicon atoms during the oxidation process. The net effect of these threefold-coordinated oxygen atoms during the oxidation process was to expel silicon atoms out of the interface. This is interpreted as a balancing process to de-crease the inde-creased density of the Si/SiO2 interface due to oxidation.10However, no substantial breakthrough was made
over the past decade on this issue.
II. METHOD
In this work, we employ the reactive force field共ReaxFF兲 model developed by van Duin et al.,12which improves Bren-ner’s reactive bond order model11to a level of accuracy and
validity, allowing molecular dynamics simulations of the full reaction pathways in bulk. The parameters for this force field were obtained from fitting to the results of ab initio calcula-tions on relevant species as well as periodic boundary con-dition DFT-based calculations of various crystalline poly-morphs of relevant materials. The ReaxFF calculates bond orders, which are the measure of bond strength from local geometry. This allows realistic chemical environment such as over- or undercoordination and bond breaking or formation for large-scale共about 5000 atoms兲 MD simulations.
To facilitate our discussion regarding the surface-bonded oxygen complexes, we distinguish among three different types of silicon atoms. We label those silicon atoms with all silicon neighbors each with zero oxidation state as c to de-note core silicon atoms. Among the remaining 共non-c兲
sili-con atoms, those with at least one bond to c are labeled as s, denoting surface silicon atoms. For further investigation of NC, we seperate core Si atoms into two subcategories as inner-core and outer-core atoms: Among core Si atoms which have at least one surface Si neighbor categorized as outer-core Si atoms and rest of core Si atoms categorized as inner-core Si atoms. Finally, any other silicon atom is labeled as m, denoting a matrix silicon atom. Hence, a complex con-sisting of an oxygen atom bonded with two surface silicon atoms is labeled as ss. The other oxygen complexes are sm,
ssm, sss, and mms, as sketched in Fig.1, where the last three correspond to three-coordinated oxygen共3cO兲 atoms.
We use ReaxFF to represent the interactions in the model system. We start with a large simulation cell共box length of 43 Å兲 of silica glass formed through a melting and quench-ing process used by one of us13,14 earlier to study silica
glasses. Next, similar to Hadjisavvas and Kelires,8we delete
all atoms within a predetermined radius to insert crystalline silicon to form NC. In this way, we create NCs with radii ranging from 5.5 to 16.7 Å. For the largest NC, we insert 967 Si atoms into a spherical hole with a radius of 16.7 Å created in an amorphous matrix. Even for this case, the mini-mum distance between the NC surface to the simulation box face is about 5 Å, which can still accommodate the interface layer. We also pay special attention in the removal of spheri-cal region so that the correct stoichiometry for the amor-phous matrix is met. Thus, our amoramor-phous matrix has two O atoms for every Si atom with a density of 2.17 g/cm3, which
is the density of glass at room temperature and atmospheric pressure.
We set periodic boundary conditions in all directions, and while keeping NC at 100 K, we employ a simulated anneal-ing process to the SiO2region to end up with an amorphous
matrix free of artificial strain around the NC. Then, we set
the whole systems’ temperature to room temperature共300 K兲 and continue performing MD simulation for 75 ps to have a thermal equilibrium between the two regions. We set the MD simulation time step to 0.25 fs for all simulations. For every 6.25 fs time interval, we have recorded the configurations to analyze the transitions taking place between different bond topologies. The numbers attached to each arrow in Fig. 1 indicate the total number of registered transitions during the simulation in that direction between the complexes for a rep-resentative NC with a radius of 13.4 Å. The fact that there are almost balanced rates in opposite directions is an assur-ance of the attainment of the steady state in our simulation. Note that we do not observe any direct transition other than the paths indicated in Fig.1. For instance, a direct transition of the complex ss to sm does not take place, but it is possible through an intermediate transition over the ssm, which is a 3cO. We should also remark that the balanced transitions continue to take place after the steady state is attained, which indicates that the interface bond topology is dynamic, i.e., not frozen.
To analyze the Si NC/a-SiO2 interface, we construct a
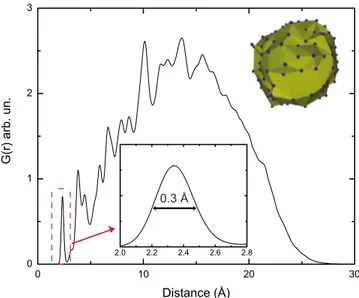
NC surface using the Delaunay triangulation scheme共Fig.2 inset兲.15In two dimensions, a Delaunay triangulation of a set
of points corresponds to defining triangles such that no point in the set is inside the circumcircle of any triangle. In three dimensions, triangles extend to tetrahedra and circumcircles become circumspheres. Since our NCs are nearly spherical in shape, we triangulate projection points of surface Si atoms onto the unit sphere. Hence, we apply Delaunay triangulation over the two dimensional - plane. We can then create surfaces using this triangulation. This surface enables us to calculate every atoms’ distance to the NC surface. By this means, we plot various data such as charge, bond order, etc., with respect to distance to the surface to extract information
s s s s s s m m s m s m s m s s s s s s m m s m s s m m s s s 271 179 267 175 46 50 19 17 48 47 1 0
FIG. 1.共Color online兲 The transitions between different oxygen complexes bonded to the interface. The dark green共dark gray兲 large spheres represent matrix silicon atoms, the light green共light gray兲 large spheres represent surface silicon atoms of the NC, and the small red共dark gray兲 spheres represent oxygen atoms. The numbers indicate the number of transitions recorded in the simulation in each direction among the complexes for the NC with a radius of 13.4 Å.
0.3 Å
FIG. 2. 共Color online兲 Radial distribution function of Si atoms in NC. Inset: The first peak resembles SiuSi bond length distribu-tion centered at around 2.34 Å with a 0.3 Å FWHM value. The second peak’s width resembles bond angle deviation. Inset: Repre-sentation of NC surface created with Delaunay triangulation. Blue 共dark gray兲 dots represents surface silicon atoms.
about the surface chemistry of Si NC embedded in amor-phous matrix.
III. RESULTS AND DISCUSSIONS
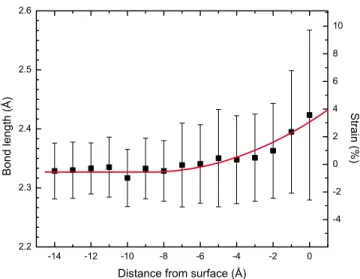
For different NC radii, we observe similar trends in bond order distribution, average charges, etc.; therefore, we present only the figures of the system for a typical NC of radius 13.4 Å. Useful data to elucidate the structure of these systems are the radial distribution function共RDF兲. In Fig.2, we present the RDF of NC atoms only, where the first broad peak centered at around 2.34 Å with a 0.3 Å full width at half maximum value 共FWHM兲 represents the SiuSi bond length distribution in NC共Fig.2inset兲. The maximum extent of the NC can also be read from same plot at about 27 Å, where the RDF goes to zero. Observation of a broad first peak in Fig.2demands further investigation of SiuSi RDF of NC atoms. For this purpose, in Fig. 3 we present bond length probability distributions共akin to RDF兲 for three cat-egories of Si atoms: inner-core 共with no bonds to surface atoms兲, outer-core 共bonded to the surface兲, and surface NC atoms. We observe from Fig.3 that SiuSi bond lengths in the inner core are centered around the equilibrium value and have a narrow width due mainly to thermal vibrations, whereas the bond length distributions of outer-core and sur-face atoms have increasing shifts for the most probable bond length values and broader widths. These shifts, and particu-larly, the increase in distribution widths cannot be attributed to thermal broadening. Taken together, these two observa-tions is a clear indication of increasing strain as a function of distance from the center of the NC. To further investigate this deviation of SiuSi bonds from crystalline Si, in Fig. 4we present bond length distribution with respect to the distance to the NC surface averaged over 2 ps of simulation time after the steady state is reached. This figure illustrates the gradual development of radial strain from the center to the NC sur-face. These observations show clearly that oxidation at the
surface of NC results in a tensile strain at SiuSi bonds, which becomes significant only around the interface, while keeping the inner core almost unstrained. This tensile strain in the NC agrees with previous measurements of Hofmeister
et al.16
Another consequence of this tensile strain is that the total bond orders of core-NC atoms are somewhat smaller than those of oxide Si, as seen in Fig. 5. In the same figure, we also show the calculated net charges using the electron equilibration method.17 Nearly zero net charges of the
core-Si atoms reflect the covalent type of bonding well within the NC. The bonding becomes increasingly ionic away from the NC core, as observed by the charges of Si Inner-core
Outer-core Surface
FIG. 3. 共Color online兲 Bond distance probability distribution of Si atoms in NC. The solid line represents inner-core SiuSi bonds, the dashed line outer-core SiuSi bonds, and the dotted line surface SiuSi bonds.
FIG. 4.共Color online兲 Variation of SiuSi bond length averages 共calculated over 1 Å wide bins兲 as a function of distance from the NC surface, which is defined by Delaunay tesselation. The solid line is a fit to the data to guide the eye.
Surface
Matrix
NC
FIG. 5. 共Color online兲 Top: Silicon bond orders 共triangles兲 and charges共circles兲 as functions of distance from the surface of NC. Middle: Oxygen bond orders and charges as functions of distance from the surface of NC. Bottom: Total average charge as a function of distance from the surface of NC. The averaging bin width is 1 Å.
atoms, which reach the value of 1.3e at the oxide region共Fig. 5兲. As a result, the positive charges of surface-Si atoms form a shell at the surface of NC. This observation is similar to those obtained with DFT calculations.18,19On the other hand,
negative charges of oxygen atoms bonded to the surface form another shell that encloses NC, and, finally, total aver-age charges approach to zero within the oxide region. In Fig. 5, we also observe that the magnitude of the average charges of oxygen atoms that are bonded to the surface is greater than that in the matrix. However, the bond orders are nearly the same. This is due to the existence of 3cO atoms bonded to the surface. Note that the average bond order of oxygen atoms that are bonded to the surface is about 2共see Fig.5兲. Thus, those oxygen atoms form three partial bonds, two strong bonds and one weak bond. Finally, we would like to note that unlike many others,2,3,6 we do not observe any double bonds.
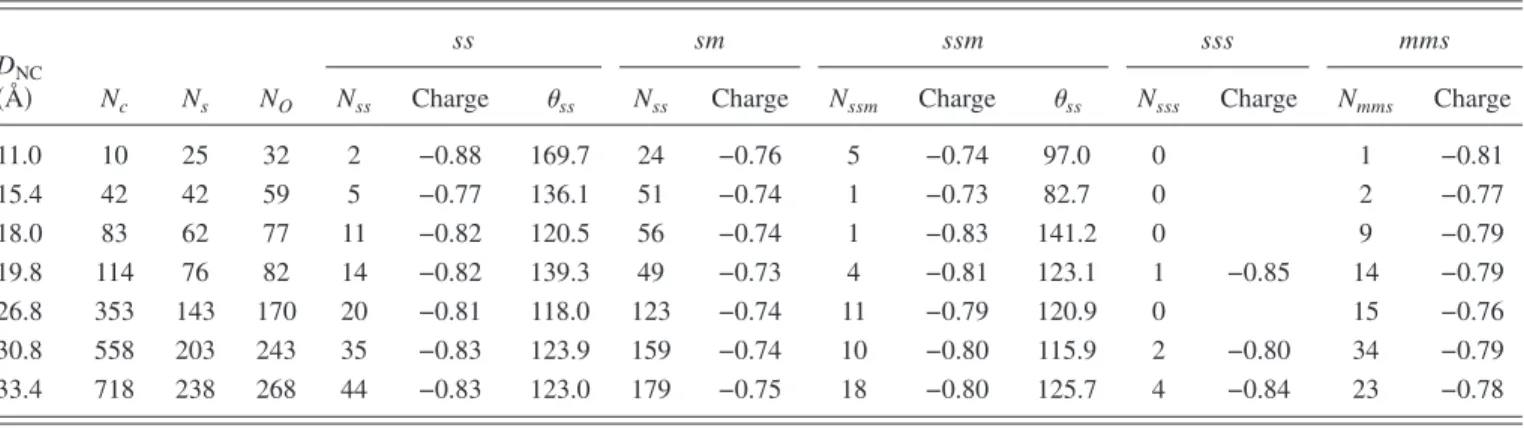
The occurrence of 3cO has been noted by a number of groups. Pasquarello showed that the bistable E1
⬘
defect of an ␣-quartz structure may lead to 3cO as a metastable state as well as a SiuSi dimer bond and calculated the energy of the former to be higher than the latter. Pasquarello proposed that 3cO acts as an intermediate metastable state during struc-tural relaxations at the interface.20 Similarly, Boero et al.observed 3cO atoms in their ab initio calculations21and re-ported this feature as a metastable state. In Table I, we present the collected statistical data at the end of the simula-tion for 75 ps. For all oxygen complexes, the number of bridges, average charges of bridge oxygens, and average bridge angles for s-O-s are tabulated. We observe in TableI that the number of sss complexes is very small due to the narrow bond angle requirement of this configuration. For the remaining 3cO complexes, ssm and mms, their percentages are seen to increase with curvature. This can explain the fact that other studies20,21that have identified the 3cO complexes
as metastable were based on the planar Si/SiO2 interfaces.
So, this is an indication of the importance of curvature in the stability of 3cO complexes. Hence, as one would expect, there is a linear relation between the total number of bridges with surface area, as indicated in Fig.6. This finding is sup-ported by Kroll and Schulte, who resup-ported 3 and 33 such bridges for Si NC with radii 4.30 and 7.0 Å, respectively.18
IV. CONCLUSIONS
In conclusion, the realistic chemical environment pro-vided by the reactive force field model enables us to under-stand the bond topology of the Si NC/a-SiO2 interface and
its internal dynamics. Particularly, it reveals that there are different types of oxygen complexes at the Si NC surface, some of which contain 3cO complexes whereas there are no double bonds. The curvature has a positive effect on the oc-curence of 3cO. The relative abundance of different com-plexes and their charge and geometrical characteristics are extracted. The inner core is observed to be almost unstrained, while the outer core and the interface region of the NC are under increasing strain up to about a few percent. In general, our work clearly shows that the Si NC–oxide interface is more complicated than the previously proposed schemes, which were based on solely simple bridge and double bonds. The provided information here paves the way to constructing realistic Monte Carlo moves for the simulation of large-scale silicon nanostructures embedded in an oxide matrix. TABLE I. Statistical results of atom charges and numbers N for all NC diameters DNCconsidered. The abbreviations for atom types are explained in Fig.1. Charges are in the units of electronic charge and the angles are in degrees.
DNC
共Å兲 Nc Ns NO
ss sm ssm sss mms
Nss Charge ss Nss Charge Nssm Charge ss Nsss Charge Nmms Charge
11.0 10 25 32 2 −0.88 169.7 24 −0.76 5 −0.74 97.0 0 1 −0.81 15.4 42 42 59 5 −0.77 136.1 51 −0.74 1 −0.73 82.7 0 2 −0.77 18.0 83 62 77 11 −0.82 120.5 56 −0.74 1 −0.83 141.2 0 9 −0.79 19.8 114 76 82 14 −0.82 139.3 49 −0.73 4 −0.81 123.1 1 −0.85 14 −0.79 26.8 353 143 170 20 −0.81 118.0 123 −0.74 11 −0.79 120.9 0 15 −0.76 30.8 558 203 243 35 −0.83 123.9 159 −0.74 10 −0.80 115.9 2 −0.80 34 −0.79 33.4 718 238 268 44 −0.83 123.0 179 −0.75 18 −0.80 125.7 4 −0.84 23 −0.78 0 50 100 150 200 250 300 0 10 20 30 40 50 60 70 N um b er o fb rid ges R2(Å2)
FIG. 6. 共Color online兲 The number of bridges at the Si NC surface vs radius squared. The line is a linear fit to the data.
ACKNOWLEDGMENTS
This work has been supported by the European FP6 Project SEMINANO with Contract No. NMP4 CT2004 505285 and by the Turkish Scientific and Technical Council
TÜBİTAK with Project No. 106T048. The visit of Tahir Çağın to Bilkent University was facilitated by the TÜBİTAK BİDEB-2221 program. The computational resources are supplied in part by TÜBİTAK through the TR-Grid e-Infrastructure Project.
*[email protected] †[email protected] ‡[email protected]
1T. Canham, Appl. Phys. Lett. 57, 1046共1990兲.
2M. V. Wolkin, J. Jorne, P. M. Fauchet, G. Allan, and C. Delerue, Phys. Rev. Lett. 82, 197共1999兲.
3A. Puzder, A. J. Williamson, J. C. Grossman, and G. Galli, Phys. Rev. Lett. 88, 097401共2002兲.
4E. Luppi, F. Iori, R. Magri, O. Pulci, S. Ossicini, E. Degoli, and V. Olevano, Phys. Rev. B 75, 033303共2007兲.
5M. Gatti and G. Onida, Phys. Rev. B 72, 045442共2005兲. 6I. Vasiliev, J. R. Chelikowsky, and R. M. Martin, Phys. Rev. B
65, 121302共R兲 共2002兲.
7Y. Tu and J. Tersoff, Phys. Rev. Lett. 89, 086102共2002兲. 8G. Hadjisavvas and P. C. Kelires, Phys. Rev. Lett. 93, 226104
共2004兲.
9D. E. Yılmaz, C. Bulutay, and T. Çağın, J. Nanosci. Nanotech-nol. 8, 635共2008兲.
10A. Pasquarello, M. S. Hybertsen, and R. Car, Nature共London兲
395, 58共1998兲.
11D. W. Brenner, Phys. Rev. B 42, 9458共1990兲; D. W. Brenner, O.
A. Shenderova, J. A. Harrison, S. J. Stuart, B. Ni, and S. B. Sinnot, J. Phys.: Condens. Matter 14, 783共2002兲.
12A. C. T. van Duin, A. Strachan, S. Stewman, Q. Zhang, X. Xu, and W. A. Goddard III, J. Phys. Chem. A 107, 3803共2003兲. 13E. Demiralp, T. Çağın, and W. A. Goddard, Phys. Rev. Lett. 82,
1708共1999兲.
14N. T. Huff, E. Demiralp, T. Çağın, and W. A. Goddard, J. Non-Cryst. Solids 253, 133共1999兲.
15R. J. Renka, ACM Trans. Math. Softw. 22, 1共1996兲.
16H. Hofmeister, F. Huisken, and B. Kohn, Eur. Phys. J. D 9, 137 共1999兲.
17A. K. Rappe and W. A. Goddard, J. Phys. Chem. 95, 3358 共1991兲.
18P. Kroll and H. J. Schulte, Phys. Status Solidi B 243, R47 共2006兲.
19P. Kroll and H. J. Schulte, Mater. Res. Soc. Symp. Proc. 958, 0958L07共2007兲.
20A. Pasquarello, Appl. Surf. Sci. 166, 451共2000兲.
21M. Boero, A. Oshiyama, P. L. Silvestrelli, and K. Murakami, Appl. Phys. Lett. 86, 201910共2005兲.