EXPRESSION OF KEY SYNAPTIC PROTEINS IN ZEBRAFISH
(DANIO RERIO) BRAIN FOLLOWING CALORIC
RESTRICTION AND ITS MIMETIC AND THEIR
RELATIONSHIP WITH GENDER
A THESIS SUBMITTED TO
THE GRADUATE SCHOOL OF ENGINEERING AND SCIENCE OF BILKENT UNIVERSITY
IN PARTIAL FULFILLMENT OF THE REQUIREMENTS FOR THE DEGREE OF MASTER OF SCIENCE IN NEUROSCIENCE By Ayşegül Dede January 2017
ii
EXPRESSION OF KEY SYNAPTIC PROTEINS IN ZEBRAFISH (DANIO RERIO) BRAIN FOLLOWING CALORIC RESTRICTION AND ITS MIMETIC
AND THEIR RELATIONSHIP WITH GENDER
By Ayşegül Dede January 2017
We certify that we have read this thesis and that in our opinion it is fully adequate, in scope and in quality, as a thesis for the degree of Master of Science.
Approved for the Graduate School of Engineering and Science
Director of the Graduate School
Michelle Marie Adams (Advisor)
Ayşe Begüm Tekinay
Özlen Konu Çağdaş Devrim Son
Tülin Yanık
iii
ABSTRACT
EXPRESSION OF KEY SYNAPTIC PROTEINS IN ZEBRAFISH (DANIO
RERIO) BRAIN FOLLOWING CALORIC RESTRICTION AND ITS
MIMETIC AND THEIR RELATIONSHIP WITH GENDER
Ayşegül Dede MSc in Neuroscience Advisor: Michelle Marie Adams
January 2017
Aging is a progressive decline of physiological functioning and metabolic processes. Among all the organs, the brain seems to be the most vulnerable part of the body to the age-related changes because of the relatively high consumption of oxygen and glucose as compared to other organs. Both structural and cognitive changes occur during the aging process. A great effort has been spent to ameliorate the outcomes occurring within the brain as a result of aging. Caloric restriction (CR) is considered to be the only non-genetic intervention which decreases age-related cognitive decline. Rapamycin (RAP) has become a candidate drug which was shown to mimic the effects of CR by blocking the nutrient-sensing pathway, the mammalian target of Rapamycin, (mTOR) pathway. The first aim of this study was to investigate the expressions of key synaptic proteins; gephyrin, PSD-95 and synaptophysin, which are involved in the synaptic plasticity, after short-term (4 weeks) CR and RAP interventions in young and old, male and female zebrafish. The second aim was to investigate whether the expression of glutamate receptor subunits, NR2B and
iv
GluR2/3, display a sexually dimorphic pattern in middle age zebrafish. It was found that there was no significant difference in the expression of key synaptic proteins between the CR and RAP animal groups as compared to the ad libitium (AL) fed group and also no significance was found in the expression of NR2B and GluR2/3 in middle-aged male and female zebrafish. Highlighted studies in this thesis demonstrate that short-term (4 weeks) of CR and RAP treatments were too short to observe an effect in the expression level of gephyrin, synaptophysin, and PSD-95, and in the middle age, expression of NR2B and GluR2/3 did not display sexually dimorphic pattern. Our initial results of key synaptic protein levels indicate that they are stable throughout aging with respect to gender and CR interventions.
Keywords: aging, zebrafish, brain aging, caloric restriction, rapamycin, sexual
v
ÖZET
ZEBRA BALIĞI (DANIO RERIO) BEYNİNDEKİ ANAHTAR SİNAPTİK PROTEİN İFADELERİNİN KISA SURELİ KALORİ KISITLAMASI VE
KALORİ KISITLAMASI TAKLİTÇİSİ VE CİNSİYETLE İLİŞKİSİ
Ayşegül Dede
Nörobilim Lisansüstü Programı, Yüksek Lisans Tez Danışmanı: Michelle Marie Adams
Ocak 2017
Yaşlanma, fizyolojik işlevler ve metabolik süreçlerdeki azalmadır. Vücuttaki organlar arasında beyin, diğer organlara kıyasla nispeten yüksek oksijen ve glikoz tüketimi nedeniyle yaşla ilişkili değişikliğe karşı vücudun en savunmasız organıdır. Yaşlanma sürecinde yapısal ve kognitif değişiklikler meydana gelir. Yaşlanma ile beyninde ortaya çıkan sonuçların iyileştirilmesi için büyük bir çaba harcanmaktadır. Kalori kısıtlaması (KK), yaşla ilişkili olarak azalan kognitif fonksiyonları geliştirmede genetik olmayan tek müdahale olarak düşünülmektedir. Rapamisin (RAP), rapamisin memeli hedefi (mTOR) besin sinyal yolağını bloke ederek, KK’nın etkilerini taklit ettiği gösterilen aday bir ilaçtır.Bu çalışmanın ilk amacı, kısa süreli (4 hafta) KK ve RAP uygulamasının yaşlı ve genç, dişi ve erkek zebra balıklarındaki önemli sinaptik proteinler olan sinaptofizin, post-sinaptik yoğun protein 95 kD (PSD-95) ve gephyrinin protein ifadesine etkisine bakmaktır. Bu çalışmanın ikinci amacı ise glutamat reseptör alt birimlerinin (NR2B ve GluR2 / 3) ifadelerinin orta yaş zebra balığında cinsel dimorfik bir model gösterip göstermediğini araştırmaktır. Sonuçlar,
vi
önemli sinaptik proteinlerin ifadelerinin, KK ve RAP hayvan grupları, kontrol grubu ile karşılaştırıldığında anlamlı bir fark bulunmadığı ve glutamat reseptör alt birimlerinin ifadelerinin orta yaşlı dişi ve erkek zebra balıklarında birbirinden anlamlı olarak farklı olmadığını göstermiştir. Bu tez çalışmasında vurgulanan çalışmalar kısa süreli KK ve RAP tedavisinin, gephyrin, sinaptofizin ve PSD-95'in ifade düzeyinde bir etki gözlemlemek için çok kısa olduğunu ve orta yaşlı zebra balıklarındaki NR2B ve GluR2/3'ün ifadesinin cinsel dimorfik özellik göstermediğini göstermektedir. Başlangıç sonuçlarımız, anahtar sinaptik protein seviyelerinin yaşlanma süresince cinsiyetlerde ve KK müdahaleleri açısından sabit kaldığını göstermektedir.
Anahtar kelimeler: Yaşlanma, zebrabalığı, beyin yaşlanması, kalori kısıtlaması,
vii
ACKNOWLEDGEMENT
First and foremost, I would like to express my gratitude to my advisor Dr. Michelle Adams for accepting me as her student and for her patience, guidance, knowledge and support, without her I would not have performed any of these experiments.
I’d like to thank Dr. Ayşe Begüm Tekinay, Dr. Çağdaş Devrim Son, Dr. Özlen Konu and Dr. Tülin Yanık for their kindness on accepting to take part in my thesis
committee.
I’d like to acknowledge my dear collages in Adams lab; Dr. Ayça Arslan Ergül, Dr. Fusun Doldur-Ballı, Melek Umay Tüz, Begün Erbaba, Naz Şerifoğlu for their guidance and friendship. I acknowledge Narin Ilgım Ardıç for the western blot experiments in the Chapter 2. I’d like to express my sincere gratitude to Elif Tugce Karoglu and Zeynep Erbas for their help in statistics and experiments.
I’d like to acknowledge Tulay Arayici for the zebrafish brain dissections.
I’d like to thank Dr. Esra Yuca for her advices, kindness and inspiration.
I would like to thank my dearest friends Pelin Özge Burhan, Ergül Dilan Çelebi, and Göksemin Şengül for their full-time friendship and support.
I would also like to thank my amazing friends Selin Su Yirmibesoglu, Seren Hamsici, Melike Sever and Gokhan Gunay for their support, belief, inspiration, love and always reminding me what it means to be a friend, in good times and bad times.
I’d like to convey my sincere thanks for my friends Selen Erpalak, Ozge Ozguc, Tayanc Gozel, Hazal Sena Metin, Ceren Ozen, Esin Gulce Seza, Hulya Copoglu,
viii
Ebru Okur, Gokhan Mamak for their friendship since the very first day of my undergraduate years.
I’d like to thank Dr. Sertac Onde for all the support, food and best wishes throughout my undergraduate and graduate years.
I’d like to express my sincere appreciation to my family and my family to-be Egemen Deniz Eren. Without their support, love and encouragement, none of them could have happened. I’d like to dedicate my thesis to my Father whom I want to be the most proud of me.
I would like to acknowledge The Scientific and Technological Research Council of Turkey (TUBITAK) grant no 214S236 for funding my research and financially supporting me.
ix
TABLE OF CONTENTS
ABSTRACT ... iii ÖZET... v ACKNOWLEDGEMENT ... vii TABLE OF CONTENTS ... ixLIST OF FIGURES ... xiv
LIST OF TABLES ... xvi
Abbreviations ... xvii CHAPTER 1 ... 1 1. Introduction ... 1 1.1 Aging ... 1 1.1.1 Brain Aging ... 2 1.1.1.1 Structural Changes ... 2
1.1.1.2 Neurochemical and Metabolic Changes ... 3
1.1.1.3 Cognitive Changes ... 3
1.2 Caloric Restriction ... 5
1.3 Rapamycin ... 6
1.4 Zebrafish as a Model Organism ... 8
1.5 Gender Difference ... 9
x
2. Expression of PSD-95, Synaptophysin and Gephyrin in Calorically Restricted
and Rapamycin Treated Young and Old, Male and Female Zebrafish ... 12
2.1 Introduction ... 12
2.2 Materials and Methods ... 16
2.2.1 Subjects ... 16
2.2.2 Housing ... 16
2.2.3 Treatment ... 17
2.2.4 Dietary Regimen ... 17
2.2.5 Weighting and Transferring ... 17
2.2.6 Euthanasia ... 17
2.2.7 Protein Isolation ... 18
2.2.8 Protein Quantification ... 18
2.2.9 Sodium Dodecyl Sulfate-Polyacrylamide Gel Electrophoresis (SDS-PAGE) ... 20
2.2.9.1 Preparation of Resolving and Stacking Gel. ... 20
2.2.9.2 Preparation of Protein Samples and Loading & Running ... 22
2.2.10 Western Blot. ... 23
2.2.10.1 Transfer. ... 23
2.2.11 Primary and Secondary Antibody Incubation... 26
xi 2.2.13 Imaging. ... 28 2.2.14 Quantification ... 28 2.2.15 Statistical Analysis. ... 28 2.3 Results. ... 29 2.3.1. Body Weight ... 29
2.3.2. Synaptophysin-PSD-95-Tubulin and Gephyrin Expression ... 33
2.4 Discussion ... 40
CHAPTER 3 ... 55
3 Expression of Glutamate Receptor Subunits NR2B And Glur2/3 in Middle-Aged Male And Female Zebrafish ... 55
3.1 Introduction ... 55
3.2 Materials and Methods ... 58
3.2.1 Subjects ... 58
3.2.2 Housing ... 58
3.2.3 Euthanasia ... 58
3.2.4. Protein Isolation ... 58
3.2.5 Protein Quantification ... 59
3.2.6 Sodium Dodecyl Sulfate-Polyacrylamide Gel Electrophoresiss (SDS-PAGE)... 59
xii
3.2.6.2 Preparation of Protein Samples and Loading & Running ... 60
3.2.7 Western Blot ... 61
3.2.7.1 Transfer ... 61
3.2.8 Primary and Secondary Antibody Incubation... 61
3.2.9. Antibodies ... 62 3.2.9.1 Anti-NR2B.. ... 62 3.2.9.2 Anti-GluR2+GluR3. ... 63 3.2.10 Chemiluminescent Detection ... 63 3.2.11 Imaging. ... 63 3.2.12 Quantification ... 63 3.2.13 Statistical Analysis ... 64 3.3 Results ... 64 3.3.1 Optimization of Antibodies ... 64 3.3.1.1 Anti-NR2B Optimization ... 64
3.3.1.2 Anti-GluR2+ GluR3 Optimization ... 71
3.3.2. Expression of anti-NR2B and anti-GluR2+GluR3 in Middle-Aged Male and Female Zebrafish: Preliminary Study. ... 72
3.4 Discussion ... 74
CHAPTER 4 ... 80
xiii
xiv
LIST OF FIGURES
Figure 2.1 Preparation of Transfer Sandvich.. ... 25 Figure 2.2 Change in the initial body weight of (A) old, (B) young, (C) male and (D) female animals. ... 32 Figure 2.3 Representative image of the blots incubated with PSD-95 / TUB / SYN antibody. (This experiment was performed by Narin Ilgim Ardic.) .. ………33 Figure 2.4 The relative expression of PSD-95 protein levels across gender, age and treatment groups. (A) The relative expression of PSD-95 in young and old groups across AL, CR and RAP treatments. (B) The relative expression of PSD-95 in male
and female animal groups across AL, CR and RAP
reatments………...………...34
Figure 2.5 The relative expression of synaptophysin protein levels across gender, age and treatment groups. (A) The relative expression of synaptophysin in young and old groups across AL, CR and RAP treatments. (B) The relative expression of synaptophysin in male and female animal groups across AL, CR and RAP treatment…….………...35
Figure 2.6 Relative expression of gephyrin across groups. (A) Representative image of gephyrin and Tubulin bands. (B) Relative expression of gephyrin in young and old animals across AL, CR and RAP groups. (C) Relative expression of gephyrin in male
and female animals across AL, CR and RAP
groups………..37
Figure 3.1 Optimization plan for the antibodies...61 Figure 3.2 Representative image of 1:500 dilution of -NR2B antibody...65
xv
Figure 3.3 Representative image of 1:1000 dilution of -NR2B antibody ... .65 Figure 3.4 Representative image of 1:500 dilution of -NR2B antibody ... 67 Figure 3.5 Representative image of the second membrane with 1:1000 dilution of -NR2B antibody. ... 67 Figure 3.6 Representative image of the second membrane with 1:500 dilution of -NR2B antibody.. ... 68 Figure 3.7 Representative image of the second membrane with 1:1000 dilution of -NR2B antibody.. ... 69 Figure 3.8 Representative images of the two membranes. Left-hand side membrane was incubated with 1:1000 dilution of the anti-NR2B and right-hand side membrane was incubated with 1:2000 dilution of the anti-NR2B... 70 Figure 3.9 Representative image of the expression of anti-GluR2+ GluR3. Left-hand side shows membrane incubated with 1:1000 dilution of anti-GluR2+ GluR3 and right-hand side shows the membrane incubated with 1:2000 dilution of anti-GluR2+ GluR3.. ... 71 Figure 3.10 Representative picture of the expression of NR2B, GluR2+GluR3, and Tubulin.. ... 73 Figure 3.11 Relative expression of gephyrin across groups. (A) Representative image of gephyrin and Tubulin bands. (B) Relative expression of gephyrin in young and old animals across AL, CR and RAP groups. (C) Relative expression of gephyrin in male and female animals across AL, CR and RAP groups……... ...74
xvi
LIST OF TABLES
Table 2.1 Distribution of subjects ... 16
Table 2.2 Amounts of solutions required to be added into each tube from 1 mg/mL BSA ... 19
Table 2.3 Bradford assay for protein samples. ... 19
Table 2.4 10 mL 10% Resolving Gel. ... 20
Table 2.5 8 mL 4% Stacking Gel ... 21
Table 2.6 Duration of primary and secondary antibody washings... 28
Table 2.7 Descriptive statistics of young and old (A), and male and female (B) animals’ initial and final body weights based on treatment groups. ... 30
Table 2.8 Loss of the body weight of each animal as percentages………...31
Table 2.9 Descriptive statistics of β-tubulin expression levels across AL, CR and RAP groups………..36
Table 2.10 Descriptive statistics of β-tubulin expression levels across AL, CR and RAP groups………..39
Table 3.1 10 mL 8% Resolving Gel ... 59
Table 3.2 8 mL 4% Stacking Gel ... 60
Table 3.3 Washing durations of the primary antibodies. ... 62
xvii
Abbreviations
AL Ad-libitum
ANOVA Analysis of Variance
AMPA α-amino-3-hydroxy-5-methyl-4-isoxazolepropionic acid
APS Ammonium per sulfate
BDNF Brain-derived neurotrophic factor CR Caloric Restriction
DG Dentate Gyrus DMSO Dimethyl sulfoxide GABA γ-Aminobutyric acid kDa kilo Dalton
LTP Long Term Potentiation MANOVA Multiple Analysis of Variance MRI Magnetic resonance imaging mTOR mammalian target of rapamycin NMDA N-Methyl-D-aspartete
PCA Principal Component Analysis PKB Protein kinase B
PSD-95 postsynaptic density protein 95 RAP Rapamycin
SDS-PAGE Sodium Dodecyl Sulfate–Polyacrylamide Gel Electrophoresis
TBS-T Tris-Buffered Saline and Tween 20 TEMED Tetramethylethylenediamine TOR target of rapamycin
1
CHAPTER
1
Introduction
1.1.Aging
Aging is described as a continuous deterioration of physiological and metabolic functions [1,2]. It is a multisystemic process and all systems within the organism are affected; muscles become weaker, bones become more fragile, skin shrinks, immunity and memory become weaker [2]. In order to explain the reasons of aging, many hypotheses were developed such as deteriorations in the biological membranes, attack of free radicals, impairment in calcium regulation, and, particularly in mammals a negative effect of glucocorticoids and stress [3–8].
Decrease in walking speed and increase in the duration of step timing are among the physical dysfunctions that elderly people experience [9,10]. Falling incidence is one of the physical irregularities that come upon with age [10]. Tromp et al. (2001) showed that 30% of elderly people who are 65 years of age fall at least once per year and this rate increases with age [11]. Weakening of muscle strength and disruption in muscle joints are also related to decreases in the physical functioning [12]. In addition to the muscular disturbances; deteriorations in vision, prolonged reaction times, reductions in learning ability are experienced by the elderly [10]. Cross-section studies has reported that in human populations, the remembering of verbal information is decreased with normal aging [13]. Moreover, changes in the age-related memory deprivation is conserved among mammalian species; in humans, monkeys, dogs, and mice, the decline in spatial memory has been
2
observed [13–16]. About 2% of the body weight is represented by the average adult brain and despite its comparatively small size, the brain consumes 20% of the total oxygen [17]. Therefore, the brain is more prone to oxidative damage that occurs with aging.
1.1.1. Brain aging
The influence of aging on the brain is widespread [18]. Effects of aging on the brain can be characterized by a change in the molecules, cells, gross morphology, cognitive functions and metabolism [18]. During the course of aging, a number of changes which influence the structure of the brain occur. Along with the neuroanatomical changes, neurochemical and cognitive changes are also observed during the course of aging [19].
1.1.1.1.Structural Changes
Not all changes associated with aging occur in the same way in all brain regions [20]. Some of the structural changes associated with aging are the reductions in the volume of gray matter (in the frontal lobes, temporal lobes, the hippocampus, and cerebellum), the susceptibility of prefrontal white matter volume, and the decline in the volume of cerebellum and hippocampus [21, 22]. Svennanholm et al. (1997) showed that volume and/or weight of brain decreases by 5% every 10 years after the age of 40 [23]. The loss in the volume of gray matter and striatal volume are also critical components that are associated with aging [24–26]. Reductions in the white matter display correlations with alterations in processing speed, short-term recall and executive function in aged individuals [13]. Magnetic Resonance Imaging (MRI) analysis on the measurement of brain volume has shown that decreases in the volume
3
of frontal cortex occur more than other cortical and subcortical areas [27,18]. It was concluded that all cortical and subcortical areas become smaller with aging and frontal and striatal regions lose more volume compared to other regions. In addition to the change in the volume of brain regions, the neuronal volume is another indicator of aging. Earlier studies reported that age-related cognitive decline was a consequence of a significantly reduced number of cells and synapses [28–34]. However, more recent studies showed that this decline does not occur as a result of aging and stated that synaptic structures or molecules actually do change with age [35–38]. Pioneering work by Rapp et al. (2002) shows that the neuron death does not occur by aging [39]. Similarly, Murphy et al. (1996) demonstrated that with aging, neuronal volume, rather than number, decreases [40]. Additionally, Barnes et al. (2003), described the decrease in the number of dendritic synapses or synaptic plasticity during aging [41].
1.1.1.2.Neurochemical and Metabolic Changes
In rodents, aging-associated reductions in the brain-derived neurotropic factor (BDNF) might contribute to age-dependent changes in the cognitive impairment [42– 44]. Decreases in the secretion of growth hormones was a consequence of aging [45]. Also, in the aging brain glucose metabolism becomes disrupted; glucose and oxygen input decreases [46]. Impairment in calcium metabolism, dysfunction in mitochondrial functioning and increases in the production of reactive oxygen species are other consequences of brain aging [18].
4
1.1.1.3.Cognitive Changes
Cognitive aging is characterized by decreases in learning abilities, poor attention, and deteriorations in memory [47]. As a result of aging, reductions in cognitive function can be observed in most individuals who are between 65-84 years old, and the prevalence rate in the reductions in the cognitive functions was shown to be 28% [48]. When a task involving executive function is given, prefrontal cortex and hippocampus activation were higher in young adults compared to older adults [49], [50]. Particularly, the hippocampus is a crucial brain region for learning and memory and it is vulnerable to aging [51]. Rodents with damaged hippocampus display impairments in learning and memory [52]. Also in humans with damaged temporal lobe, similar to rodents, spatial information processing is impaired [53]. Moreover, Burke and Barnes et al. (2006) showed that hippocampal volume and neuronal plasticity decreased with healthy aging and which explains hippocampus-dependent functional reduction [54]. Ojo et al. (2015) suggested that impaired hippocampal synaptic integrity and signaling and increased neuroinflammation can explain this functional reduction [55]. Loss of synaptic connections is another potential reason for cognitive decline [13]. In aged monkeys and humans, a decrease in synaptic density was observed, and this is correlated with reduced activation in prefrontal cortex while performing an executive function [56, 57]. Also, decreases in the number of synaptic connections in the dentate gyrus region of hippocampus in old rats explain spatial learning impairments [58]. In addition to synaptic connections, decreases in the glutamate uptake and release with age were reported. Glutamate is the major excitatory neurotransmitter in the central nervous system and during aging, density of its receptors N-methyl-D-aspartate (NMDA) receptor and
α-5
amino-3-hydroxy-5-methyl-4-isoxazolepropionic acid (AMPA) receptor display reduction in the number of their subunits [59]. Also, down-regulation of regulatory proteins involved in neurotransmission in the hippocampus was reported [60].
1.2. Caloric Restriction
Caloric restriction (CR) is defined as the reduction in the total calorie intake without any decline in the micronutrients [61]. The favorable results of a CR regimen can be listed as reduced age-related lipid alterations, triggering of protective stress proteins, repression of the age-related decreases in vascularity, as well as a repression of the age-related reduction in neural progenitor cell division, and glutamate receptor subunit levels [61–66]. CR can prolong the life expectancy in a wide range of species including rodents by 20% to 40% and predicates a daily reduction in all dietary components in a certain proportion [67, 68].
Studies showed that CR affects the regulation of adult neuronal stem cells; it leads to an increment of neurogenesis in young adult rats, and in old adults, and it enhances the neurogenesis which normally declines with aging [69–71]. Lee et al. (2002) tested the hypothesis that 3 months of CR improves neurogenesis and reported that there was an increase in the number of newly generated neurons in dentate gyrus (DG) region of hippocampus in adult animals under a CR-feeding regimen and this increase was due to the enhancement of survival [71].
In rodents, nutritional supplementation positively affects memory and learning. Kuhla et al. (2013) reported improvements in learning and memory in animals with lifelong CR diet [72] . Also, levels of key synaptic proteins which change with age and thought to be related to synaptic plasticity in hippocampus have been shown to
6
be stabilized with CR treatment. Adams et al. (2008) showed that in the CA3 region of hippocampus ionotropic type of glutamate receptor subunits displayed age-related reductions in their protein expression level and this reduction was rescued with CR [61]. In the same study, in addition to glutamate receptor subunits, a presynaptic vesicle protein, synaptophysin, was reported to be stabilized in CR animals compared to control animals [61].
Also, CR protects neurons from exotoxins, oxidative and metabolic damages and also enhances neurotransmitter systems particularly in the hippocampus [62], [73]. Metabolic stability has been shown to be a better indicator of longevity than metabolic rate. McCarter and McGee (1989) reported that loss of functions associated with aging is related to impaired homeostatic state and capacity of preserving a steady metabolic state is a determinant of longevity [74]. In addition to its positive effects on health, late onset CR was proposed to extend lifespan; CR regimen conducted on 12 months old rats showed reduction in age-related oxidative stress [75].
Although CR is an important approach, development of potential CR mimetics could be more applicable to humans. Recent studies showed that the positive effects of CR result from the blocking of mammalian target of rapamycin (mTOR) nutrient-sensing pathway both in vivo and in vitro. For example, CR has been shown to alter mTOR signaling in adipose tissue and mammary tumors, and it has been reported that CR regimen changed the expression of genes associated with mTOR signaling in mice hypothalamus [76, 77].
7
1.3. Rapamycin
A National Institute of Aging Intervention Testing Programme has been launched with the purpose of finding compounds which are safe, non-invasive and effective in order to increase the lifespan of model organisms and to date, rapamycin was the most effective FDA approved agent [78]. Because of its involvement in metabolism and regulation of growth in response to aminoacid and nutrient uptake, the target of rapamycin (TOR) became a well-studied pathway in relation to CR and CR mimetics [79]. TOR is an important signaling node which controls cellular metabolism and life span in both invertebrates and vertebrates [80]. It is also involved in the control of cell division, proliferation and survival and regulation of long-lasting synaptic plasticity [81,82]. mTOR is the mammalian homolog of the TOR pathway and is also involved in nutrient sensing pathway, therefore it is thought that rapamycin and CR exert their effects through similar mechanisms [83]. Genetic and pharmacologic blockage of mTOR was shown to increase lifespan in yeasts, worms, fly and mice and this results in the question of the relationship between mTOR and aging [84–88]. For example, 16 weeks or longer rapamycin treatment results in 30% reduction in mTOR activity in mice [89].
In recent years, rapamycin has been shown to significantly increase both median and maximal lifespan in mice [87,88]. As rapamycin can be applied for the long term, it can also be applied for short-term; life span of old mice was found to increase after short-term (6 weeks) rapamycin treatment [90]. Recently, chronic rapamycin treatment has been shown to delay aging by inhibiting the mTOR activity [87].
8
Chronic inhibition of mTOR by rapamycin modulates cognitive and non-cognitive components of behavior throughout lifespan in mice. Compared to control groups, mice under rapamycin treatment displayed some distinct behaviors; they spent significantly more time on voluntary wheel running [91]. Sixteen weeks or longer rapamycin treatment resulted in 30% reduction in mTOR activity in mice [79]. Also, compared to control fed littermates, mice with at least 16 weeks of rapamycin treatment displayed enhancement in age-related cognitive decline [89]. Parallel to those results, in many but not in all rodents; CR activity decreased mTOR activity, similar to rapamycin, and improved cognition [61,76,92–94]. Therefore, reduction in mTOR activity with rapamycin and CR treatment; improves cognition in young mice and maintains cognitive performance in old mice [79].
1.4. Zebrafish as a Model Organism
Many fish species were used as model organisms for aging studies but recently zebrafish (Danio rerio) were designated as a potential organism in order to understand the mechanism of diseases as well as vertebrates development and genetic studies [95]. It is a relatively small fish (1-2 inch), and a fresh water animal native to India [96]. Also, the average lifespan of zebrafish is between 36-42 months and maximum lifespan can reach up to 66 months and its generation time is 3-4 months [95].
For developmental biology studies, it has a couple of advantages; developmental genes of zebrafish are conserved across vertebrates; its small size enables many animals to be hosted even in small places; it is easy to feed them with a water soluble chemical or drug and it is easy to make mutation studies [95]. Also, it is an ideal model for mutation analysis [96]. Since its embryos are transparent;
9
morphology of zebrafish embryos can be monitored with gross or visual examinations [96]. A female zebrafish can produce hundreds of eggs in a clutch and this provides many numbers of offsprings [96]. Fast ex-utero development enables behavioral and morphological observations within 4-7 days [96]. Also, their sizes are large enough to dissect enough tissues from specific organs [96]. Zebrafish possess an integrated nervous system and similar to mammals, they have high behavioral abilities such as learning and memory, and social behaviors [97,98]. Aging zebrafish exhibit phenotypes similar to aging mammals such as the appearance of senescence-associated beta-galactosidase staining and oxidized proteins [99]. Furthermore, aging zebrafish develops spinal curvature morphology [100]. Also, as in most vertebrates, zebrafish shows gradual senescence features during aging [99].
1.5. Gender Difference
Many of sexually dimorphic characteristics were reported at anatomical, molecular and cellular levels in vertebrates including humans and rodents and invertebrates such as drosophila [101,102]. Differences in brain organization and function between genders can result from many regulatory systems; sex-specific genomes of males and females, hormonal regulation, gene expression in various regions of the brain and epigenetic changes [103]. In Drosophila melanogaster, it was reported that 50% of the genes are sexually dimorphic [101]. Similarly, Santos et al. (2008) showed that in zebrafish, there are 42 genes, which are expressed differently in males and females and, protein synthesis is more active in males than females [104]. This diversity also differs depending on the brain region and the age of the subjects. Ampantsiz et al. (2012) showed that in zebrafish, the number of cycling cells differs in males and females depending on the brain region; in medial
10
zone of dorsal telencephalon, periventricular nucleus of the posterior tuberculum and ventral part of periventricular pretectal nucleus the number of cycling cells is more in females [105]. On the contrary, in dorsal zone of periventricular zone number of cycling cells in more in males [105]. The in-situ hybridization method employed by Bayless and Shah (2016) showed that the upregulation and downregulation of genes show variation based on the region and gender in mice which were explained by the sex hormones, and contribution of sexually dimorphic gene expression to sexually dimorphic social behaviors [106]. Similarly, neuroimaging techniques showed that in mice, sexual dimorphism exists in brain areas such as amygdala and hypothalamus [102]. In humans, gene expression in male brain changes until the age of 60 and 70 and is stabilized in the following years; however, in female brains, change in gene expression proceeds until the age of 80 and 90 [107].
Sexual dimorphism manifests itself at the structural level as well. For example, a study conducted on 380 adult subjects showed that the male brains were structurally more asymmetric in the majority of the brain regions [108]. It was also reported that in male mice, the total area of corpus callosum was larger than the female mice of the same age [102]. Moreover, it was reported that men display higher brain atrophy and increased cerebrospinal fluid in frontal and temporal lobes compared to women [107]. Likewise, it was shown that brain volume of a male mouse is 2.5% larger as compared to a female mouse. Also, in terms of age, it was indicated that men display sharper changes compared to women as they get older [109]. In addition to the structural differences, brain physiology was shown to differ in cognitive tasks between genders [102]. Brain activity, task performance, and memory function were reported to change depending on the gender as well [107].
11
Therefore, the investigation of sexual dimorphism is vital in order to have a comprehensive understanding of the differences in genders, as it would make future studies more comprehensive.
12
CHAPTER
2
Expression of PSD-95, Synaptophysin and Gephyrin in
Calorically Restricted and Rapamycin Treated Young and
Old, Male and Female Zebrafish
2.1.Introduction
Among the non-genetic interventions, CR has been shown to be the only way to postpone aging and age-related cognitive decline in mammals [110]. It has been investigated since the late 1900s-; McCay et al. (1935) showed that decline in the amount of food intake in rats leads to an increment in maximum lifespan and also it was reported that mice under caloric restriction showed enhanced motor and learning performances [111,112]. Furthermore, mice and rats which were given a CR diet displayed decelerated aging and developed protection to the impairments in the tissues occurring with age [110]. The purpose of CR is to reduce the overall calorie intake up to 30-40% without causing undernourishment; therefore, CR does not mean starvation [110]. Duration, regime, age or gender of the organism and organism itself are the key variables for CR studies. CR can be applied for short-term (4- 10 weeks) or longer terms (3 months, 6 months and more) and dietary regimen can be applied with the alternate day feeding method or by reducing the daily portion of the meal [110]. For example, Lee et al. (2002) used alternate day feeding method and 3 months of CR and showed alterations in neurotrophin expression and neurogenesis [71]. Another study investigated the effects of 4, 20 and 74 weeks of CR on the working memory in mice and showed that lifelong CR enhanced the working
13
memory [72]. When 30% CR was applied to 3 months old rats for 6 months and 14 months, expression of PKB and S6 which are the downstream elements in the mTOR pathway, were reduced [113]. However, when 35-40% CR was applied for 6 months to 3-4 months old animals, expression of several proteins involved in this pathway did not change [113]. This indicates that age or the organism, duration of CR and also percentage of the calorie intake is important. Furthermore in CR studies, AL group is important to examine and understand the effects of CR, since it acts as a control group.
Although CR has been shown to increase lifespan and enhance cognitive and physical activities, it is difficult to apply a true CR regimen to humans. Therefore, raising CR mimetics has become an intriguing issue for pharmaceutical companies [110]. Among the candidate drugs, rapamycin, which blocks the mammalian target of rapamycin (mTOR) nutrient sensing pathway, has become the most efficient and well-studied CR mimetic [110].
Rapamycin was shown to increase medial and maximal lifespan in male and female mice [88]. It can be applied short term or long term; for example, Chen et al. (2009) showed that 6 weeks (short term) of rapamycin treatment increase the lifespan of old mice [90]. Not only life span but also cognitive functions can be enhanced with rapamycin treatment. At least 16 weeks of rapamycin treatment has been shown to ameliorate the age-related cognitive decline [89]. Similarly, 16 months and 3 months of rapamycin treatment were reported to enhance cognitive functions by increasing the NMDA signaling [114].
Expression of key synaptic proteins can be investigated as indicators of pre- and postsynaptic integrity. The three synaptic proteins; postsynaptic density protein 95
14
(PSD-95), synaptophysin, and gephyrin are the markers of synaptic integrity. PSD-95 is largely present in the excitatory central nervous system synapses and was first identified as a Type-I or asymmetric PSD. It appears as 90–95 kDa on SDS-polyacrylamide gels [115]. Due to its PDZ domains, it acts as a scaffold protein and is crucial for the anchoring of NMDA- and AMPA-type glutamate receptors and therefore involved in the synaptic plasticity [116]. PSD-95 mutant mice displayed abnormal long-term potentiation (LTP) with impaired learning and memory functions [117]. Because of its role in synaptic functioning on excitatory postsynaptic membranes, PSD-95 is a critical component. Gephyrin is a key, highly conserved scaffold protein that is present in the postsynaptic membrane of the inhibitory synapses and extensively expressed in vertebrates, and it is analogous of PSD-95 in inhibitory synapses [118–120]. It coordinates the organization of postsynaptic density which includes glycine, γ-aminobutyric acid type A (GABAA)
receptors as well as synaptic transmission and long-term potentiation [118]. It has been found to be expressed in diverse tissues involving skeletal muscle, heart, liver and brain with different expression patterns which indicates its decisive role in both central nervous system and metabolism [118]. Therefore, investigation of the expression of gephyrin can provide information about the inhibitory synapses and clustering of inhibitory synaptic proteins. Synaptophysin is a leading synaptic vesicle glycoprotein and expressed in neurons and endocrine cells [121]. Mutant mice which lack the synaptophysin displayed deteriorations in synaptic vesicle formation, maturation and endocytosis; therefore it is considered the molecular marker of synaptic vesicles [121]. Also, the role of synaptophysin in the neurotransmitter release has been investigated widely. It was reported that antisense oligonucleotides
15
or antibodies directed against synaptophysin resulted in the excessive decline in the evoked release reconstituted in Xenopus oocytes [122]. Also, the levels of synaptophysin were reduced in aged rats and resulted in the defects in learning [123]. Similarly, Calhoun et al. (1998) showed the correlation between synaptophysin levels and learning and memory abilities [124]. Therefore, the synaptophysin level is a valid signal of presynaptic integrity.
It has been shown that males and females differ in their brain biochemistry, structure, and function [125]. Alterations in the gene profile across lifespan were also reported to be gender as well as brain region specific [107]. Similar to the gene expression, structural and functional changes, neurogenic capacities of neurons in the cerebellum also differ between genders [126]. In addition to the cerebellum, hippocampus displays sexual dimorphism in terms of its structure, response to stimuli as well as neurochemical make-up [127]. Separating animal groups based on gender will provide answers to the given questions for both genders. For example, females and males express different levels of dendritic spine density under stressed conditions and they respond in opposite ways to the same stimuli which would be a more accurate answer to the question of how do the spine density change under stress conditions [128].
This chapter is designated to demonstrate the expression levels of synaptophysin, PSD-95 and gephyrin after short-term (4 weeks) of CR and rapamycin (RAP) interventions in young and old, male and female zebrafish.
16
2.2. Materials and Methods 2.2.1. Subjects
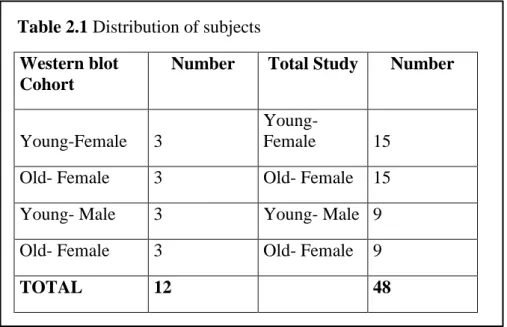
In the experiments, 12 zebrafish (Danio rerio) were used, these animals were one cohort of a larger study of 48 animals. The Bilkent University Local Animal Ethics Committee (HADYEK) approved the zebrafish protocols of this study with the numbers of 2012/6 and 2012/30. Animals were distributed as illustrated in the Table 2.1.
Table 2.1 Distribution of subjects Western blot
Cohort
Number Total Study Number
Young-Female 3
Young-Female 15
Old- Female 3 Old- Female 15
Young- Male 3 Young- Male 9
Old- Female 3 Old- Female 9
TOTAL 12 48
2.2.2. Housing
Subjects were housed at 28 °C with a 14 hours of light and 10 hours of dark cycle and kept within a recirculating tank system in the zebrafish facility of Molecular Biology and Genetics Department, Bilkent University, Ankara, Turkey. Animals were kept in 4 L glass aquaria (Pasabahce, Turkey) and aquaria were cleaned and filled with fresh water twice a week. Before starting the treatment period, the animals were habituated to the glass aquaria.
17
2.2.3. Treatment
Animals were treated either with rapamycin (RAP) or dimethyl sulfoxide (DMSO) (CR and AL groups). The stock solution was prepared by dissolving rapamycin (Fluka, Sigma, Germany) in DMSO (Applichem, Germany) to 500 μM concentration and stored at -20°C. Fifty μL from stock solution was added to the water of RAP group, and 50 μL of DMSO was added to the water of CR and AL groups in order to obtain a final concentration of 100 nM. The drugs and treatments were administered during light cycles.
2.2.4. Dietary Regimen
Ad-libitum (AL) feeding and caloric restriction (CR) were the two dietary conditions. AL animals were fed with 20 mg of food (TetraMin, Germany) and CR animals were fed with 1 mg of food per fish per day on weekdays and animals were fed individually in 600 mL glass beakers (Isolab, Germany) with 250 mL system water. On weekends, fish were not separated from the housing tanks and AL and RAP group were fed with 40 mg of food and CR group were fed with 2 mg of food. 2.2.5. Weighing and Transferring
In order to transfer the fish from aquaria to the beakers, separate nets were used for the each animal group. During weekdays, fish were transferred to the beakers for treatment, housed there for 5 hours and taken back to its aquaria. On Mondays and Fridays fish were weighed in a 250 mL beaker.
2.2.6. Euthanasia
Subjects were euthanized in a tank filled with distilled water and ice. After euthanasia, removal of the head from the body was performed by using a scalpel.
18
The eyes and optic nerves were taken out to allow separation of brain from the skull. The brain was dissected from the skull and put in a 0.5 mL microtube and thrown in liquid nitrogen for snap freeze and stored at -80°C. In order to be able to identify the gender of animals, the abdomen areas of each animal were dissected. Presences of eggs were an indication of females and presence of testes were an indication of male zebrafish. In the cases of which no visible eggs or testes could be observed, animals were excluded from the study.
2.2.7. Protein Isolation
Before homogenization of the brain tissues, lysis buffer solution which is composed of 75 μL of 2M NaCl, 50 μL of 1M TrisHCl pH:8, 10 μL of 100% NP-40, 10 μL 10% SDS, 355 μL sddH2O and 500 μL of protease inhibitor (2x stock, 05 892
970 001, Roche) for 1 mL was prepared. Brain samples were placed another 1.5 μL Eppendorf tube. Sixty μL of lysis buffer was added for each 1 mg tissue. Samples were homogenized by using a 2 mL syringe by pawing through 5-10 times. Homogenates were incubated on ice for 30 minutes by gently mixing twice and centrifuged at 13.000 rpm for 20 minutes at 4oC. Supernatants of samples were taken and aliquoted.
2.2.8. Protein Quantification
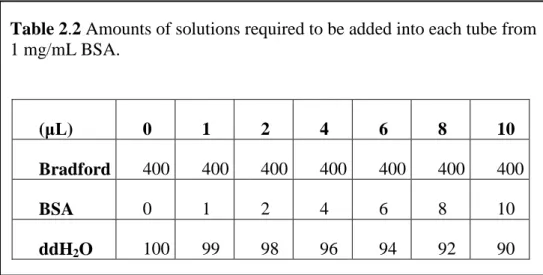
Bradford assay (Bradford Reagent, B6916, Sigma, St. Louis, MO, USA) was employed in order to determine the soluble protein concentration. Bovine serum albumin (BSA; Sigma, St. Louis, MO, USA) was used as a standard in order to construct a standard curve. The samples were added according to Table 2.2.
19
Table 2.2 Amounts of solutions required to be added into each tube from 1 mg/mL BSA.
Bradford, sample proteins, and ddH2O were added into each tube according to
Table 2.3 in order to quantify of the sample proteins.
Table 2.3 Bradford assay for protein samples.
Into the 1.5 μL Eppendorf tube, first 99 μL of ddH2O and then 1 μL of protein
were added for each sample and tubes were kept in ice. Finally, Bradford reagent was added and all samples were incubated for 5 min at room temperature. Beckman DU-640 Spectrophotometer (6511 Bunker Lake Blvd. Ramsey, Minnesota, 55303 USA) was employed to quantify proteins in the lysates. The wavelength of the Spectrophotometer was set to 595 nm= λ. First, blank samples were measured. Based on the data, the graph of the A595 vs. BSA variables was drawn and the linear graph and the equation validating the graph were supplied by using Excel file.
(μL) 0 1 2 4 6 8 10
Bradford 400 400 400 400 400 400 400
BSA 0 1 2 4 6 8 10
ddH2O 100 99 98 96 94 92 90
For Sample Protein Volume
Bradford 400 μL
Total Protein 1 μL
20
2.2.9. Sodium Dodecyl Sulfate–Polyacrylamide Gel Electrophoresis (SDS-PAGE)
SDS-PAGE enables protein separation according to their size. Two types of agarose gels were prepared for the SDS-PAGE, the one in the bottom is the basic (pH 8.8) resolving gel, which has high acrylamide content and the one in the top is the slightly acidic (pH 6.8) stacking gel and composed of low acrylamide content. 2.2.9.1. Preparation of Resolving and Stacking Gel
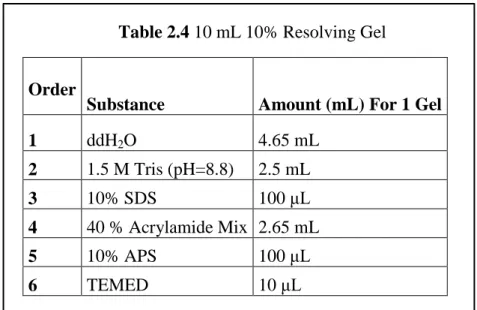
In order to prepare 10 mL 10% Resolving Gel, 15 mL empty falcon was used. Two different sized glass plates (Biorad Life Science 1000 Alfred Nobel Drive Hercules, California 94547 USA) and 1 spacer 1.0 mm thick (Biorad Life Science 1000 Alfred Nobel Drive Hercules, California 94547 USA) were taken and each glass plate was attached to spacers. After mixing all the reagents according to the Table 2.4 by slowly swirling, the mixture was poured immediately between the glass holders till the line of the holder by Pasteur pipette. In order to remove bubbles, isopropanol was gently added. After polymerization occurred, isopropanol was cleared out and the gel was washed with ddH2O.
Table 2.4 10 mL 10% Resolving Gel
Order
Substance Amount (mL) For 1 Gel
1 ddH2O 4.65 mL 2 1.5 M Tris (pH=8.8) 2.5 mL 3 10% SDS 100 μL 4 40 % Acrylamide Mix 2.65 mL 5 10% APS 100 μL 6 TEMED 10 μL
21
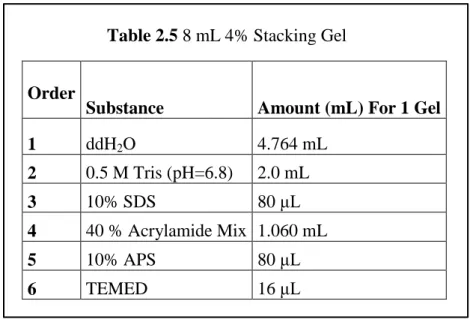
In order to prepare 8 mL 10% Stacking Gel, 15 mL empty falcon was used. Gel was prepared by adding the given order in Table 2.5 and mixed by using pasteur pipette and the comb was placed on it. After polymerization occurred, the slips, comb, and bottom spacer were removed.
Table 2.5 8 mL 4% Stacking Gel
Order
Substance Amount (mL) For 1 Gel
1 ddH2O 4.764 mL 2 0.5 M Tris (pH=6.8) 2.0 mL 3 10% SDS 80 μL 4 40 % Acrylamide Mix 1.060 mL 5 10% APS 80 μL 6 TEMED 16 μL Reagents:
1. Separating Buffer (1.5 M Tris-HCl, pH 8.8):
For 100 mL, 18.171 g of Tris Base (FW:121.14) was dissolved in 50 mL of water. pH was adjusted to 8.8 with HCl then add full volume of water.
2. Stacking Buffer (0.5 M Tris-HCl, pH 6.8):
For 100 mL, 6 g Tris Base (FW:121.14) was dissolved in 60 mL water. pH was adjusted to 6.8 with HCl then volume was adjusted with water.
22
3. Sodium Dodecyl Sulfate SDS (10%):
10 g lauryl sulfate was dissolved in 90 mL ddH2O dissolve, brought to 100 mL.
4. Ammonium per sμL fate APS: (10%, Fresh): 30 mg ammonium persulfate was dissolved in 300 μL sddH2O.
2.2.9.2. Preparation of Protein Samples and Loading & Running
Protein concentration was calculated according to the Bradford Quantification assay and appropriate volumes of the samples were diluted with loading buffer; 25 μL of protein plus ddH2O, and 25 μL of loading buffer were mixed and the
Eppendorf tubes were incubated at 95oC for 10 minutes to boil the proteins within the samples and denature them but keeping sulfide bridges. Also, this provides negatively charged amino acids not being neutralized and allow running of the proteins in the electric fields. Then they were quickly span down by centrifuge machine. Samples were kept on ice till the loading protocol. In total 50 μL of was loaded into the wells.
Mini-PROTEAN 4- gel electrophoresis system was used for casting and running 1.0 mm thickness gels. The system comes with a tank, lid with power cables, 1 electrode assembly, 1 companion running module 1 minicell buffer dam, 2 casting stands, 4 casting frames, 5 10-well combs, and 5 sets of glass plates. Glasses were placed on cassette and cassettes were placed into the tank. The tank was loaded with running buffer till ‘2 gels’ level. The comb was removed and wells were washed with 1X Running buffer by using 2mL syringe. Samples were loaded into the wells and empty wells were loaded with sample buffer. Thermo Scientific PageRuler Prestained Protein Ladder (2x250 μL 10 to 170 kDa- with product number “26616”)
23
was used as a marker. Its formulation is: dye- stained proteins in 62.5 mM Tris-phosphate( pH= 7.5), 1 mM EDTA, 2% SDS, 10 mM DTT, 1 mM NaN3 and 33% glycerol. The tank was connected to the Bio-Rad power supply and set 90V at room temperature for 30 minutes for stacking and 120 V and kept working till the blue dye reached the bottom for separation of the proteins.
Reagents:
1. Loading Buffer:
4 % SDS (4 mL from % 10 SDS), 10 % B-ME, 20 % glycerol (2 mL), 0.004 % BPB (100 ul from 4% stock) and 0.125 M Tris-HCl pH= 6.8 were mixed.
2. 10x Running Buffer:
25 mM TrisBase ( stock powder FW121.14), 195 mM Glycine ( stock powder MW75.07) and SDS ( from stock 10%). For 1 L of 10X running buffer, 30.285 gr of 25 mM TrisBase and 144.134 gr of 195 mM Glycine were dissolved in 500 mL ddH2O. After, 100 mL of 10% SDS was added and mixed gently in order to prevent
bubble formation. pH was adjusted to 8.3 and bottle was filled till 1L. Before using it in SDS-PAGE, 10X running buffer was diluted to 1X and kept in 40C.
2.2.10. Western Blot 2.2.10.1. Transfer
Transfer is the primary step for Western blotting. It uses electric field perpendicular to the surface of the gel and results in the transfer of proteins on the gel to the membrane. When running was completed, cassettes were removed from the tank. The glass holders were separated from each other. The gel was cut by razor
24
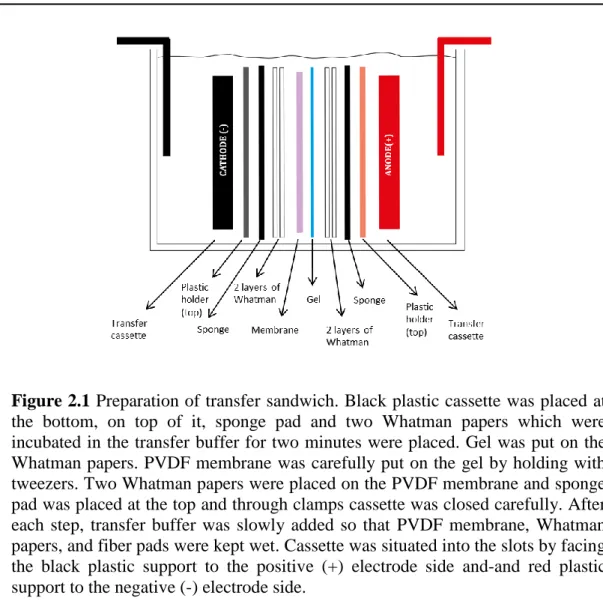
blade from the line, which separates the resolving gel from the stacking gel and equilibrated in transfer buffer for 10 minutes. One piece of nitrocellulose PVDF membrane (Immubilon-P Transfer Membrane MD Millipore, Billerico, MA, USA) which is activated with 100% methanol, was cut in appropriate dimensions (i.e., same size of the gel), incubated in 100% methanol for 15 seconds and incubated in cold transfer buffer for 5 minutes. For each membrane, four Whatman papers were cut in appropriate dimensions (i.e., same size of the gel) incubated in cold transfer buffer for 10 minutes. The PVDF membrane, four Whatman papers, gel, and two fiber pads were placed in transfer sandwich as described in Figure 2.1. For each step of the sandwich preparation, a 10mL tube was used to remove any air bubbles between the layers by gently rolling over the sandwich and transfer buffer were poured gently to keep PVDF membrane, Whatman papers and fiber pads wet.
25
Figure 2.1 Preparation of transfer sandwich. Black plastic cassette was placed at the bottom, on top of it, sponge pad and two Whatman papers which were incubated in the transfer buffer for two minutes were placed. Gel was put on the Whatman papers. PVDF membrane was carefully put on the gel by holding with tweezers. Two Whatman papers were placed on the PVDF membrane and sponge pad was placed at the top and through clamps cassette was closed carefully. After each step, transfer buffer was slowly added so that PVDF membrane, Whatman papers, and fiber pads were kept wet. Cassette was situated into the slots by facing the black plastic support to the positive (+) electrode side and-and red plastic support to the negative (-) electrode side.
The cassettes were placed into the tank slots by considering black sides were looking the same negative electrode side. The transfer buffer was poured into the tank until it reached the 4 gels level of the tank. The tank was closed by lid and power supply connection was provided. The transfer was done at 90 V for 90 minutes at 4 oC.
26
Reagents:
1. Transfer Buffer:
25 mM TrisBase (stock powder FW121.14), 195 mM Glycine (stock powder FW75.07), Methanol (from 100% stock). For 2 L of Transfer Buffer, 6 g of 25 mM TrisBase, 28 g of 195 mM Glycine were dissolved in 1 L of ddH2O. After 400 mL of
100% methanol was added and the volume was completed to 2 L with ddH2O. It was
kept in 4 oC before using.
2. 10 X Tris-Buffered Saline:
25 mM TrisBase and 80 g NaCl were dissolved in 600 mL of ddH2O. pH was
adjusted to 7.6 with 1 N HCl/ NaOH and volume was completed to 1L with ddH2O.
3. Tris-Buffered Saline and Tween 20 (TBS-T):
10X TBS was diluted to 1X TBS and 3 mL of Tween-20 was added by using a Pasteur pipette
4. Blocking Solution: 5% Non-Fat Dry Milk (Stock)
50 mL of TBS and 250 μL of Tween-20 were mixed and 2.5 g milk powder was dissolved in the solution via using vortex.
2.2.11. Primary and Secondary Antibody Incubation
After the transfer finished, the PVDF membrane was taken carefully by using plastic forceps and incubated in the 5% blocking buffer for an hour in room temperature by shaking. Blocking is important because it prohibits non-specific binding of antibodies. After blocking, the membranes were incubated with primary
27
antibodies for 16 hours at 4oC on the shaker in slow motion. Primary antibodies were α-synaptophysin (Abcam, Cambridge, UK: ab32594, 1:20000 dilution), α -PSD-95 (Abcam, Cambridge, UK: ab18258, 1:5000 dilution), α -gephyrin (Santa Cruz Biotechnology, Santa Cruz, CA, USA: sc-6411, 1:1000 dilution) and α-β tubulin (Cell Signaling Technology, Danvers, AM, USA: #2146, 1:5000 dilution), which was the loading control. All antibodies were prepared in 5% milk powder (Blocking Buffer) + TBS-T. After overnight incubation, membranes were washed with TBS-T for five times in order to remove excess, unbound primary antibody. Duration of the washings was determined according to Table 2.6. Antibodies PSD 95- Tubulin – Synaptophysin were prepared as a mixture by mixing antibodies in BSA with respectively 1:5000 / 1:5000 / 1:20000 dilutions. The optimizations of the antibodies showed that the best signal from zebrafish taken from10 μg concentration. In total, 20 μL of the volume of the samples were loaded into the wells in equal volumes. Goat Rabbit IgG H&L (HRP) was used as the secondary body for anti-synaptophysin, anti-PSD-95 and anti-β tubulin.
Secondary antibodies were anti-rabbit (Cell Signaling Technology, Danvers, AM, USA: #7074, 1:2500 dilution) and, for gephyrin, an anti-goat (Abcam, Cambridge, UK: ab97100, 1:10000 dilution). The membranes were incubated with secondary antibodies for 1 hour at room temperature. All antibodies were prepared in 5% milk powder + TBS-T. Duration of the washings was determined according to Table 2.6.
28
Table 2.6 Duration of primary and secondary antibody washings.
2.2.12. Chemiluminescent Detection
Membranes were put on a clean surface and bands of interests were covered with 500 μL of chemiluminescent kit which consists of 2 different buffers, one of which is the Luminol/ Enhancer and other is the Stable Peroxide Buffer. Each one was used in 1:1 ratio system. So for 500 μL of the mixture, the consisted of 250 μL of one buffer and 250 μL of the other buffer, and they were mixed in an Eppendorf. Membranes were incubated for 5 minutes in a dark, light-proof chamber. After the incubation of membranes in the chemiluminescent kit, the chemical was drained off from the membrane by holding one corner of the membrane with a forceps to a paper towel. Membranes then were put on a clean surface and covered with the light-proof chamber and taken to imaging.
2.2.13. Imaging
A Biorad-ChemidocTM MP imaging system which employs image lab software was used in order to image the membranes. In the software, the multichannel program was chosen and exposure duration was set to either ‘faint bands’ for the strong signals or ‘intense bands’ for the weak signals.
2.2.14. Quantification
Band densities were quantified by employing ImageJ program (NIH, Bethesda, MD, USA). Image of the membrane was opened in the ImageJ program and band
Washing Time 1st 2nd 3rd 4th 5th Duration (min) 5 5 10 5 5
29
densities were quantified. Given data were copy-pasted to the Microsoft excel program. Data was normalized by dividing the quantified data of the band of interest to the corresponding tubulin in order to have average intensities and calculate the variations.
2.2.15. Statistical Analysis
Quantified data and body weight data was first grouped and tested for normality and homogeneity with Shapiro-Wilk Test and Levene’s Test, respectively, by employing the SPSS (IBM, Istanbul, Turkey) statistics program was performed. In the cases where assumptions for parametric tests were fulfilled, two-way ANOVAs with the factors of age with two levels (young and old) and treatment groups (CR, RAP, AL) and factors of gender with two levels (male and female) and treatment groups (CR, RAP, AL) and were performed. When results of ANOVA were significant, Bonferroni Test and Tukey HSD Test were performed for further post hoc analysis. The significance level was accepted as p<0.05. Graphs of the data were piloted by using GraphPad Prism (version 4.00 for Windows, GraphPad Software, San Diego CA, USA).
2.3.Results
2.3.1. Body Weight
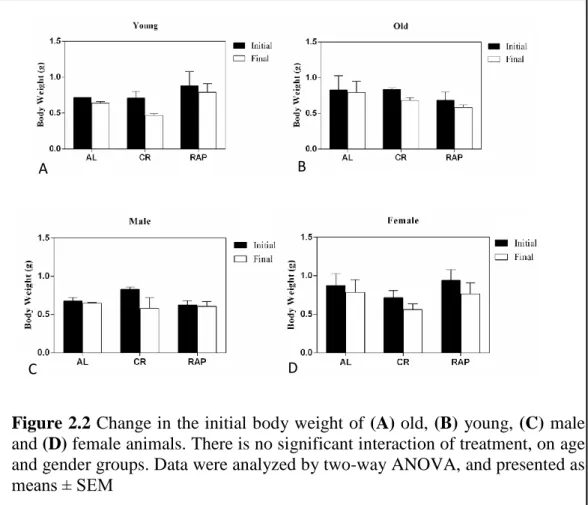
Changes in the initial body weights of animals in four groups are displayed in Figure 2.2. The percentages of the lost weight were calculated by subtracting initial body weight from final body weight and dividing the result to a hundred. Over a period of 4 weeks, ad libitum-fed group (AL) lost 6%, rapamycin-treated group
30
(RAP) lost 10% and caloric restriction group (CR) lost 18% of their initial body weight.
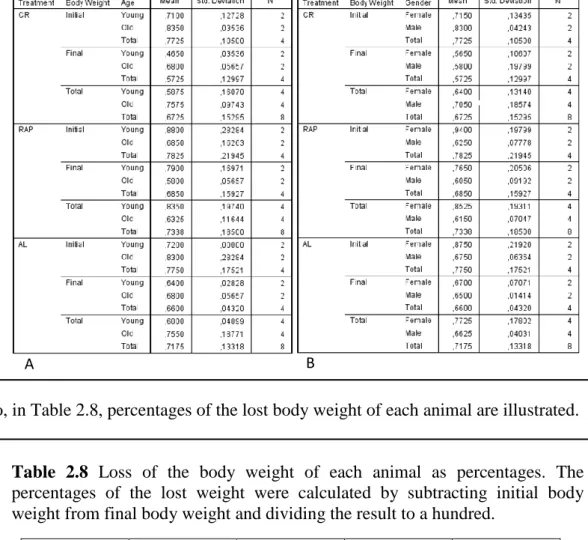
Descriptive statistics of young and old animals based on treatment groups are given in Table 2.7A. For young animals, the average of initial body weight changed from 0.72±0.0 g to 0.64±0.03 g in the AL group, and from 0.88±0.28 g to 0.79±0.16 g in RAP group, and from 0.71±0.13 g to 0.47±0.04 g in CR group. For old animals, the average of initial body weight changed from 0.83±0.28 g to 0.75±0.05 g in AL group, and from 0.68±0.16 g to 0.58±0.05 g in RAP group and from 0.84±0.04 g to 0.68±0.06 g in CR group. Descriptive statistics of male and female animals based on treatment groups are illustrated in Table 2.7B. For males, the initial body weight changed from 0.68±0.06 g to 0.65±0.01 g in AL group, and from 0.63±0.08 g to 0.60±0.09 g in RAP group, and from 0.83±0.04 g to 0.58±0.19 g in CR group. For females, the initial body weight changed from 0.88±0.22 g to 0.77±0.18 g in AL group, and from 0.94±0.20 g to 0.77±0.20 g in RAP group, and from 0.72±0.13 g to 0.57±0.11 g in CR group (Data was stated as mean±std.Deviation).
31
Table 2.7 Descriptive statistics of young and old (A), and male and female (B) animals’ initial and final body weights based on treatment groups.
Also, in Table 2.8, percentages of the lost body weight of each animal are illustrated.
Table 2.8 Loss of the body weight of each animal as percentages. The percentages of the lost weight were calculated by subtracting initial body weight from final body weight and dividing the result to a hundred.
Age Gender CR RAP AL
Young Female 13% 10% 1%
Young Male 28% 10% 6%
Old Female 17% 18% 8%
Old Male 14% 3% 0%
The differences between initial and final body weights as a function of age and gender were tested and illustrated in Figure 2.2. Two-way ANOVAs were conducted firstly to investigate whether different treatment groups or age had a significant effect on the difference between the initial and final body weights then, to investigate
32
whether different treatment groups or gender had a significant effect on the difference between the initial and final body weights. Results indicated that there was no significant main effect of treatments and age on the initial and final body weight (F(2, 12) = 0.396, p=0.682 and (F(1, 12) = 0.059, p=0.812, respectively). Also, there was no interaction of treatment by age on the initial and final body weight of the animals (F(2, 12) = 3.68, p=0.067) (Figure 2.2A and Figure 2.2B). Furthermore, results showed that there was no significant main effect of treatment and gender on the initial and final body weights of the animals (F(2, 12) = 0.433, p=0.658 and (F(1, 12) = 2.859, p=0.117, respectively). Also, no significant interaction of treatment by gender was observed (F(2, 12) = 2.478, p=0.126). The results indicated that the change in the body weights among age and gender groups was not dependent on different treatments.
Figure 2.2 Change in the initial body weight of (A) old, (B) young, (C) male and (D) female animals. There is no significant interaction of treatment, on age and gender groups. Data were analyzed by two-way ANOVA, and presented as means ± SEM
A
C
B
33
2.3.2. Synaptophysin-PSD-95-Tubulin and Gephyrin Expression
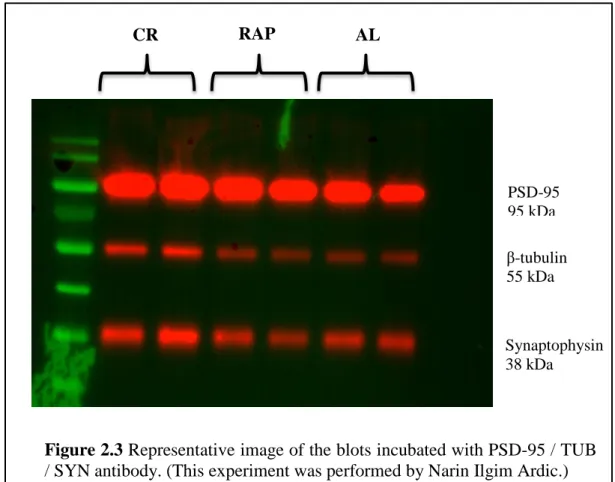
Lysates from CR, RAP and AL treated animal brains were loaded into the gels as shown in Figure 2.3. Figure 2.3 shows the representative image of the western blot results of the relative expression of the key synaptic proteins postsynaptic density protein (PDS-95) and synaptophysin. Tubulin was used as the loading control. A two-way ANOVA was conducted in order to investigate whether different treatment groups had a significant effect on the expression of PSD-95, synaptophysin, and gephyrin.
Figure 2.3 Representative image of the blots incubated with PSD-95 / TUB / SYN antibody. (This experiment was performed by Narin Ilgim Ardic.)
PSD-95 is a postsynaptic scaffold protein its expression was shown to be highest in glutamatergic synapses; it binds scaffold adaptor proteins and facilitates an indirect interaction between scaffold proteins and glutamate receptors, as well as
PSD-95 95 kDa β-tubulin 55 kDa Synaptophysin 38 kDa CR RAP AL
34
other signaling proteins [60]. PSD-95 is expressed in the 95 kDa band on the PVDF membrane. In this study, it was used as postsynaptic marker of excitatory synapses. Relative expression of PSD-95 over three groups in gender and age level is shown in the Figure 2.4.
Relative expression of PSD-95 was calculated by performing a two-way ANOVA. It was found that there was no statistically significant effect of CR and RAP treatments on the expression of PSD-95 in young (F (2, 3) =0.032, p=0.918) and old (F(2,3) =0.071, p=0.933) animals (Figure 2.4A). Also, no significant interaction between AL, CR and RAP treatments and young and old in the expression of PSD-95 (F(2,9)=0.101, p=0.906) was found (Figure 2.4A). Likewise, no statistically significant effect of CR and RAP treatments on the expression of PSD-95 in female (F(2,3)=0.110, p=0.883) and male (F(2,3)=0.016, p=0.984) animals was calculated (Figure 2.4B). In addition, no significant interaction between gender groups and treatment (F(2,9)= 0.002, p=0.99) was found (Figure 2.4B).
Figure 2.4 The relative expression of PSD-95 protein levels across gender, age and treatment groups. (A) The relative expression of PSD-95 in young and old groups across AL, CR and RAP treatments. (B) The relative expression of PSD-95 in male and female animal groups across AL, CR and RAP treatments. There was no significant change in the expression of PSD-95 in male and female, and old and young animals after CR and RAP treatments. Data were analyzed by two-way ANOVA, and presented as means ± SEM