Market Entry Decisions
Effects of Absolute and Relative Confidence
Fergus Bolger
1, Briony D. Pulford
2, and Andrew M. Colman
2 1Bilkent University, Ankara, Turkey,
2University of Leicester, UK
Abstract. In a market entry game, the number of entrants usually approaches game-theoretic equilibrium quickly, but in real-world
markets business start-ups typically exceed market capacity, resulting in chronically high failure rates and suboptimal industry profits. Excessive entry has been attributed to overconfidence arising when expected payoffs depend partly on skill. In an experimental test of this hypothesis, 96 participants played 24 rounds of a market entry game, with expected payoffs dependent partly on skill on half the rounds, after their confidence was manipulated and measured. The results provide direct support for the hypothesis that high levels of confidence are largely responsible for excessive entry, and they suggest that absolute confidence, independent of interpersonal compar-ison, rather than confidence about one’s abilities relative to others, drives excessive entry decisions when skill is involved.
Keywords: overconfidence, market entry game, entrepreneurial behavior, decision making, risk taking, Nash equilibrium
How do entrepreneurs decide whether or not to risk starting up new businesses in a competitive market? In a typical competitive market, more entrants mean less profit for each, and if the number of entrants exceeds the market ca-pacity, then some are bound to suffer net losses and to be forced out of the market.
A market entry game (MEG) is a type of experimental game designed to model market entry decisions. In the standard experimental paradigm, introduced by Kahneman (1988), members of a group make repeated individual de-cisions to enter or to stay out of an idealized competitive market. Players choose simultaneously and anonymously, without communicating with one another, and the only in-formation fed back to them is the number of entrants on each round. The game’s payoff structure reflects funda-mental strategic properties of real-world competitive mar-kets payoffs that diminish as the number of entrants in-creases, net losses for some entrants whenever market ca-pacity is exceeded, and no profits or losses for players who stay out of the market.
In experimental MEGs, the number of entrants converg-es close to Nash equilibrium after a few rounds (Rapoport, 1995; Rapoport, Seale, Erev, & Sundali, 1998; Sundali, Rapoport, & Seale, 1995). In Nash equilibrium, by defini-tion, the number of market entrants is such that none could have done better for themselves by staying out and none who stayed out could have done better by entering. When these conditions are met in a MEG, the aggregate payoff to the players, corresponding to the aggregate industry profit, is maximized. The experimental findings suggest that play-ers somehow learn to behave rationally in this sense, max-imizing their own expected payoffs given the behavior of other players, without communicating with one another. Kahneman (1988) famously commented that, “to a
psy-chologist, it looks like magic” (p. 12). In game-theoretic terms, players choose on each round between entering and staying out by comparing the expected payoffs from these two strategies and choosing the one that yields the greater expected payoff. In order to make such judgments, they have to forecast the number of entrants, and the evidence suggests that their forecasts are remarkably accurate.
In stark contrast to these laboratory findings, studies of real-world market entry decisions indicate that entrepre-neurs do not generally decide rationally. The number of start-ups typically exceeds market capacity by a large mar-gin, resulting in most new businesses failing within a few years (Dunne, Roberts, & Samuelson, 1988; Mata & Por-tugal, 1994; Wagner, 1994). How can this embarrassing in-consistency between laboratory and real-world market en-try behavior be explained?
Camerer and Lovallo (1999) suggested that excessive entry in real-world markets may be explained by the fact that payoffs are contingent partly on skill – a feature lack-ing in the standard MEG. They reported an experiment us-ing a modified MEG in which, on some rounds, entrants’ chances of winning depended partly on skill, as measured by their scores on a general-knowledge quiz, and on other rounds were determined randomly, as in the standard MEG. Their analysis of amounts of money won and lost suggests that excessive entry occurred mainly on skill-based rounds. They explained this in terms of reference group neglect: participants, who self-selected for the experiment on the understanding that payoffs would be related to perfor-mance on a general-knowledge quiz, may have overesti-mated their chances of performing well, neglecting the fact that the other players had also self-selected and were also likely to believe themselves better than average at general-knowledge quizzes.
This suggests that excessive market entry on skill-based rounds of a MEG, and possibly also in real-world markets, may be fuelled by entrants’ overconfidence about their own skill levels. In the literature on subjective probability judg-ment, a distinction may be drawn between two extensively researched phenomena, namely the overconfidence effect (Lichtenstein, Fischhoff, & Phillips, 1982), a tendency to overestimate the probability that one’s own judgments or knowledge are correct, and unrealistic optimism (Wein-stein, 1980), a tendency to believe oneself more likely than others to experience good fortune. In this article, we wish instead to make a new distinction between overestimation of one’s abilities relative to others, which we label relative overconfidence, and overestimation of one’s abilities inde-pendently of interpersonal comparison, which we label ab-solute overconfidence. One of the goals of the experiment described below is to establish the separate contributions of these two types of overconfidence to market entry be-havior. This distinction also has potential relevance to de-cision making in a broad range of other domains, including medical and consumer decisions.
The primary goal, however, is to test Camerer and Lo-vallo’s (1999) hypothesis that overconfidence is responsi-ble for excessive entry on skill-based rounds of a MEG and, by implication, in real-world competitive markets also. Be-cause Camerer and Lovallo did not test this hypothesis di-rectly by manipulating or measuring confidence, we ma-nipulated confidence as an independent variable and mea-sured both relative and absolute confidence as dependent variables. It is intuitive to suppose that absolute confidence will be elevated after answering a set of easy questions and lowered after answering a set of hard questions – there is some evidence supporting this intuition (e.g., Gigerenzer, Hoffrage, & Kleinbölting, 1991; Stankov, 2000). Similarly, with regard to relative confidence, research on the worse-than-average effect has shown that people commonly judge their performance to be better than average on easy tasks but worse than average on hard ones (Hoelzl & Rus-tichini, 2005; Moore & Kim, 2003; Windschitl, Kruger, & Simms, 2003). For these reasons we decided to use task difficulty as a means of manipulating confidence. Further, we used a lifelike MEG with a payoff function that was simpler and easier to understand than those used in previ-ous MEG experiments, while retaining the essential strate-gic properties of the game, and our experimental design included two market capacities.
Method
Participants
The participants were 96 undergraduates (48 men and 48 women) recruited through an online participant panel at the University of Leicester. Their average age was 23.60 years (range 18–73).
Design and Materials
Participants were assigned to 16-player groups before play-ing 24 rounds of a MEG. To increase the comprehension, motivation, and psychological involvement of the players, we presented the MEG as a simulation of 24 opportunities to open restaurants in small or large (fictitious) towns, de-pending on market capacity (eight or four). As detailed be-low, we manipulated three within-subjects independent variables (reward basis, market capacity, and order), and one between-subjects variable designed to influence confi-dence (perceived quiz difficulty).
Reward Basis
Members of each group were ranked on the basis of a quiz administered after the MEG. Whenever market capacity was exceeded, payoffs were calculated by dividing the en-trants into winners and losers either randomly (on 12 ran-dom rounds) or according to their quiz rankings (on 12 skill-based rounds). The quiz consisted of 20 two-alterna-tive, forced-choice (2AFC) questions, each requiring a judgment as to which of two UK listed companies produced more profit in the previous year. The quiz was designed to have higher face validity as a measure of entrepreneurial skill, and hence more potential for manipulating confi-dence in the MEG, than the general-knowledge trivia quiz-zes used in previous research in this area.
Market Capacity and Payoffs
We varied market capacity at two levels, c = 8 and c = 4, corresponding to one-half and one-quarter of the group size respectively. All players participated in 12 rounds with each market capacity. On every round with c or fewer mar-ket entrants, the entrants shared a payoff of £15 (about $30) equally. On every round on which market capacity was ex-ceeded, the entrants were ranked either randomly (on ran-dom rounds) or according to their quiz rankings (on skill-based rounds), then the top c entrants shared £15 equally, and each of the entrants outside the top c ranks lost £5. With c = 8, Nash equilibrium occurs when 10 or 11 players enter, and with c = 4, when six or seven enter. As an example, if market capacity is eight and 10 players enter, then an en-trant has a 8/10 probability of receiving a 1/8 share of the £15 payoff, because there are always eight winners, and a 2/10 probability of losing £5, hence the expected payoff is (8/10)(£15/8) + (2/10)(–£5) = £0.50. This means that an entrant could not have done better by staying out, nor could a player who stayed out have done better by entering, be-cause the number of entrants would then be 11 and an en-trant’s expected payoff would be (8/11)(£15/8) + (3/11) (–£5) = £0.00; but with fewer than 10 entrants, a player who stayed out could have received a positive payoff by entering, and with more than 11 entrants, a player who
en-tered could have avoided expected loss by staying out. A formal specification of the payoff function and full equilib-rium analysis is provided in the Appendix.
Order
For simplicity and transparency, and to help the players to focus on the relevant reward basis and market capacity while making their decisions, we blocked rounds with the same reward basis and market capacity rather than random-izing these variables. Thus, some participants played six random rounds with market capacity c = 8 first, then six random rounds with c = 4, and so on, enabling possible order effects to be checked statistically.
Perceived Quiz Difficulty
This was the between-subjects independent variable in-tended to manipulate participants’ confidence before they played the MEG. We showed participants five examples of the type of questions they could expect in the main quiz that would determine their rankings and therefore their chances of winning whenever they entered the market. We assigned each 16-player group randomly to a treatment condition in which these example questions were either hard or easy. The hard or easy example questions were those that had elicited the lowest or highest confidence rat-ings respectively from 18 participants in a pilot study of 60 candidate questions that we carried out before the experi-ment. The main quiz – the same for all participants – con-sisted of 20 questions of moderate difficulty.
Procedure
Each group of 16 players sat in rows facing the experiment-ers. They first read a set of general instructions that the experimenters also summarized orally. They then answered the five hard or easy example questions and, to provide measures of confidence, they made the following pair of forecasts, designed to measure absolute and relative confi-dence respectively:
– How many of the 20 very similar questions in the real quiz do you expect to get right?
– Out of the group who will be taking the quiz this session,
how do you think you will be ranked (first, second, third, etc., where first means you get the most right in the group)?
Players were told that they would be paid at the end of the session the average of the money that they earned across all 24 rounds of the MEG. They were shown a payoff scheme specifying the gains and losses for different num-bers of market entrants. As an illustration, the payoff scheme for c = 8 is shown in Table 1.
The experimenters announced the market capacity be-fore each block of six rounds and reminded the group of the payoff basis (skill or random) before every round. The players were given specific written instructions for each round, a typical example being: “There are 16 people think-ing of settthink-ing up a business in Wincanton, which bethink-ing a larger town can support eight restaurants. Only the best eight restaurants will make a profit, and all others that set up will lose money.”
On each round, players indicated on their answer sheets their decisions to enter or to stay out and their forecasts of how many in the group (including themselves) would enter. To enable the experimenters to count and announce the number of entrants on each round, players also raised ba-tons displaying the word Yes or No. Because they sat in rows facing the experimenters, they could not see the faces of one another’s batons. After 24 rounds, players answered the quiz questions. Rankings and payments were then com-puted, and participants were paid off and debriefed.
Results
Equilibrium Behavior
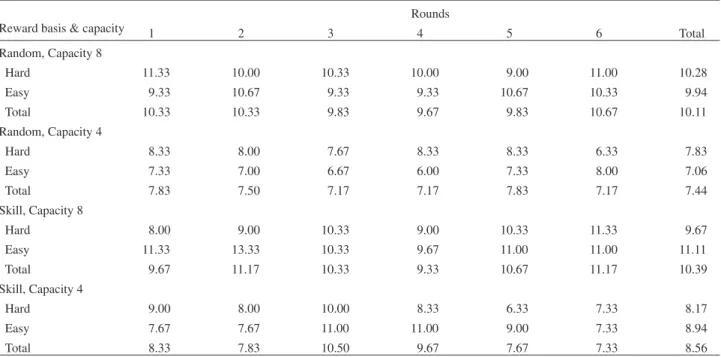
Table 2 shows the mean numbers of entrants per round (range 0 to 16) as a function of market capacity (c = 8 and c = 4), reward basis (skill or random), and perceived quiz difficulty (hard or easy example questions). Entry frequen-cies averaged across rounds of the same reward basis and market capacity are depicted in Figure 1.
For market capacity eight, numbers of entrants per round were at or marginally below Nash equilibrium (10 or 11) for three of the four treatment combinations (Ms = 10.28 and 9.94 on random rounds with hard and easy example questions and 9.67 on skill-based rounds with hard exam-ples) and slightly above equilibrium (M = 11.11) for one Table 1. Payoff scheme shown to players in treatment conditions with market capacity one-half (c = 8)
Rankings on the next six rounds are random; market capacity = 1/2 (8 restaurants). If you stay out you will win/lose nothing. If you enter on a round and are ranked in the top 8 then your payoff this round will be as follows:
Number entering (including yourself) 1 enters 2 enter 3 enter 4 enter 5 enter 6 enter 7 enter 8 enter
Amount you win £15.00 £7.50 £5.00 £3.75 £3.00 £2.50 £2.14 £1.87
In other words, up to the market capacity, all entrants will share the £15 winnings equally. If there are more entrants than the market capacity (i.e., 9 or more) then only the top 8 ranked entrants will win money – they will share the £15 between them (so will get £1.87 each) – all other
treatment combination, namely skill-based rounds with easy questions. We conducted a split-plot ANOVA on entry frequency for each of the six groups, averaged across rounds of the same reward basis, for market capacity eight only – this had one within-subjects factor, reward basis, with two levels, and one between-subjects factor, perceived quiz difficulty, also with two levels. Main effects are non-significant, and the interaction Perceived Quiz Difficulty × Reward Basis is marginally significant: F(1, 4) = 4.66. p = .097, partialη2= .54.
For market capacity four (Nash equilibrium six or sev-en), the number of entrants was close to equilibrium only on random rounds with easy examples (M = 7.06). Entry
was excessive on random rounds with hard examples (M = 7.83), skill-based rounds with hard examples (M = 8.17), and especially skill-based rounds with easy examples (M = 8.94). We performed another split-plot ANOVA, identical to the previous one but for entry when market capacity was four. The effect of reward basis is large and significant, F(1, 4) = 29.09, p = .006, partialη2
= .88, and so is the interaction Perceived Quiz Difficulty × Reward Basis: F(1, 4) = 14.26. p = .020, partialη2= .78. Both of these effect sizes are large (Cohen, 1988).
The most striking feature of Figure 1 is the comparative-ly greater entry frequency on skill-based than random rounds with easy examples than other treatment combina-Table 2. Mean number of market entrants per round for market capacities 8 versus 4, hard versus easy example questions,
on skill-based and random reward rounds Reward basis & capacity
Rounds 1 2 3 4 5 6 Total Random, Capacity 8 Hard 11.33 10.00 10.33 10.00 9.00 11.00 10.28 Easy 9.33 10.67 9.33 9.33 10.67 10.33 9.94 Total 10.33 10.33 9.83 9.67 9.83 10.67 10.11 Random, Capacity 4 Hard 8.33 8.00 7.67 8.33 8.33 6.33 7.83 Easy 7.33 7.00 6.67 6.00 7.33 8.00 7.06 Total 7.83 7.50 7.17 7.17 7.83 7.17 7.44 Skill, Capacity 8 Hard 8.00 9.00 10.33 9.00 10.33 11.33 9.67 Easy 11.33 13.33 10.33 9.67 11.00 11.00 11.11 Total 9.67 11.17 10.33 9.33 10.67 11.17 10.39 Skill, Capacity 4 Hard 9.00 8.00 10.00 8.33 6.33 7.33 8.17 Easy 7.67 7.67 11.00 11.00 9.00 7.33 8.94 Total 8.33 7.83 10.50 9.67 7.67 7.33 8.56 6.50 7.50 8.50 9.50 10.50 11.50 Random Skill Reward Basis Entrants Pe r Round
(Means) Hard, Capacity 8
Easy, Capacity 8 Hard, Capacity 4 Easy, Capacity 4
Figure 1. Mean numbers of entrants per round as a function of reward basis (random or skill) and perceived quiz difficulty (hard or easy example ques-tions) for market capacities c = 8 and c = 4.
tions. For both market capacities, more players entered on skill-based rounds with easy example questions than in any other treatment combination. It is also clear that excessive entry, relative to market capacity, was more frequent when market capacity was small. Mean excess entries – entries in excess of market capacity, expressed as percentages – were 99.31% when c = 4 compared with 27.95% when c = 8: F(1, 4) = 296.80, p < .001, partialη2= .99 (large).
Order
Order of rounds with different reward bases and market capacities had no significant effects on market entry or con-fidence ratings, nor did it contribute to any significant in-teractions with other variables, and we therefore omitted it from subsequent analyses.
Confidence
Mean forecasts of performance on the main quiz, converted to percentages, were 51.90% (SD = 15.87%) for partici-pants given hard examples and 67.40% (SD = 14.77%) for those given easy examples, showing significantly greater absolute confidence in the latter group, t(94) = 4.96, p < .001, with a large effect size (Cohen, 1988) of d = 0.90. Forecasted quiz rankings were also higher in the easy-ex-ample group (M = 6.65, SD = 3.06) than the hard-exeasy-ex-ample group (M = 8.77, SD = 3.74), showing significantly higher relative confidence in the easy-examples group, t(94) = 3.05, p < .01, effect size d = 0.60 (medium).
Effects of Confidence on Market Entry
We used Camerer and Lovallo’s (1999) technique of mea-suring the difference between entry on skill-based rounds and random rounds, to provide a within-subjects control for risk preferences and other individual differences that are uncontrolled when skill and random rounds are analyzed separately. This difference score, ranging from –12 to +12, was then entered into a multiple regression as the criterion variable in order to examine the contributions of absolute and relative confidence to market entry. The range of pos-sible responses differed between the two predictors (0–20 for absolute confidence and 1–16 for relative confidence).
The standard deviations of the two measures are almost identical (3.43 for absolute confidence and 3.56 for relative confidence), however, to eliminate all possibility of the range difference causing spurious effects, we standardized the variables prior to the regression analysis. The results of the regression are shown in Table 3. As can be seen, a sig-nificant model was produced, R2 = .074 (adjusted R2 = .054), and the only significant predictor variable was abso-lute confidence:β = .269, t(94) = 2.06, p = .042. Thus, higher confidence in one’s future performance predicted greater entry frequency when skill was involved compared with when no skill was involved, in line with our expecta-tions, and it was only absolute confidence that was signif-icantly predictive of entry frequency.
Separate analysis of skill-based and random rounds yielded similar results. On skill-based rounds, a regression analysis produced an R2value of .115 (adjusted R2= .105). The only significant coefficient was the forecasted number, measured before the main quiz, of questions correct on the quiz:β = .339, t(94) = 3.47, p = .001. On random rounds, regression did not produce a significant model. Thus, ab-solute confidence predicted entry frequency on skill-based but not random rounds, in line with our expectations.
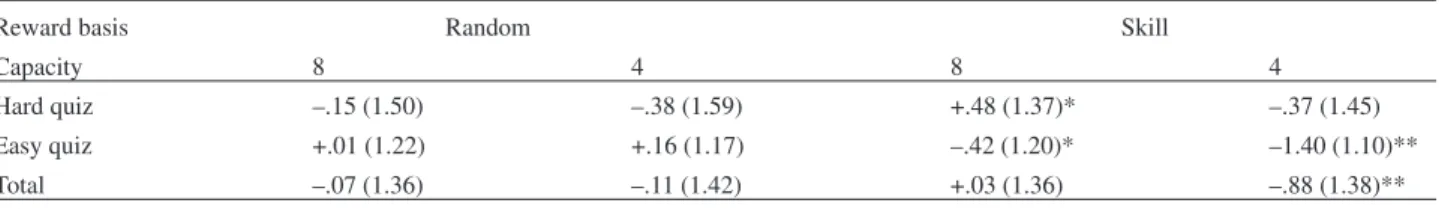
Forecasts and Entry Decisions
Players’ entry decisions correlated negatively with their forecasts of the numbers of entrants in the majority (21 out of 24) of rounds, 14 of these correlations attaining signifi-cance at p < .05, and none of the three positive correlations approached significance. In line with straightforward stra-tegic thinking, players entered more frequently when they forecasted fewer other entrants. Mean forecast errors were less than a half an entrant either way except for in the ex-perimental condition with easy examples, a market capac-ity of four, and a skill-based reward – here the participants underestimated the number of entrants by 1.40 on average, and this was significantly different from zero (see Table 4). Table 3. Regression model predicting differences in entry between rounds with skill or random reward bases
Independent variable B t p
Absolute confidence .269 2.06 .042
Relative confidence –.003 –.03 .980
R2 .074 .028
Table 4. Mean error in forecasting number of entrants by experimental condition (SD in parentheses)
Reward basis Random Skill
Capacity 8 4 8 4
Hard quiz –.15 (1.50) –.38 (1.59) +.48 (1.37)* –.37 (1.45)
Easy quiz +.01 (1.22) +.16 (1.17) –.42 (1.20)* –1.40 (1.10)**
Total –.07 (1.36) –.11 (1.42) +.03 (1.36) –.88 (1.38)**
Discussion
Why does excessive market entry typically occur in real-world markets, causing a majority of new companies to fail within a few years? And why, in light of this excessive entry in real-world markets, does entry behavior in MEGs tend to converge close to Nash equilibrium after a few rounds? Our results support Camerer and Lovallo’s (1999) hypothesis that overconfidence causes excessive market entry when success depends partly on skill. In line with previous research on market entry games, we found entry levels close to Nash equilibrium on rounds in which skill played no part in determining which entrants would be win-ners, and excessive entry chiefly on skill-based rounds when players’ confidence had been boosted with easy ex-amples of quiz questions that would be used to measure their skill. These findings provide direct corroboration of Camerer and Lovallo’s hypothesis, because we manipulat-ed and measurmanipulat-ed confidence – our manipulation shiftmanipulat-ed confidence significantly in the expected direction, increas-ing confidence of the participants given easy example ques-tions relative to those given hard examples – and because market entry decisions turned out to be generally more fre-quent when confidence was high. Moore and Cain (2007) have reported a similar effect. In their study, a difficult task tended to result in under-entry in skill-based rounds relative to random rounds of a MEG, whereas an easy task gener-ally led to over-entry.
By distinguishing carefully between absolute and rela-tive confidence, our results clarify the nature of the over-confidence effect on market entry behavior. We measured both absolute confidence (estimation of one’s abilities in-dependently of interpersonal comparison) and relative con-fidence (estimation of one’s abilities relative to others). Our measures of absolute and relative confidence were quite strongly correlated (r = .65), each accounting for about 40 per cent of the variance in the other, but only absolute con-fidence (and not relative concon-fidence) was significantly pre-dictive of more frequent entry on skill-based than random rounds of the MEG. We conclude from this that it is high levels of absolute confidence that drives excessive market entry. This implies that excessive entry on skill-based rounds, and perhaps also excessive entry in real-world mar-kets, does not arise from simple ignorance of the competi-tion or the competitive environment but from intrinsic con-fidence that is likely to be impervious to information about competitors.
The finding that excessive entry occurred significantly more frequently in markets with small than large market capacities tends to confirm this neglect of information about competitors. With group size constant, as it was throughout the experiment, market entry was more likely to result in loss when market capacity was small, because in those circumstances it required only a small number of other players to decide to enter for market capacity to be exceeded. The significantly greater frequency of excessive
entry when there was a small market capacity suggests that players with high absolute confidence did not discount suf-ficiently for the small capacity when judging their chances of success. This phenomenon has potential significance for decision making in other situations in which confidence influences risk taking, including a broad range of econom-ic, political, and personal decisions.
Moore and Cain (2007) found a stronger influence of rel-ative confidence than absolute confidence on market entry, in contrast to our findings. There are several differences be-tween the two experiments, in terms of method, measures and analysis, that could account for this discrepancy. First, Moore and Cain administered a mini-quiz between each MEG round and presented feedback about the performance of each group member on a blackboard before the subsequent MEG round, and this is likely to have focused participants’ attention on their performance relative to others in the group. Second, Moore and Cain used groups of seven players, whereas our groups were more than twice the size, and smaller group size facilitates relative comparisons. Third, we did not measure relative and absolute confidence in the same way as Moore and Cain. Fourth and most important, Moore and Cain used individual entry decisions as the units of analysis in their regression analyses, whereas we used decision makers as the units of analysis. Moore and Cain’s data therefore pertain to decisions, whereas ours pertain to decision makers. We be-lieve that our measures and analyses reflect real-world mar-ket entry more closely, because entrepreneurs do not usually receive immediate, precise, and reliable feedback about their performance relative to competitors, and because larger group sizes are more representative of most real-world mar-kets, but further research is needed to determine the precise conditions under which market entry is driven by relative or absolute confidence (or both).
It is worth commenting finally on important differences between entry behavior in experimental and real-world markets. In MEG experiments, unlike most real-world mar-kets, the number of potential entrants is held constant. This naturally limits the role of competitive blind spots proposed by Zajac and Bazerman (1991). Many disastrous real-world entry decisions occur because firms fail to anticipate potential entrants. The discrepancy between behavior ob-served in the real world and standard laboratory MEGs can also be explained by a judgmental bias that causes some people in real-world situations to be egocentrically over-confident about their own abilities. This has obvious prac-tical implications for entrepreneurs and managers, who need to consider the potential strengths and weaknesses of their businesses relative to those of their competitors before deciding to enter a market. Our findings suggest that they should be especially wary when markets have small capac-ity or seem to present easy business opportunities, or both, because over-entry seems most likely in such circumstanc-es. Our findings are also theoretically important because of their evident relevance to the debate about human rational-ity, a debate that is particularly intense in relation to the psychology of economic behavior.
Acknowledgments
The authors are grateful to Clare Davies for assistance with the recruitment of participants and data collection, and wish to thank Philipp Köllinger, Daniel Lovallo, and Don Moore for their comments on an earlier draft of this paper. The research reported in this article was funded by research grant RES-000–23–0154 from the Economic and Social Research Council of the UK.
References
Camerer, C., & Lovallo, D. (1999). Overconfidence and excess entry: An experimental approach. American Economic Review,
89, 306–318.
Cohen, J. (1988). Statistical power analysis for the behavioral
sciences (2nd ed.). Hillsdale, NJ: Erlbaum.
Dunne, T., Roberts, M.J., & Samuleson, L. (1988). Patterns of firm entry and exit in U.S. manufacturing industries. Rand
Journal of Economics, 19, 495–515.
Gigerenzer, G., Hoffrage, U., & Kleinbolting, H. (1991). Proba-bilistic mental models – a Brunswikian theory of confidence.
Psychological Review, 98, 506–528.
Hoelzl, E., & Rustichini, A. (2005). Overconfident: Do you put your money on it? Economic Journal, 115, 305–318. Kahneman, D. (1988). Experimental economics: A psychological
perspective. In R. Tietz, W. Albers, & R. Selten (Eds.),
Exper-imental games and markets (pp. 11–18). Berlin: Springer.
Lichtenstein, S., Fischhoff, B., & Phillips, L.D. (1982). Calibra-tion of probabilities: The state of the art to 1980. In D. Kah-neman, P. Slovic, & A. Tversky (Eds.), Judgment under
un-certainty: Heuristics and biases (pp. 306–334). Cambridge:
Cambridge University Press.
Mata, J., & Portugal, P. (1994). Life duration of new firms.
Jour-nal of Industrial Economics, 42, 227–245.
Moore, D.A., & Cain, D.M. (2007). Overconfidence and under-confidence: When and why people underestimate (and overes-timate) the competition. Organizational Behavior and Human
Decision Processes, 103, 197–213.
Moore, D.A., & Kim, T.G. (2003). Myopic social prediction and the solo comparison effect. Journal of Personality and Social
Psychology, 85, 1121–1135.
Rapoport, A. (1995). Individual strategies in a market-entry game.
Group Decision and Negotiation, 4, 117–133.
Rapoport, A., Seale, D.A., Erev, I, & Sundali, J.A. (1998). Equi-librium play in large group market entry games. Management
Science, 44, 129–141.
Stankov, L. (2000). Complexity, metacognition, and fluid intelli-gence. Intelligence, 28, 121–143.
Sundali, J., Rapoport, A., & Seale, D.A. (1995). Coordination in market entry games with symmetric players. Organizational
Behavior and Human Decision Processes, 64, 203–218.
Wagner, J. (1994). The post-entry performance of new small firms in German manufacturing industries. Journal of Industrial
Economics, 42, 141–154.
Weinstein, N.D. (1980). Unrealistic optimism about future life events. Journal of Personality and Social Psychology, 39, 806–820.
Windschitl, P.D., Kruger, J., & Simms, E.N. (2003). The influence of egocentrism and focalism on people’s optimism in compe-titions: When what affects us equally affects me more. Journal
of Personality and Social Psychology, 85, 389–408.
Zajac, E.J., & Bazerman, M.H. (1991). Blind spots in industry and competitor analysis: Implications of interfirm (mis)per-ceptions for strategic decisions. Academy Management
Re-view, 16, 37–56.
Received July 11, 2006
Revision received January 4, 2007 Accepted March 12, 2007 Fergus Bolger Department of Psychology Bilkent University 06800 Bilkent Ankara Turkey E-mail [email protected]
Appendix
Payoff Function and Equilibrium Analysis
Groups of exactly 16 participants played 24 rounds of a market entry game. Players knew the market capacity c on each round (c = 8 or c = 4) and were ranked from r = 1 to 16 but did not know their rankings. Each player decided on each round whether to enter the market, with a chance of earning a share of the fixed industry profit V and an asso-ciated risk of suffering a fixed loss f, or to stay out of the market.
To clarify the payoff function, three cases need to be considered. First, a decision to stay out on a particular round yields a payoff of zero. Second, whenever the num-ber of entrants k on a particular round is strictly less than c, a constant industry profit V is split equally among the k entrants, and the payoff to each of the 16 – k nonentrants is zero. Third, whenever k is equal to or greater than c, entrants’ payoffs are determined by players’ rankings. In this case, every entrant ranked r≤ c receives an equal share of the industry profit V, every entrant ranked r > c receives a payoff of –f (suffers a loss of f), and every nonentrant receives a payoff of zero. In this model, V and f are con-stants.
Formally, we denote Player i’s strategy by si(0 = stay out, 1 = enter) and the (expected) payoff Piresulting from Player i’s decision by
Pi= ⎛ ⎜ ⎝ ⎜ ⎜ ⎜ ⎜ 0, if si= 0 V k, if si= 1 and k < c V c ⋅ c k− f ⋅ k− c k , if si= 1 and k ≥ c
If the vector of strategies of all players other than i are written s–i, then the strategy profile s = (si, s–i) comprising one strategy chosen by each player is in Nash equilibrium by definition if every player’s strategy is a best reply to the other players’ strategies. Formally, s = (si, s–i) is a Nash equilibrium if and only if
Pi(si, s−i) ≥ Pi(si′, s−i) ∀ si′, ∀i.
It is clear that every strategy profile with k < c is out of equilibrium, because a player who stays out and receives a payoff of zero could have entered and received a payoff of V/k > 0, hence the strategy of staying out is not a best reply to the other players’ strategies. Nash equilibrium occurs when k≥ c and the following two conditions are satisfied: Pi(1, s–i)≥ 0, so that an entrant could not have done better
by staying out; and for k + 1, Pi(1, s–i)≤ 0, so that a player who stayed out could have done better by entering. For the first condition, k≥ c and Pi(1, s–i)≥ 0, we have
V c⋅ c k− f ⋅ k− c k ≥ 0, V k− f + fc k ≥ 0, k≤V f + c
For the second condition, replacing k with k + 1 and revers-ing the inequality, we find that that Pi(1, s–i)≤ 0 implies k ≥ (V/f) + c – 1. Therefore, Nash equilibrium occurs when V
f + c − 1 ≤ k ≤ V
f + c.
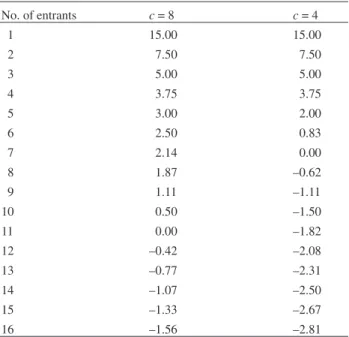
In our experiment, V = 15 and f = 5 were constants, and we set c = 8 on some rounds and c = 4 on others. With c = 8, equilibrium occurs when 10≤ k ≤ 11. With c = 4, equilib-rium occurs when 6≤ k ≤ 7. Nash equilibrium therefore occurs with 10 or 11 entrants for market capacity 8 and with 6 or 7 entrants for market capacity 4. The complete payoff functions of market entrants for both market capacities are shown in Table A1.
Table A1. Payoff functions of entrants for two market capacities No. of entrants c = 8 c = 4 1 15.00 15.00 2 7.50 7.50 3 5.00 5.00 4 3.75 3.75 5 3.00 2.00 6 2.50 0.83 7 2.14 0.00 8 1.87 –0.62 9 1.11 –1.11 10 0.50 –1.50 11 0.00 –1.82 12 –0.42 –2.08 13 –0.77 –2.31 14 –1.07 –2.50 15 –1.33 –2.67 16 –1.56 –2.81