FOR TRANSPORTATION OF HAZARDOUS
MATERIALS FROM DIFFERENT PERSPECTIVES
A THESIS
SUBMITTED TO THE DEPARTMENT OF INDUSTRIAL ENGINEERING
AND THE INSTITUTE OF ENGINEERING AND SCIENCES OF BILKENT UNIVERSITY
IN PARTIAL FULFILLMENT OF THE REQUIREMENTS FOR THE DEGREE OF
MASTER OF SCIENCE
by Hakan Ümit September 2002
Asst. Prof. Bahar Y. Kara (Principal Advisor)
I certify that I have read this thesis and that in my opinion it is fully adequate, in scope and in quality, as a thesis for the degree of Master of Science.
Prof. Barbaros Ç. Tansel
I certify that I have read this thesis and that in my opinion it is fully adequate, in scope and in quality, as a thesis for the degree of Master of Science.
Assoc. Prof. Osman Oguz
Approved for the Institute of Engineering and Sciences:
Prof. Mehmet Baray
A GIS BASED ANALYSIS FOR TRANSPORTATION OF HAZARDOUS MATERIALS FROM DIFFERENT PERSPECTIVES
Hakan Ümit
M.S. in Industrial Engineering Supervisor: Assist. Prof. Bahar Y. Kara
September 2002
Transportation of hazardous materials (hazmats) has been calling attention of regulators, hazmat carriers, environmentalist groups and academia for many years. In the hazmat literature, there exists two different hazmat transportation problems for two important decision maker groups. The problem of the first group, namely the regulators, is to minimize the ‘risk’ that is generated by the hazmat carriers. The problem of the second group, namely the hazmat carriers, is to select the routes that minimize their transportation costs. However, there exists another group of Decision Maker that needs to satisfy both of the objectives (transportation ‘risk’ and costs), which in most cases conflict mutually.
In this study, we propose solutions to the hazmat transportation problem from both government’s and a hazmat producer and supplier firm’s point of view. We also introduce a new decision-maker type that has been neglected in the hazmat literature.
Keywords: Transportation of Hazardous Materials, Geographical Information
FARKLI BAKIS AÇILARINDAN TEHLIKELI MADDE TASIMACILIGI IÇIN COGRAFI BILGI SISTEMLERI TABANLI
BIR ANALIZ
Hakan Ümit
Endüstri Mühendisligi Yüksek Lisans Tez Yöneticisi: Assist. Prof. Bahar Y. Kara
Eylül 2002
Tehlikeli madde tasimaciligi yillardir resmi otorite, tehlikeli madde tasiyici firmalar, çevreci gruplar ve bilim çevrelerinin dikkatini önemli ölçüde çeken bir konu olmustur. Tehlikeli madde tasimaciligi literatüründe iki önemli karar verici grubun iki ayri problemi yer almaktadir. Birinci grup yani resmi otoritelerin problemi tehlikeli madde tasiyanlarin çevreye karsi yarattigi ‘risk’i enazlamaktir. Ýkinci grup yani, tasiyici firmalarin problemi ise kendi tasima maliyetlerini enazlayan güzergahlari seçmektir. Ancak literatürde yer almayan ve çogunlukla birbiriyle çelisen bu iki amaca (tasima ‘risk’ ve maliyetleri) sahip olan baska bir karar verici grup da bulunmaktadir.
Bu çalismada hükümet ve tehlikeli madde üretici bir firmanin tehlikeli madde tasimaciligi problemine çözümler önerilmektedir. Ayrica çalismada, literatürde simdiye kadar ihmal edilmis yeni bir karar verici grup tanitilmaktadir.
I would like to express my sincere gratitude to Asst. Prof. Bahar Yetis Kara, first of all, for allowing me to do this study, and second of all, for her everlasting guidance as a supervisor, her patience, comments and encouragement throughout this thesis. I consider myself fortunate to have worked with Dr. Yetis since I gained the flavor of doing research with her.
I wish to express my thanks to Prof. Barbaros Tansel and Assoc. Prof. Osman Oguz for accepting to read and review my thesis. Their comments and recommendations have been in invaluable.
I am indebted to Dr. H. A. Eiselt for his keen interest, remarks and recommendations on this research. I would also like to thank Recai Düz, Road Transport Manager of Shell Turkey, and Ömer Çalikli for the data they provided, and for their interests on this study.
I am grateful to my mother, my father, my sister and my lovely niece Sevval for their love and support at all stages of my life and especially during my study in Ankara - I owe them so much.
My special thanks to John Potter, my mentor and my best friend, who definitely contributed my personal development and opened new horizons in my life. I would also like to thank Utku Macit, Ayten Türkcan, Banu Yüksel and Pinar Tan for their friendship.
Finally, I am indeed grateful to Behiye Çetin for her love, understanding, morale support and her patience since I met her.
1 INTRODUCTION ...1
2 HAZARDOUS MATERIALS TRANSPORTATION IN TURKEY...3
2.1 Petroleum Refineries in Turkey...5
2.2 Hazmat Accidents in Turkey...6
3 STATE-OF-THE-ART IN HAZMAT TRANSPORTATION ...10
3.1 Definitions of Risk in the Hazmat Literature...11
3.2 Routing Models in the Hazmat Literature ...16
3.3 Different Recent Approaches in the Hazmat Literature...20
3.4 Decision Maker Structures in the Hazmat Literature...22
4 PROBLEM DEFINITION ...24 4.1 Company Structure...24 4.2 The Problem...28 5 SOLUTION METHODOLOGY...31 5.2 Implementation...34 5.3 Computational Results ...36
5.4 Use of Black Spots...42
6.2 Our Approach...50
6.2.1 First Approach: The Union of MinRisk Paths...50
6.2.2 Second Approach ...55
6.2.3 A Greedy Approach...58
7 CONCLUSION ...65
BIBLIOGRAPHY...68
APPENDIX ...71
A COMPUTATIONAL RESULTS FOR VARIOUS WEIGHTED COMBINATIONS...72
B TRADE-OFF CURVE ...76
3-1: Population Exposure of a Single Truck at Point c on Link (i,j) ... 13
3-2: Population Exposure of a Single Truck on Link (i,j) ... 14
4-1: Supply Points of Shell in Turkey... 25
5-1: Aliaga-Çanakkale Shipment... 37
6-1: Hazardous Network Design Problem... 46
6-2: MinRisk and MinLength Paths over the Network G ... 55
6-3: Total Risk Results for 40 iterations ... 61
B-1: Trade-off Curve... 77
C-1: Kirikkale-Mugla Shipment... 79
C-2: Aliaga-Denizli Shipment ... 80
2-1: Annual Amount of Refined Crude Oil in Turkish Refineries ... 5
2-2a: Road Traffic and Accident Data Comparisons for Various Countries ... 7
2-2b: Key to Table 2-2a... 7
4-1: Supply Points of Shell ... 27
5-1: Demand Distributed to Different Supply Points (2001)... 35
5-2: Minimum Risk, Minimum Length and %50Risk-%50Length Results ... 38
5-3: Weighted Combination Results ... 40
5-4: Achievement and Trade-off Results per Truck... 42
6-1a: Comparison of Total Path Risk Results for the First Approach... 51
6-1b: Comparison of Total Path Length Results for the First Approach... 51
6-2: Total Path Length and Risk Results for the 11-arc Closed Network... 53
6-3a: Comparison of Total Path Risk Results for the Second Approach... 56
6-3b: Comparison of Total Path Length Results for the Second Approach... 56
6-4: Total Path Length and Risk Results for the Corrected Network of the Second Approach ... 57
6-5: Iteration results for the Greedy Approach... 59
6-8: Results of the 21-arc Closed Network ... 63
A-1: Minimum Risk and Minimum Length Results ... 73
A-2: %75Risk-%25Length and %25Risk-%75Length Results ... 73
A-3: %90Risk-%10Length and %10Risk-%90Length Results ... 74
A-4: %80Risk-%20Length and %20Risk-%80Length Results ... 74
A-5: %70Risk-%30Length and %30Risk-%70Length Results ... 75
INTRODUCTION
In today’s world, one of the most fundamental needs to provide the quality of our lives is hazardous materials. Hazmats, or dangerous goods, include explosives, gases, flammable liquids and solids, oxidizing substances, poisonous and infectious substances, radioactive materials, corrosive substances and hazardous wastes. Hazardous materials are processed in petroleum refineries, chemical processing plants and nuclear power plants. Furthermore, the transportation of hazmats from industrial facilities to the consumers or other facilities has been very common. Dangerous goods can be extremely harmful to the environment and to the human health, since exposure to their toxic chemical ingredients may lead to injury or death of plants, animals and humans.
It is estimated that over 40 million tons of hazardous materials are consumed and circulated annually in Turkey. This poses a great risk over the society and the environment as we infer from previous hazmat transportation accidents that have occurred in Turkey as well as in many other countries in the world. Therefore, hazmat transportation problem has become a very delicate issue, by the strict influences and requirements of the regulators (governments), environmentalists, public and the media. Moreover, we see that the problem has been a matter of responsibility for many hazmat producers, suppliers and carriers in the recent years.
Hazmat logistics has been a very active area of research: Transportation Science devoted an issue to hazmat logistics in 1991 and Transportation Research Record published two special issues in 1988 and 1989. The major concerns in hazmat logistics are the risks associated with them, the spatial distribution of risks, and the costs incurred during the management process.
In this study, we bring solutions to hazmat transportation problem, both from a government’s and a hazmat supplier’s point of view, specific to Turkey. We focus on petroleum products, as they constitute a major position of the hazmat transportation in Turkey.
In the next chapter, we give the status of hazmat transportation in Turkey. Hazmat transport regulations, the magnitude of the petroleum products and previous hazmat accidents in Turkey are the main topics of this chapter. In Chapter 3, we present the state-of-the-art literature in hazmat transportation. We give a brief summary of the previous studies in four sections for convenience including the explanation of the risk definitions that were used in the previous models. Chapter 4 consists of the definition of the problem in this study. We present the structure of the problem with all parameters, and state the problem in detail within Chapter 4. In Chapter 5, we present the solution methodology that we employ to solve the problem. Then we discuss our computational results in the remainder of this chapter. In Chapter 6 we approach the hazmat transportation problem from a completely different point of view. We propose solutions to “Hazardous Network Design Problem” by making use of three heuristics we developed. Finally, we discuss the results of all heuristics at the end of Chapter 6. To give a brief summary of our study, we present our conclusions, contributions and future research directions in Chapter 7.
HAZARDOUS MATERIALS TRANSPORTATION IN TURKEY
Turkey, as a developing country, is on her way to become an industrialized country for many years. As a natural result, the use of hazardous materials has been a priority not only because of the requirements of industrialization but also because of the lifestyle we pursue in our daily life.
Among hundreds of hazmat types, over 28 million tons of petroleum products, which can be considered as hazardous materials, are consumed and circulated in the country every year. Expert ideas from State Statistics Institute certify that hazardous petroleum products such as; Refinery fuel gas, LPG, naphtha, gasoline, jet fuel, solvent, diesel oil, asphalt and fuel oil constitute the majority (above %80) of total hazardous materials in Turkey. As the magnitude of petroleum products in Turkey is significant enough to incorporate in a study, we focus on petroleum products, which can be considered as hazardous materials.
The principal way of shipping hazardous materials is highway transportation in Turkey. There are government institutions which deal with the Regulation of Transportation of Hazardous Materials in Turkey. In 1976, General Directorate of Highways has published the Regulation of Transportation of Hazardous Materials on Highways. The regulation consists of the following:
Transportation vehicles and their special containers & tanks Classification of Hazardous Materials
General Transportation conditions (loading limits of the vehicles, vehicle specifications and attributes, usage of special signs to distinguish vehicles etc.)
This regulation is still valid but said to be obsolete by both the government and the industry.
There is also an international agreement, published by United Nations Economic Commission for Europe, called ADR-European Agreement, concerning the International Carriage of Dangerous Goods by Road. This regulation may be regarded as a more extended & updated version of Turkish Hazmat Transportation Regulation. In 1994, Turkish Ministry of Transportation has appealed ADR to the Parliament in order to become party of this agreement however, the corresponding commission of the Parliament is still working on the proposal.
In addition to the hazmat transport regulations, there is a general traffic regulation in Turkey. Even though it is for general transportation, it does include hazmat transportation. There is a special topic for commercial drivers:
Commercial drivers can not drive more than 9 hours in total and non-stop 5 hours in a 24 hours period,
In case of a non-stop five-hour drive, the driver must take at least one break of 30 minutes,
Hazmat trucks can not exceed the speed limits of 30 km/hr in urban areas, 50 km/hr in rural areas, and 60 km/hr on the motorways.
Turkish Ministry of Energy and Natural Resources determines policies concerning energy and natural resources. Turkish petroleum industry activities in terms of exploring, refining and pricing of the petroleum products, issuing import and export permits and all other legal, economical and engineering issues have to be approved by this office.
There are three major oil producer & suppliers operating in Turkey; two of them owned by foreign investors and the other is a formerly state owned company. On the other hand there are five petroleum refineries currently supplying these petroleum companies. The refineries will be covered in the next section more extensively.
2.1 Petroleum Refineries in Turkey
There are five petroleum refineries in Turkey, which produce & supply petroleum products to the fuel companies and hundreds of gas stations in the country. In Turkey, 27 million tons of crude oil is refined annually, where 23.8 million tons of this crude oil is imported from several countries such as Saudi Arabia, Iran, Iraq, Libya and Egypt.
Crude Oil Refined Annually (Million-Tons)
TÜPRAS – Izmit (Derince) Refinery 8.5 TÜPRAS – Izmir (Aliaga) Refinery 11
TÜPRAS – Kirikkale Refinery 3.2
TÜPRAS – Batman Refinery 0.86
ATAS – Mersin Refinery 3.5
Table 2-1: Annual Amount of Refined Crude Oil in Turkish Refineries
petroleum products in Turkey. Refineries in Izmir and Izmit, which belong to TÜPRAS, and ATAS – Mersin Refinery, which is owned by foreign companies (BP, Shell, and Conoco), are located on the coasts. Kirikkale Refinery, one of the refineries, which is located on land, is fed with crude oil flowing through the pipeline that originates from the southern part of the country. Batman Refinery has its own oil wells.
The location of the refinery plants, the strategic position of industrialized zones and the population density difference of west and east parts of Turkey indicate that the majority of petroleum products is consumed in the west and mid parts of the country. Hence we may expect the hazmat traffic density in the west and mid part of Turkey to be more than the eastern part. The hazmat traffic density however constitutes a disadvantageous situation, as we infer from accident statistics and hazmat accident news in the national newspapers.
2.2 Hazmat Accidents in Turkey
In Turkey, most of the petroleum products are transported on the highways, which brings out a potential risk over the society and the environment. According to State Statistics Institute data (1999), in Turkey there are 52 fatalities and 1244 injuries per 100,000 vehicles. Again per 100,000 vehicles there are 15 fatalities and 1030 injuries in Germany and 13 fatalities and 1348 injuries in Japan.
Statistical data also indicates that there is a decrease in the number of fatalities in traffic accidents in recent years in Turkey. Although the number of fatalities has decreased by 1600 people between 1990 and 1999, the number of accidents has increased from 115,295 to 438,338.
Table 2-2a indicates a more detailed Accident and Road Traffic data for various countries: A B C D E F G H JAPAN 850,363 10,372 77,810,000 126,686,000 13 1348 8 828 GERMANY 395,689 7,772 50,609,000 82,037,000 15 1030 9 635 HUNGARY 18,923 1,306 2,706,000 10,092,000 48 912 13 244 KOREA 275,938 10,756 13,083,000 46,430,000 82 3080 23 868 SWEDEN 15,834 580 4,607,000 8,854,000 13 477 7 248 TURKEY 63,515 4,596 8,837,403 64,385,000 52 1244 7 171
Table 2-2a: Road Traffic and Accident Data Comparisons for Various Countries (1999)
A: # of Accidents E: # of Fatalities Per 100,000 Vehicle B: # of Fatalities F: # of Injuries Per 100,000 Vehicle C: # of Vehicles G: # of Fatalities Per 100,000 People D: Population H: # of Injuries Per 100,000 People
Table 2-2b: Key to Table 2-2a
There has been 2623 hazmat accidents, which involve only tankers in 1999. According to the consequence of the accidents, there is a total fatality of 146 people where 62 of them were drivers, 68 of them were passengers and 16 of them were third party.
There are many examples of hazmat accidents that took place in Turkey in the past decade. All of them were carried to headlines in the national newspapers, in many of them 10-50 people were killed per accident. Some important hazmat accidents, which may be classified as “serious incidents” are the following:
1. Bus crashed petroleum tanker in Samsun in 1998; resulted with 20 fatalities; fuel leakage out of the tanker caused explosion.
2. LPG loaded vehicle crashed a bus in Eskisehir in 1998; resulted with 10 fatalities and 20 injuries.
3. Diesel loaded tanker crashed a minibus on Sanliurfa-Birecik road in 1998; resulted with 20 fatalities.
Accidents involving hazmat vehicles pose great risk for the society and the environment however, very few hazmat accidents cause a catastrophic event. If a hazmat vehicle involves an accident that leads to a catastrophe, this accident is called an “incident”. According to this definition, in case of a hazmat transport, an undesirable event is an accident that results in the release of a hazardous substance, which is usually a big spill or a blow-up (Erkut and Verter 1998). Undesirable event mentioned here is usually expressed as the number of fatalities that are involved with the accident. However there are also other ways of expressing an undesirable consequence such as economic losses, environmental damage etc.
Although there have been a significant number of hazmat accidents in Turkey, there were few accidents, which fortunately did not lead to an incident. For instance, in 1997 a hazmat truck caught fire on the highway in southern part of Turkey, while it was on the road, without any external effect. The accident zone was closed to traffic for many hours and only after many hours, firemen could manage to extinguish the fire. In another case, a truck crashed into a building in a residential zone in Istanbul at midnight, which could have been a disaster in the metropolis.
In the last ten years, Turkish Government brought many precautions into force to prevent road accidents. These regulations include more effective punishments and extra control points on highways. In effect, there is a
decrease in the number of fatalities in year 1999, however the accident frequency data still indicates that our annual accident frequency remains high above the average, among many countries in the world.
STATE-OF-THE-ART IN HAZMAT TRANSPORTATION
The problem of transportation of hazardous materials has been analyzed since the beginning of 1980s (List et al. 1991). Researchers developed models to define risk and bring solutions to hazmat transportation problems. We categorize the hazmat literature into four groups for convenience:
1. Risk definitions that were used in the hazmat literature
2. Routing models that were determined for hazmat transportation problems 3. Different approaches that were brought to the hazmat literature in recent
years
4. Decision-Maker structures in the hazmat literature
Before we go through the next sections, we define some preliminary basics, which will be used in the remainder of this study.
We represent the existing highway system by a network G=(N, A), where N denotes the set of nodes and A denotes the set of highway links that connect the nodes. A shipment of hazmat type m is transported across G from its origins (o ∈ N) to its destinations (d ∈ N).
3.1 Definitions of Risk in the Hazmat Literature
Modeling hazmat transportation problem aims to mitigate the risk that is exposed to the public and environment, however employing a reasonable and justifiable risk definition is another matter of consideration. Hence, there are different definitions of risk in the hazmat literature.
Earlier studies, which began with risk assessment of transporting hazardous materials, mostly dealt with determining a definition for “risk”. Erkut and Verter (1995) reviewed hazardous materials logistics extensively and provided a detailed review of risk models that were used in previous studies. They examine the idea behind the risk definitions that were used until 1995.
Saccomanno and Chan (1985) define risk as the likelihood of an accident and measure it by incorporating the relative frequency of truck accidents and employing two types of random environmental influences (stochastic and deterministic) which are expressed in probabilistic terms. Stochastic influences arise as pavement surface condition (wet, dry etc.) and visibility while deterministic influences are road design characteristics (speed limits of different types of roads), which are expected to affect general accident rates.
To give a formal definition of this risk model, let P denote a path between an origin-destination (o-d) pair and p denote the probability of having ans incident on a unit road segment on link s. The following is a basic assumption in the hazmat literature:
Assumption 1: p is constant on link s.s
with constant incident probability. Thus the probability of having an incident on unit segment k of link s is (1−ps)k−1 ps. Let p denote the probability ofs' having an incident on link s and l denote the length of link s. Observe that,s
s l s s s s s s s p p p p p p p p' = +(1− ) +(1− )2 +K+(1− )s−1
∑
− = − = 1 0 ) 1 ( s l i s i s p pGiven that the incident probabilities are in the order of 10−8 (for North America), the following assumption is quite common in the hazmat literature (Verter and Kara 2002):
Assumption 2: psi ≅0for i>1. Observe that, now ps' =lsps
. Without loss of generality, let P=
{
1,2,K,r}
. The Incident Probability of a single shipment on path P is:Based on assumptions 1 and 2, the incident probability of path P simplifies to:
Pijawka et al. (1985) also used hazmat accident probability to define risk in the same manner. For each route, they calculated the number of accidents by a hazmat carrier expected per year by multiplying the accident rate by the
∑∏
= − = − + r s s k s k p p p 2 1 1 ' ' ' 1 (1 )∑
∑
= = = r s r s s s s l p p 1 1 'number of total miles of exposure in the hazmat transport.
On the other hand, Abkowitz et al. (1992) employed the same risk definition with the name of Release-causing Accident Likelihood. They derived the accident rates based on truck accident rates involving hazmat movements that appear in the U.S. highway network. Release probabilities are based on various container configurations and highway locations.
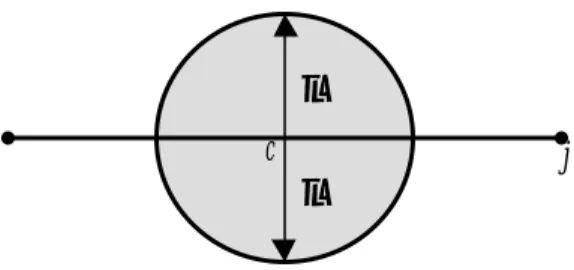
Population exposure is another definition of risk in the hazmat literature.
According to this risk definition, the area within λ-neighborhood of a point c on link (i,j) is under potential risk (Batta and Chiu 1988), where λ varies for different hazmat types.
Figure 3-1: Population Exposure of a Single Truck at Point c on Link (i,j)
The idea behind population exposure is assuming that the probability of death for an individual within λ-neighborhood of a point c on link (i,j) due to the incident is one (Erkut and Verter 1995).
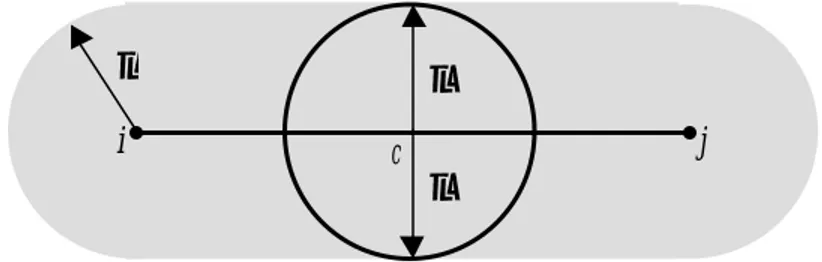
A danger zone of a single hazmat incident is defined with a circle of λ radius, which is centred at the position where the accident takes place. λ, is the impact radius of the hazmat that is being carried, which may change according to the hazmat type. The exposure zone of a link is the union of the danger zones
λ λ c
along that link. Finally, the number of people within an exposure zone is the population exposure of the corresponding link. This may also be regarded as a truck drawing a “risk corridor” on both sides of a link as it moves along that link.
Figure 3-2: Population Exposure of a Single Truck on Link (i,j)
Representation of the spatial distribution of population, within the geographical region of concern, is another critical issue in hazmat transport risk assessment. Recently Erkut and Verter (1995) proposed a model, in which population centres are represented as polygons rather than points. Let
s
d denote the population density around a unit road segment on link s. The following is a common assumption in the hazmat literature:
Assumption 3: d is constant on link s.s
Let Cs,mdenote the number of people living within danger zone around link s, and λ denote the impact radius of hazmat type m.m
Denote the exposure zone of hazmat type m around link s as EZs,m. Let λ λ c i j λ s m m s d C , =πλ2
m s
C , represent the number of people living inEZs,m (Observe that, when link s is a straight line (2 2 )
,m s s m m
s d l
C = λ +πλ ). The population exposure on path P is:
∑
= r s m s C 1 ,When the links are not straight line, then we need to calculate the area within the exposure zone by integration, which may be time-consuming. There is however an easier way of calculating population exposure when Geographical Information Systems (GIS) tools are utilized.
Classic or traditional definition of risk arises as Societal Risk (accident
probability multiplied by the number of people in the danger zone) in the hazmat literature. Several authors preferred to use this risk definition as it combines both incident probability and number of people exposed, which in most cases become more effective and justifiable.
Based on the assumptions mentioned above, the societal risk of path P is:
Pijawka et al. (1985) named Societal Risk as Population-at-Risk Factor and multiplied hazmat accident probability by Population at Risk/Mile.
Abkowitz et al. (1992) also applied the traditional risk definition in their study
∑
∑
= = = r s m r s s s s m s sC l p d p 1 2 1 , ' ) ( πλas it is consistent with the definition of risk used in federal routing criteria guidelines by U.S. Department of Transportation. What distinguishes their application is that they used Geographical Information system (GIS) in calculation of population exposed, in their study.
Alp (1995) modeled the hazmat transportation problem with the traditional definition of risk, however he made use of fault tree and event tree analysis to determine hazmat accident probabilities. A fault tree shows how a system can fail whereas an event tree is used to identify and quantify possible outcomes of an event.
There are two other risk definitions that were used in the hazmat literature: Perceived Risk (Abkowitz et al. 1992) and Conditional Risk (Glickman 1991). However, Erkut and Verter (1998) argued against using the conditional risk and perceived risk models since they violate three axioms that need to be satisfied by a risk model for hazmat transport. These axioms are: monotonicity axiom for path evaluation models, optimality principle for path selection models and monotonicity axiom for risk models.
3.2 Routing Models in the Hazmat Literature
In the hazmat literature, we observe that prevailing studies modeled the routing problem with a single objective which in most cases appear to be the minimization of the total risk exposed to the public.
List et al. (1991a) surveyed an extensive research on hazardous materials transportation considering Risk Analysis, Routing/Scheduling and Facility Location. In their study, it has been stated that the earliest studies dealing with
multiple objectives belong to Shobrys (1981) and Robbins (1981).
Saccomanno and Chan (1985) also dealt with multiple objectives to solve the hazmat transportation problem. The authors discussed three distinctive routing strategies for the road transportation of hazardous materials which are; minimize total risk (three types of damage which are represented as dollars, number of fatality & injuries and zone impact), minimize the accident likelihood (relative frequency of accidents on selected road links) and minimize operating truck costs. Each routing strategy was applied to the Toronto road network, and recommended safe routes were analyzed for cost-effectiveness for a wide range of environmental conditions. Two important aspects emerge from the cost-effectiveness analysis: (a) minimum risk routing strategy produces net economic gains in the form of enhanced safety, and (b) significant trade-offs are of fundamental concern to the implementation of this type of safety enhancement strategy for the transportation of hazardous materials.
Abkowitz at al. (1992) considered five objectives and determined two extreme route results, i.e. determination of minimum cost and minimum risk routes. Furthermore, the authors examined the routes that could provide intermediate solutions by assigning weights (between 0-1) to the objectives of risk and cost. However, very few combinations were presented in the study.
Alidi (1996) modeled the problem of petrochemical waste management with eight objectives. The solution methodology is goal programming where goal priorities were determined via Analytical Hierarchy Process (AHP) to be applied by the decision-maker. The author provided a hypothetical example in the study.
Iakovou et al. (1999) and Iakovou (2001) present the development of a strategic multiobjective network flow model, allowing for risk analysis and routing with multiple commodities, modalities (vessels) and origin-destination pairs. Two objectives are involved in the problem; minimization of the total cost and total risk. Risk was defined as the spatial empirical probability distribution of past spills along with the total dollar cost estimate of damage inflicted by each specific historical spill. Risk calculation was supported by a geographical information system (GIS). The required data contains the location of spill, the amount of the spill, the type of the substance spilled, the date and time of the release, wind time series, and the extent of the cleanup of the spill. The solution process was initialized by two solutions obtained from two problems namely, minimization of cost and minimization of risk. Once the non-dominated basic solutions are determined, the decision-maker is asked to identify a linear combination of the two objectives. The development of an interactive solution methodology is also presented with its implementation via a World Wide Web-based software package. An illustrative application for the Gulf of Mexico is also provided.
There are also some studies in the hazmat literature that consider hazmat transportation problem together with a location aspect.
Revelle et al. (1991) considered the hazardous waste management problem by incorporating routing and siting components with two objectives: the minimization of total transportation burden and the minimization of total perceived risk. Transportation burden was accounted in ton-miles and perceived risk as tons-past-people or people-tons.
routing decisions and siting decisions for waste treatment facilities. Risk, cost and risk equity is considered jointly in a multi-objective framework, seeking pareto optimal solutions that combine them. A simplified form of the model was applied to the Capital District of the State of New York. The case study considers a single type of hazardous waste.
Current et al. (1995) proposed a multiobjective mixed-integer model to minimize risk, equity and cost of locating facilities and transportation throughout a given network. Five objectives are involved in the study including minimization of; a) the total transportation risk, b) risk generated from locating a facility at a particular node, c) maximum transportation exposure faced by any individual, d) minimization of the maximum facility risk faced by any individual and e) minimization of the total transportation, facility and operating costs of the system. In the study, 12 non-inferior solutions were generated using the weighting method.
Most recently, Giannikos (1998) addressed hazardous materials transportation and location problem with a multiobjective model. Objectives employed in this study are the same with the objectives that are used in the hazmat literature. The author use goal programming to model the problem, where a target is specified for each goal so as to find a solution that comes as close as possible to these targets. To mitigate the unsatisfactory results of the weighted goal programming model, the author changed the assumption of “any marginal deviation is of equal importance no matter how distant it is from a target” to “any deviational variable with respect to its target value is penalized according to a constant marginal penalty”.
objective models to be solved individually or simultaneously. We observe that there is an unavoidable multiple objective case to be considered in many hazmat transportation problems. Regardless of the decision maker type, which will be covered more extensively in section 3.4, there is a multiobjective situation in many hazmat problems.
3.3 Different Recent Approaches in the Hazmat Literature
Since the hazmat transportation models, risk definitions and solution methodology could not respond the requirements of real life problems, approaches that are more accurate and useful modifications were brought into the hazmat literature in recent years.
An early distinguished study by Erkut (1995) discusses about a previous model which finds hazardous materials routes proposed by Sivakumar et al. (1993). Erkut stated that the model violates a monotonicity axiom for path evaluation and selection models. Small numerical examples were given in order to demonstrate the violation results in the selection of solutions that may be undesirable in the hazardous materials routing.
Erkut and Verter (1998) question two traditional assumptions in the hazmat literature. One basic assumption is that, residents living inside a circle at an incident site, with a given impact radius, will experience the same undesirable consequence, and residents living outside the circle will experience no undesirable consequence. According to the authors, this assumption is inevitable since the data necessary for an accurate assessment of risks to humans do not exist for many hazmats. As long as one is interested in the relative risks of different paths, the danger zone approximation will provide
valid comparisons.
The second basic assumption is that the products of incident probabilities equal to zero, which is Assumption 2 mentioned in Section 3.1. It was shown that this approximation does not result in significant inaccuracies in the estimation of incident probabilities.
In many multiobjective hazmat transportation problems, it is necessary to provide a set of alternative paths. This is due to the case of a possible infeasibility of the “best” route(s) (road construction or certain roads closed to hazmat traffic temporarily) that is selected by the carrier.
Akgün et al. (2000) considered the problem of finding a number of spatially dissimilar paths between an origin and destination. They state that a number of dissimilar paths can be useful in solving capacitated flow problems or in selecting routes for hazardous materials. A critical discussion of three existing methods; Iterative Penalty Method (IPM), Gateway Shortest Paths (GSPs) and Minimax Method is offered for the generation of spatially dissimilar paths. Computational experience using these methods and the advantages and disadvantages of each method are also reported. They concluded that each of three existing methods has a number of drawbacks. An alternative solution technique is proposed as a p-dispersion problem. If a large number of suitable candidate paths can be generated, then the application of the p-dispersion model is said to be an effective way to solve the problem.
A more recent study that were brought into the hazmat literature by Kara and Verter (2000) is distinguished from the rest of the hazmat literature. The study approaches to the hazmat transportation problem from a regulator’s point of
view, which makes use of closing certain links of the road network to hazmat transportation in order to mitigate the transport risk. Kara and Verter (2000) demonstrated each Decision-Maker’s (DM) dependent situation in a unique way in their study.
According to this approach, the regulator identifies the allowable links in the network for hazmat transportation to mitigate the risk associated with the hazmat transportation. The carriers try to maximize their utility, namely minimize their transportation costs by selecting the shortest routes in the remaining network. Governments do not have the authority of determining the routes for the carriers, but they can as well close certain links in order to indirectly influence the carriers to “safer” routes. Kara and Verter proposed a bilevel model, which has two different objectives from Government and Carrier’s point of view respectively.
3.4 Decision Maker Structures in the Hazmat Literature
We observe that there are two main Decision-Makers (DM) that were used in the hazmat literature: the regulators (the government) and the hazmat carriers.
As the hazmat transportation problem emerged from mitigating societal and environmental risk, the problem was modeled from a regulator’s point of view in most of the studies. The main attribute of this DM is that a regulator has the only objective of minimizing risk and does not hold the authority of dictating certain routes to hazmat carriers. Studies until Kara and Verter’s (2000) new approach tried to solve the hazmat transportation problem from regulator’s viewpoint, however the justification of the previous models were questionable.
One important remark in the hazmat maritime transportation is that a maritime regulator (coastal guard) holds the jurisdiction of dictating certain routes to the hazmat carriers (Iakovou et al. 1999).
The second DM type represents the hazmat carriers. The basic assumption with this DM is that a hazmat carrier will base its routing policy on selecting the paths which minimize the total transportation cost. Therefore, the objective of this DM happens to be minimizing transportation costs.
To sum up, we can conclude that most of the studies in the hazmat literature approach the problem from the regulator’s point of view in the sense that the methodologies developed aimed at minimizing the risk (or some combinations). However, the actual shipments are done by carriers for whom minimizing the risk exposed to the people and the environment is not an issue unless they are forced to do so. There are however, some studies that suggested multiobjective models for the use of hazmat carriers, which were mentioned in section 3.2. With these two Decision-Makers, multicriteria approaches seem to be irrelevant since the DMs of the multiobjective model are two different DMs. To the best of our knowledge, none of the studies in the hazmat literature have identified or clarified this property.
During our analysis of hazmat transportation problem we observe that there is another type of DM in the hazmat transportation area, which has been neglected in the literature so far. In the next chapter, we will present the new DM together with its problem specifications.
PROBLEM DEFINITION
In the previous chapter, we have discussed the DM types that took place in the hazmat literature. In this chapter, we will introduce a new DM type, which we argue that it has been omitted in the hazmat literature. We conducted a joint research with one of the biggest petroleum companies in the country, Shell Turkey. Our new DM happens to be the “missing” DM in the hazmat literature who will use all these multicriteria type of approaches.
Before we go through our case study, we examine the structure of the company, as well as its jurisdictions and requirements.
4.1 Company Structure
Shell is the second largest petroleum products producer & supplier in the world with over $70 billion total fixed assets and the third largest oil company in Turkey. Shell has two main customer groups in Turkey:
1. Commercial customers, who purchase Shell products in bulks for their own business such as companies in agricultural, construction and transportation (aviation and maritime) industries.
2. Retailers, who constitute the largest portion of total Shell customers (%75). There are currently 575 retailers, namely gas stations throughout Turkey.
Shell Turkey supplies 2,000,000 tons of petroleum products annually where 1,500,000 tons are supplied to 575 gas stations. There is a variety of products which consists of:
1. Unleaded Gasoline-Extra 2. Diesel-Extra 3. Diesel 4. Gasoline 5. Gasoline-Extra 6. Unleaded Gasoline 7. LPG
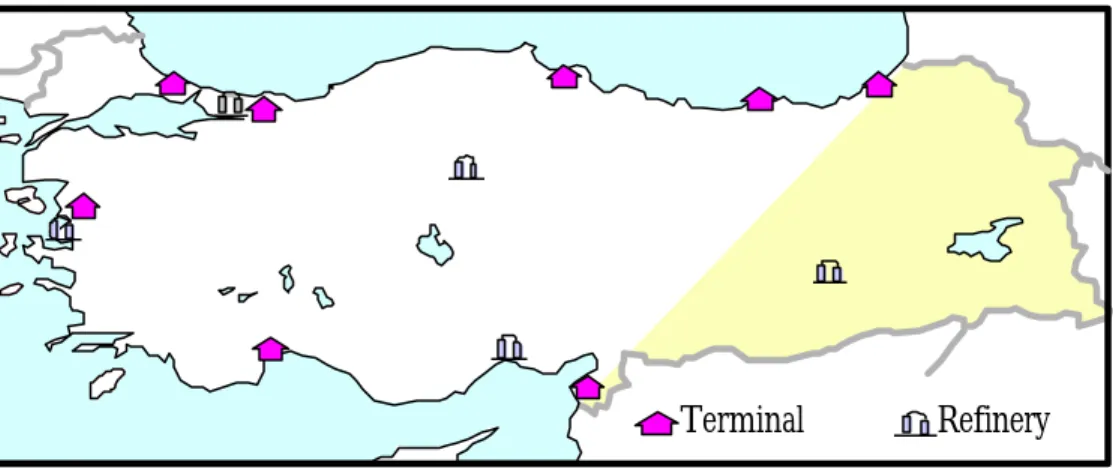
There are eleven supply points currently serving Shell where, three of them are refineries and eight of them are terminal points which are usually located on the coasts. Figure 4-1 indicates the location of the eleven supply points.
Figure 4-1: Supply Points of Shell in Turkey
Shell customers have two delivery options for the products they purchase. KIRI ISKE BA AN M SA H I AL A Terminal DERIN Refinery
They can either pick up their purchase by using their own trucks and drivers or send an order to Shell to do the delivery for them. The details about these transport modes are as follows:
1. Customer own pick-up: Most of Shell customers (%70) have their own tanker-trucks. These trucks must suffice the requirements of Turkish Hazardous Materials Transport Regulation and must have a safe pass sticker, after being approved by Shell. Gas station owners, who prefer to use their own trucks for product shipments, transport them at their own risk. Shell is not responsible for any risk in this transportation mode. 2. Shell Fleet: Shell provides shipping service to its customers since 1998,
with three subcontractor transport companies. The structure of the business is as follows:
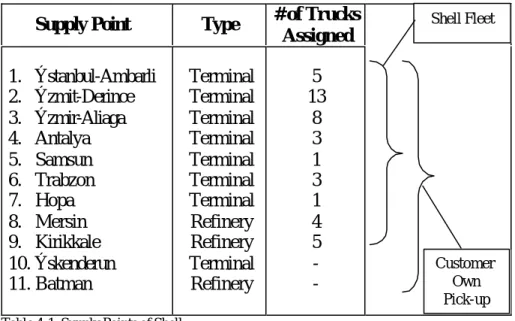
Investments such as trucks, hiring drivers etc. belong to the subcontractor transport companies, namely the hauliers. The fleet consists of 43 trucks of various sizes, which have been assigned to nine supply points by Shell to serve between various o-d pairs. Although there are eleven supply points, Shell assigned its fleet to nine of these supply points. Table 4-1 indicates the supply points and the number of trucks that are assigned to these supply points by Shell.
A typical delivery process is as follows: Hauliers,
take the orders and the routes to follow
occasions1 and;
are given the delivery time2 (interval) & place by Shell.
Supply Point Type # of Trucks
Assigned 1. Ýstanbul-Ambarli 2. Ýzmit-Derince 3. Ýzmir-Aliaga 4. Antalya 5. Samsun 6. Trabzon 7. Hopa 8. Mersin 9. Kirikkale 10. Ýskenderun 11. Batman Terminal Terminal Terminal Terminal Terminal Terminal Terminal Refinery Refinery Terminal Refinery 5 13 8 3 1 3 1 4 5
-Table 4-1: Supply Points of Shell
Shell pays the hauliers on the basis of per kilometers travelled and fixed costs, which may be regarded as depreciation costs. The fare of per kilometers traveled varies for each haulier, since three of the hauliers are independent companies.
To evaluate the performance of the hauliers and the drivers, Shell created two evaluation systems called Drivers’ League (DL) and Hauliers’ League (HL).
In HL, performance of each haulier is determined among particular weighted
1 In case of an exogenous change (an accident or a closed road) within a specified route, the drivers are
advised not to choose a tunnel as an alternative, but to follow a safer link such as a highway.
2 Every gas station has a different receiving time interval of the purchased goods.
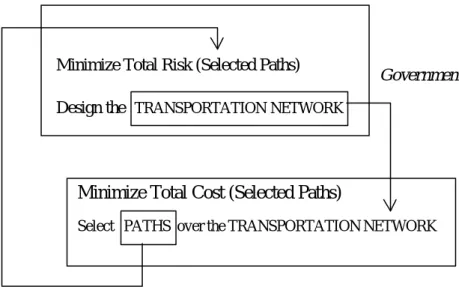
Shell Fleet
Customer Own Pick-up
criteria such as the number of traffic accidents/month, average speed of a shipment, customer evaluations and haulier’s monthly accident reporting performance. Evaluation in DL is in the same fashion, however there are other criteria such as; maintenance of the vehicles, fuel consumption and potential accident reports and “near misses” (a near miss is an accident that a driver is just about to involve).
There are some constraints for this transportation mode:
1. Shipments must be made within 24 hours
2. The tanks fixed on the trucks are physically divided into compartments of various capacities. No half-filled compartments are allowed due to security and economic reasons.
3. Multiple destinations for a shipment is not desired due to set-up costs such as paperwork, connecting the hoses to the trucks etc.
4.2 The Problem
Each haulier undertakes the consequences (all costs of a damage; economic loss of goods that are being transported and third party damages) of a hazmat transport incident. This situation calls for the following question as Shell is not responsible for economic losses in the hazmat transportation: Do we still have a hazmat transportation problem?
Yes. Although the cost of an incidence is taken care of by the hauliers, Shell does not totally ignore the risk exposed to public and the environment. There are some reasons:
2. The international structure of the company necessitates requirements such as HSE-Health Security and Environment policies
3. The fleet consists of Shell branded trucks, which means that Shell will be accused by public and media in case of an incident.
In addition to the transportation risk, Shell requires the transportation costs to be economically feasible as well since profitability is another important objective of the company. Thus, Shell wants to reduce the impact of a possible incident (minimize the risk exposed to public and environment), however keeping the transportation costs economically feasible is at least of equal importance.
Shell is the leader of the game and holds the jurisdiction. Hauliers’ role here is like an “employee” of Shell because they do not hold the authority of making the routing decisions. When it comes to the costs associated with an incident, hauliers do care about it, because in case of an accident, they will have to cover all the loss instead of Shell.
This situation allows us to introduce a New Decision-Maker, which considers both objectives (“risk” and cost) that are not in mutual competition. The reason that we need to introduce a new DM is that, Shell’s case does not fit in the DM structures that currently exist in the hazmat literature.
When we consider the traditional DM type that represents the hazmat carriers, we realize that Shell’s situation does not correspond to this DM type. Because Shell is not the actual hazmat carrier in our problem. Considering the government as an alternative DM to suit Shell’s case we again understand that Shell and its hauliers do not reflect the situation in that model. Regarding Shell
and its hauliers’ dependent relations to suit Kara and Verter’s (2000) model, we observe that there is a basic property with the regulators that, a regulator can not dictate the carriers the paths to be followed. However, we already mentioned that Shell could actually dictate its sub contractor companies which routes to be taken.
The new decision-maker represents the companies producing and supplying hazardous materials but not doing the actual transportation business with the company facilities. The attributes of this new decision maker is the following:
1. The hazmat supplier company is not involved in the transportation business, but has them done by sub contractor firms.
2. Sub contractor firms determine the fares according to per kilometers traveled.
3. The hazmat producer company holds the jurisdiction over the sub contractor firms, such as being able to dictate the routes to be followed
4. The damage costs of hazmat transportation belong to the hauliers.
In summary, the hazmat transportation problem for Shell is, to minimize the total “risk” of the hazmat transportation in consideration with keeping the hauling costs economically feasible.
SOLUTION METHODOLOGY
In Chapter 4, we argued that Shell’s situation would not fit in the traditional DM type, which represents hazmat carriers. Moreover, we introduced a new decision maker type who does not actually do the hazmat transportation but hires sub contractor firms to do the transportation and undertake the cost of damage involved in the transportation business.
There are two objectives in the problem, which are to minimize total transportation risk and minimize total transportation cost. As these two objectives are to be considered simultaneously for Shell, we need to develop a model that contains both of the objectives.
Let us start from the simplest transportation problem where we have only one objective function without any constraints other than the flow balance. For a single o-d pair, it is obvious that the problem is a shortest path problem, which may have one or more optimal solution(s).
When we have the transportation problem with n distinct o-d pairs, we need to consider every single problem concurrently to get an optimal solution. This means that we have n independent shortest path problems to be solved simultaneously. The problems are independent since the only constraint set is the flow balance, so there are no coupling constraints. Hence, we can solve the transportation problem that consists of n different o-d pairs, by solving each problem as a single o-d shortest path problem separately or sequentially.
The problem we have in this study necessitates multicriteria consideration. Therefore, we need to incorporate multiple objectives into our problem, since single objective shortest path problem would not suit our DM’s purposes.
The studies dealing with multiple objectives in the hazmat literature mainly focused on two methodologies in solving their problems: Weighting Method and Goal Programming.
List et al. (1991), Revelle et al. (1991), Abkowitz et al. (1992), Current et al. (1995) and Iakovou et al. (1999) calculated weighted combination of the objectives and solved the problem with the new weighted objective function. Alidi (1996) and Giannikos (1998) employed goal programming to tackle the multiobjective situation in hazmat transportation problem.
Goal programming necessitates expert user (DM) interaction such as, setting target values and ranking the targets in order of relative importance etc. Our discussions with company representatives regarding Shell’s interaction to the problem led us to employ weighted combination of the objectives and present the corresponding results. Therefore, we use weighting method to solve the hazmat transportation problem in our study.
Let us consider single/multiple o-d pair(s) with multiple objectives in a transportation problem. These objectives are expressed in different units, e.g. total risk (number of people living around a link within a specified distance λ) of the paths and total cost (length of a link) of the paths, both to be minimized. These two units of measure can be considered as individual arc impedances when a single objective shortest path problem is of concern. Aggregating these two arc impedances (after being normalized) will yield a new value f, which
can be considered as a new arc impedance. Based on minimizing total “cost” of paths, f, we again have a single objective shortest path problem. For a particular aggregation of two arc impedances, we have:
ij ij ij wl w r f = 1 + 2
where, w is a weight, i wi =
[ ]
0,1 and∑
= ii
w 1, to represent the importance of
arc cost values l , length of link (i,j) and ij r , risk value of link (i,j).ij
ij
f becomes the new arc impedance in our problem.
As both of the cost functions are expressed in different units of measure, we normalize the cost attributes of each link before the calculation of each weighted combination. To express both arc impedances in a common unit, we divided each value of an arc by the sum of the corresponding cost value. Namely, * 2 * 1 * ij ij ij w l w r f = + , where
∑
∈ = A j i ij ij ij l l l ) , ( * and∑
∈ = A j i ij ij ij r r r ) , ( * , ∀ (i,j).A shortest path problem minimizing
∑
∈A j i ij ij X f ) , ( *
, where X is 1 when link (i,j)ij
is used in a path P and 0 otherwise, will find an efficient point on the trade-off curve.
the DM’s requirements and goals. Therefore, we present several weighted combination results to the DM to decide which combination best suits their purposes. Previous methodology of solving n independent shortest path problems is still valid for every weighted combination.
5.2 Implementation
We have a series of shortest path problems with multiple objectives for various o-d pairs. The best way to solve the problem is to use Geographical Information System (GIS). GIS enables us to represent the o-d pairs on their accurate locations and calculate the arc impedances easily.
We used ESRI’s ArcView GIS 3.1 software package to calculate arc impedances. Population centers are represented using polygons, which illustrate real life situations better than in point representation of the population centers (Erkut and Verter 1995). We use a digitized population center census division map of Turkey (67 cities), which is available on ESRI’s web based library. We also obtained a digitized highway map of Turkey from ISYAM. For each link, we calculated the length in kilometers and the risk (population exposure) values using GIS tools.
We have a 670-arc and 499-node network, which is the highway network of Turkey. The (o-d) shipments are between origins o = {Aliaga (Ýzmir), Ambarli (Ýstanbul), Derince (Ýzmit), Kirikkale, Trabzon, Samsun, Hopa (Artvin), Atas (Mersin), Antalya} and 562 destinations, which are located on their exact geographical positions.
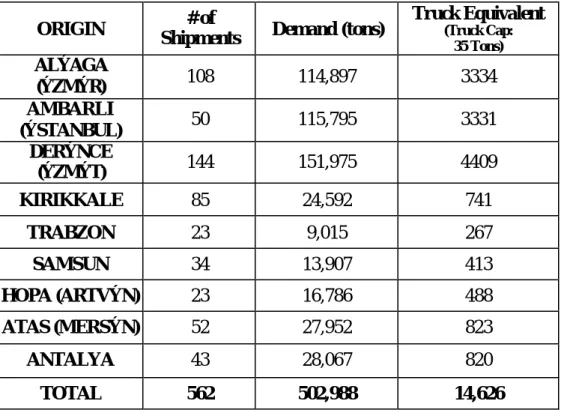
responsible for the customer own pick up transportation mode. There is a total of 1582 shipments made by Shell Fleet, which equals to 586,000 tons of petroleum products/year. However, we focused only the shipments that are more than a truck in a year. Therefore, we have 562 shipments of various sizes. This equals to 502,988 tons of petroleum products over a year.
The number of shipments from nine supply points is as follows:
ORIGIN # of
Shipments Demand (tons)
Truck Equivalent (Truck Cap: 35 Tons) ALÝAGA (ÝZMÝR) 108 114,897 3334 AMBARLI (ÝSTANBUL) 50 115,795 3331 DERÝNCE (ÝZMÝT) 144 151,975 4409 KIRIKKALE 85 24,592 741 TRABZON 23 9,015 267 SAMSUN 34 13,907 413 HOPA (ARTVÝN) 23 16,786 488 ATAS (MERSÝN) 52 27,952 823 ANTALYA 43 28,067 820 TOTAL 562 502,988 14,626
Table 5-1: Demand Distributed to Different Supply Points (2001)
We use Population Exposure as our risk measure. We determined λ to be 800 meters, as Transport Canada requires evacuation of people residing within 800 meters of an incident site when petroleum products are involved (Verter and Kara 2002). The impact radius is the same for all hazmats we studied. The types of hazmats we have in our study are Diesel-Extra, Diesel, Gasoline,
Gasoline-Extra, Unleaded Gasoline, and Unleaded Gasoline-Extra.
Our computations are based on solving several groups of shortest path problems for two different arc impedances and their combinations. A Minimum Length Path (MinLength) is the path that is determined based on selecting a shortest path in terms of the kilometers traveled. A Minimum Risk Path (MinRisk) is the path, which is determined based on selecting a path that poses the least risk to the public and the environment.
We determined Minimum Risk and Minimum Length paths for each shipment sequentially. When routing is based on selecting shortest paths, total path length results of Minimum Length Path solutions constitute a lower bound for the total path length of all shipments. On the other hand total path risk results of Minimum Risk Path solutions constitute a lower bound for the total path risk of the shipments when routing strategy is based on minimizing path risk. Besides these two extreme case results, we also determined intermediate results, which come from the weighted combination of the risk and cost functions.
We used Dijkstra Algorithm implementation provided in the Network Analyst 1.b extension of ArcView GIS 3.1 in our shortest path calculations.
5.3 Computational Results
For a particular routing criterion, we have two results to be compared by the DM in order to make a decision. The first one is the total risk of a path and the second is the total length of a path. For a particular shipment, a Minimum Length and a Minimum Risk Path are depicted in Figure 5-1.
In Figure 5-1, observe that the Minimum Length path is 356 km. and exposes risk to 49,290 people. Same shipment but with different routing criterion, Minimum Risk path has a length of 379 km. and population exposure of 47,273 people.
Figure 5-1: Aliaga-Çanakkale Shipment
These results illustrate the cost and the exposure of a single-truck. However, the amount of this particular shipment is 56 trucks/year, so we incorporate the cost and the exposure of every truck to get a meaningful result. For each supply point, the corresponding number of trucks of each shipment is
ALÝAGA-ÇANAKKALE SHIPMENT
MinLength Route MinRisk Route
Km: 356 Population Exposure: 49,290 Km: 379 Population Exposure: 47,273 Çanakkale Aliaga
multiplied by every shortest path result. Hence, we have two measuring units, which are Truck-People for the total population exposure and Truck-Km for the total cost of the paths.
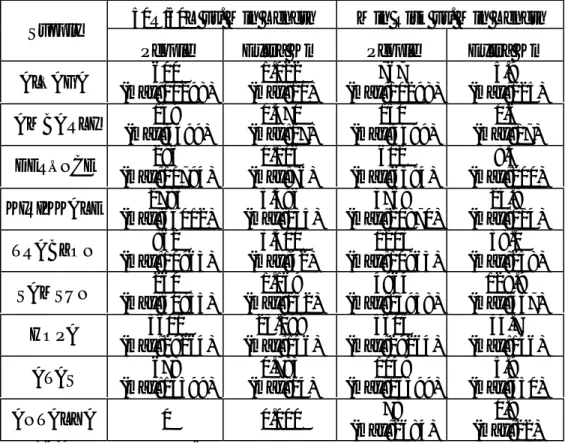
Finally, two extreme case results (Minimum Risk and Minimum Length Paths) and an equally weighted combination result for all 562 shipments originating from nine supply points are as follows:
Supply Minimum Risk Minimum Length
%50 Risk-%50 Length Truck People Truck
Km Truck People Truck Km Truck People Truck Km ALÝAGA 193,160,611 646,001 195,718,341 626,294 193,716,312 629,703 AMBARLI 402,953,384 184,834 403,451,512 182,881 402,954,936 184,446 DERINCE 338,377,090 665,397 341,032,680 628,517 339,726,605 633,395 KIRIKKALE 32,728,918 218,624 35,521,938 200,260 33,459,920 204,407 TRABZON 6,996,427 48,249 7,317,735 38,102 7,087,512 38,983 SAMSUN 18,612,010 191,962 20,662,113 138,744 20,554,890 139,227 HOPA 4,043,449 72,832 6,778,629 55,907 4,045,563 67,277 ATAS 39,382,299 233,509 40,245,728 228,687 39,687,660 229,331 ANTALYA 8,878,217 88,956 8,942,109 88,208 8,942,109 88,208 TOTAL 1,045,132,405 2,350,364 1,059,670,785 2,187,600 1,050,175,507 2,214,977
Table 5-2: Minimum Risk, Minimum Length and %50Risk-%50Length Results
There is a significant decrease in the total transportation risk, which is equal to 14.5 million truck-people, when Minimum Risk is the routing criterion instead of Minimum Length. There is a trade-off, which requires total transportation cost to be increased by 162,764 truck-kms, which is total extra kms to be made by Shell fleet in a year.
Among 562 shipments, 379 shipments have similar paths, namely 379 shipments have the same path results for either minimum risk or minimum length routing consideration. To give a ratio, only %33 percent of the
shipments have dissimilar path results. This also corresponds to 1531 trucks among 14,626 total trucks.
The shipments, originating from different supply points, differ in terms of their total path risk and total path cost results. For instance, the difference of total path risk of MinLength and MinRisk results from supply point AMBARLI is 498,128 truck-people and the corresponding trade-off is 1953 truck-kms. However, the achievement and the trade-off for the shipments from HOPA are 2,735,180 truck-people and 16,925 truck-kms. Despite the fact that the annual demand from supply point HOPA is only %14 of the annual demand from supply point AMBARLI, there is a significant difference between the achievement and the trade-off values of these two supply point originating shipments. This is due to the following reasons:
When we compare the extreme case results for each supply point, we see that geographical position of the supply point as well as its demand points can be effective to change total risk and total cost results. Even though some supply points, such as AMBARLI and ALÝAGA are located on the most densely populated cities (Ýstanbul and Ýzmir respectively) and they provide service to %25 of Shell Turkey’s market, the achievement (in terms of number of people that can be saved from potential risk when routing strategy is based on MinRisk instead of MinLength) is quite low comparing to the supply points which serve a relatively small market, such as HOPA. This is due to the allocation of demand points to the supply points and the geographical position of the o-d pairs. When the distribution of demand points of each supply point is observed on the map thoroughly, it can be seen that most of the supply points serve some cluster of the market. For instance, AMBARLI serves only the European part of Turkey, which results in mostly similar paths for both
Minimum Length and Minimum Risk routing considerations. On the other hand, KIRIKKALE which can also be named as the “default” supply point of Turkey, serves almost all over the country, which results in completely dissimilar paths for almost every KIRIKKALE based shipment. Thus, we can conclude that, the allocation of o-d pairs as well as the geographical position of the allocated supply and demand points affects the results of our analysis. It is clear from the above results that the o-d assignments of Shell Turkey are quite effective.
There is another result presented in Table 5-2, which combines risk and cost functions evenly. %50 Risk-%50 Length saves 9.5 million truck-people with a quite low trade-off, 27,377 truck-kms, in comparison to the trade-off value of Minimum Risk Path result.
Altering the weights of the objective functions with new values will result in new alternatives for the decision-maker. When we assign a %25 of importance to risk and %75 to cost, we have a 5.1 million truck-people saved with 5,790 truck-kms of trade-off, in comparison to Minimum Length.
%25Risk -%75Length %75Risk-%25Length
Supply
Truck People Truck Km Truck People Truck Km
ALÝAGA 194,332,540 626,986 193,377,479 635,141 AMBARLI 403,346,347 182,966 402,954,934 184,446 DERINCE 340,679,227 629,059 338,626,382 646,552 KIRIKKALE 33,741,943 202,712 32,811,366 212,210 TRABZON 7,317,735 38,102 7,078,508 39,075 SAMSUN 20,647,245 138,767 18,996,600 161,710 HOPA 5,833,629 57,405 4,045,563 67,277 ATAS 39,706,756 229,185 39,392,461 232,762 ANTALYA 8,942,109 88,208 8,883,061 88,705 TOTAL 1,054,547,531 2,193,390 1,046,166,354 2,267,878
The opposite weighted combination result, which is %75 risk-prone, results with 13.5 million truck-people to be saved for 80,278 truck-kms to trade.
To provide more alternative solutions, we solved our problem for 13 different combinations, which range from %10 to %90 Risk and %10 to %90 cost. These 13 results, the trade-off curve of these results and illustrated examples are presented in Appendix-A, B and C respectively.
From the total transportation risk and total transportation cost results, we observe that %50Risk-%50Length routing strategy is far better than Minimum Risk criterion, which was also commented so by our Decision Maker.
Further analysis regarding the achievement and the trade-off for a single truck, results in more interesting values which is presented in Table 5-4. Considering Minimum Risk versus Minimum Length results, we already know the total number of people we can save from potential risk and the total kms we need to trade to take advantage of this achievement, which are 14.5 million truck-people and 162,764 truck-km respectively. When we take the average of these values by dividing total number of truck equivalents, which is 14626, we see that there is a clear difference between two routing considerations.
We save 649 people from potential risk by only making extra 1.8 kilometres per truck on the average in %50Risk-%50Length versus MinLength. On the other hand, MinRisk versus MinLength criterion saves 994 people for every 11 kilometres per truck on the average. Although the average of achievement and trade-off values per truck are as stated above, the average achievement and trade-off values differ for the shipments originating from different supply points.
50R/50L vs. Min Length Min Risk vs. Min Length Supply
People Extra Km People Extra Km
ALÝAGA 600 (max:10298) 1.022 (max:10) 767 (max:10298) 5.9 (max:125) AMBARLI 149 (max:4499) 0.470 (max:17) 150 (max:4499) 0.6 (max:17) DERÝNCE 296 (max:10794) 1.106 (max:76) 602 (max:6594) 8.4 (max:200) KIRIKKALE 2783 (max:65012) 5.596 (max:135) 3769 (max:20870) 24.8 (max:114) TRABZON 862 (max:10963) 3.300 (max:42) 1203 (max:10963) 38.0 (max:258) SAMSUN 260 (max:30835) 1.169 (max:152) 4964 (max:23958) 128.9 (max:337) HOPA 5601 (max:29264) 23.299 (max:146) 5605 (max:29264) 34.7 (max:146) ATAS 678 (max:15399) 0.783 (max:14) 1049 (max:15399) 5.9 (max:350) ANTALYA 0 0.000 78 (max:2684) 0.9 (max:22)
Table 5-4: Achievement and Trade-off Results per Truck
As presented in Table 5-4 above, there is an interesting result for the shipments originating from two distinct supply points AMBARLI and HOPA. Although the number of people that could be saved from potential risk is nearly the same for %50Risk - %50Length and Minimum Risk results, the extra kms that must be traded is lower in %50Risk - %50Length criterion.
5.4 Use of Black Spots
In this section, we investigate the “accidental risk” of the Shell-shipments based on a particular routing strategy, in order to analyze the transportation risk from a different point of view. We analyze whether Shell trucks pass
along the “dangerous roads”, namely Black Spots that are identified by the Turkish Government.
Black Spots are certain segments of the highway network in Turkey, on which the traffic accident occurrence frequency is defined to be “high” by the General Directorate of Highways (GDH). Some of the black spots are as follows:
1. Road segment connecting Istanbul Bosphorus Bridge to Ýzmit 2. Road segment crossing Bolu Mountain
3. Road segment between Ürgüp and Kayseri-West 4. Çesme-Ýzmir road
According to the Black Spots Map of Turkey, which is provided on the GDH internet web site, we associated 71 links as “dangerous roads” on our road network.
Given the results of Minimum Length, Minimum Risk and %50Risk -%50Length paths, we analyze the usage of the black spots like the following:
Out of 71 dangerous links, shipments based on Minimum Risk routing criterion uses 63 links with a total of 23,721 trucks traversed (Mean:334; Max:3024) along the links. We observe that, all 63 of the links are inevitably used in MinRisk criterion since these links are also used in the Minimum Length routing criterion, which means that the links correspond to similar paths resulted in both MinLength and MinRisk strategies for particular shipments.