ORIGINAL ARTICLE
Consequences of habitat fragmentation on genetic diversity
and structure of
Salix alba L. populations in two major river
systems of Turkey
Funda O. Degirmenci1,2&Pelin Acar2,3&Zeki Kaya2
Received: 29 November 2018 / Revised: 30 May 2019 / Accepted: 4 June 2019 / Published online: 25 June 2019 # Springer-Verlag GmbH Germany, part of Springer Nature 2019
Abstract
Salix alba L. (white willow) is an indicator species of a healthy riparian ecosystem with great renewable energy potential in Turkey though habitats of the species in many river ecosystems are highly degraded or fragmented. Impacts of this degradation of river ecosystems on the magnitude and pattern of genetic diversity are not known. This study was aimed at assessing the genetic structure of S. alba populations in two highly degraded and fragmented river systems (the Göksu and Kızılırmak rivers) in Turkey with the use of 20 nuclear simple sequence repeat (SSR) loci. Fifteen of them were used for the first time in this study. Out of the 20 SSR loci, 10 loci significantly deviated from the Hardy-Weinberg equilibrium frequencies and five of them contributed greatly to the differentiation of populations. Generally, high levels of genetic diversity were found in populations of both Göksu and Kızılırmak river systems and moderate genetic differentiation (FST= 0.07) between the river systems. On the contrary to expectations, genetic diversity was higher in middle populations of the rivers (Ho = 0.67 of GRMID (Göksu river middle population), Ho = 0.68 in KRMID1 (Kızılırmak river middle population 1), and 0.65 in KRMID2 (Kızılırmak river middle population 2)) than in downstream populations (Ho = 0.65 in GRDOWN (Göksu river downstream population), Ho = 0.62 in KRDOWN1, 2 (Kızılırmak downstream populations 1, 2)). These could be due to experienced past bottlenecks, extensive vegetative material movements, and habitat fragmentation by constructed dams in the natural ecosystems of the two river systems. The genetic structure results revealed that the white willow populations in the two different river systems may have evolved from two different founder populations. A low level of genetic admixture between the river systems but high admixture within the river systems were observed due to extensive human-mediated vegetative material movements. The current study has provided valuable genetic data and information that could contribute insights to efficient conservation, management, utilization, and breeding of genetic resources of the species.
Keywords Genetic diversity . Simple sequence repeat (SSR) . Population structure . Salix alba . Habitat fragmentation
Introduction
Willow (Salix L.) species are distributed mainly in temperate and cold regions of the Northern Hemisphere (Argus1997) with great morphological variations (Hardig et al.2010). The diversity centers of the genus are considered to be in China (275 species) and in the Russian Federation (125 species) (Liu
1999). There are 100 species in North America and 65 species in Europe (Argus 1997). When considering the functions of willows in river plantations, water quality, erosion control, and biodiversity conservation, willows are accepted as pioneer species. The contribution and scope of global Salix plantation are increased to have sustainable forestry and to provide wil-low wood materials for industry and rural development (Ball et al.2005). Among the willow species, Salix alba L. (white Communicated by P. Ingvarsson
Electronic supplementary material The online version of this article (https://doi.org/10.1007/s11295-019-1365-2) contains supplementary material, which is available to authorized users.
* Zeki Kaya [email protected]
1
Faculty of Agriculture, Department of Field Crops, Ahi Evran University, Kırşehir, Turkey
2
Department of Biological Sciences, Faculty of Science and Art, Middle East Technical University (METU), 06531 Ankara, Turkey
3 Present address: National Botanical Garden of Turkey, Ministry of
willow) appears to have an important place for the pulp indus-try, biomass, phytoremediation, and landscaping (Skvortsov
1999; Mleczek et al.2010; Esbrí et al.2018).
There are 27 species of willow with wide-ranging natural distributions in Turkey (Terzioğlu et al.2014). White willow, ranging from shrubs to large trees (Velioğlu and Akgül2016), is widely distributed in almost all river basins of Turkey (Davis1965; Avcı1999), but willow habitats in river systems have been highly fragmented or eroded due to the construction of dams for irrigation and electricity production. White willow is one of the most important species of Turkish river ecosys-tems due to its economic and ecological importance. In Turkey, willows are traditionally planted in rows along mar-gins of moist meadows and fields and are regularly pruned to produce small-sized fuel-wood and raw material for non-wood products such as livestock feeds (Velioğlu and Akgül
2016). There is an increased interest in its use as an effective phytoremediation tool for cleaning rivers, ecosystem rehabil-itation efforts, and short rotation plantation for energy in the world. However, the potential of the species is underestimated in Turkey. Furthermore, poplar and willow species, including white willow, are not subjected to Turkish forestry regulations. Thus, long-term programs for biomass plantations, conserva-tion, and breeding of white willow genetic resources are lack-ing in the country.
Up to now, studies related to white willow in Turkey have been limited to the establishment of a clone bank and assess-ment of clones with respect to growth performance (Tunçtaner
1990). Genetic diversity is an important element in the dy-namics of populations, because it is directly relevant to the evolutionary potential of the populations (Hughes et al.
2008). Although genetic diversity of trees is a key component in biodiversity and important in the resilience and adaptation of ecosystems to climate change, there is no study to date dealing with genetic structure of the fragmented population of white willow. With the current study, by using nuclear microsatellite loci, the magnitude of genetic diversity and its structure in fragmented white willow populations from two major river systems (Göksu and Kızılırmak) were assessed. These two rivers flow into different seas without common river basins. The natural ecosystems and habitats of willows in the river systems have either disappeared or been highly fragmented due to various environmental and industrial fac-tors such as building of dams, hydroelectric power stations, sandbars, and industrial and urban wastes. The Göksu river (260 km in length) flows into the Mediterranean Sea and har-bors 7 dams and/or hydroelectric power plants, while the Kızılırmak river, the longest river (1355 km long), flows to the Black Sea with 15 dams and/or hydroelectric power plants built on it. Since the overall habitat and distribution of native white willow populations have decreased, it is currently highlighted that conservation of natural willow populations and related ecosystems is very important (Vries De2001).
With the help of genetic information generated in the current study, new conservation strategies and breeding programs dealing with white willow will be effectively implemented in the future.
Materials and methods
Plant material
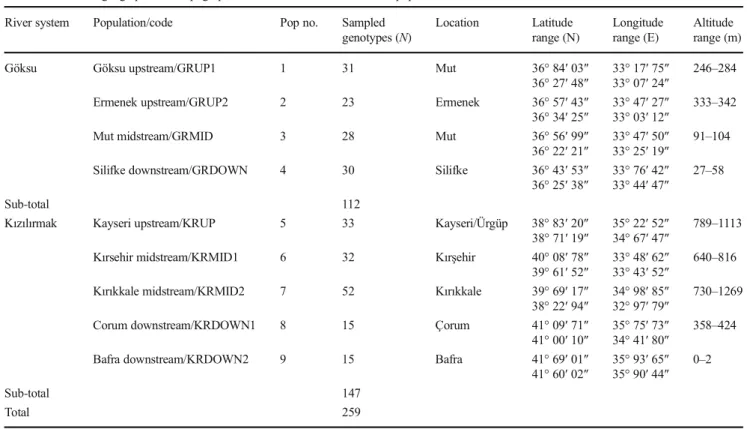
Two hundred and fifty-nine S. alba L. genotypes (trees) were sampled from nine populations located in the Göksu and Kızılırmak river systems. There were 112 genotypes representing four populations from the Göksu river while 147 genotypes were sampled from five populations in the Kızılırmak river system. The sampled populations were se-lected to represent the “upstream,” “middle, “and “down-stream” sections of the rivers. Since willows are usually clon-ally reproduced and dispersed, a minimum distance (200 m) among the genotypes within a population was taken into con-sideration to avoid sampling from the same cohort. Global positioning system (GPS) was used to obtain the location of sampled trees during field work (Table1and Fig.1).
DNA extraction, quantification, and selection
of simple sequence repeat markers
Freshly collected leaves from selected genotypes from two river systems were put in silica gels in the field until they were brought to the laboratory. Silica gel-dried leaves were crushed and powdered with liquid nitrogen in mortar by pestle to be used later in DNA extraction. The samples were stored in a deep freezer at− 80 °C until DNA isolation. Genomic DNA was extracted with a modified cetyltrimethylammonium bro-mide (CTAB) protocol (Doyle and Doyle 1987). The NanoDrop spectrophotometer (NanoDrop 2000, Thermo Scientific, USA) was used to quantify the concentration of DNA. The template DNA concentration was diluted to 20 ng/μl before it was used.
Twenty well-amplified and polymorphic microsatellite loci (simple sequence repeat markers or SSR loci) were selected from literature (Supplementary Table1). The SSR loci coded as Sare03, Sare04, Sare08, SB24, SB80, SB194, SB96, SB233, SB243, SB265, SB493, W293, W784, gSIMCT011, gSIMCT024, and gSIMCT052 were specific to willow spe-cies (Lian et al.2001; Barker et al.2003; Stamati et al.2003; Lin et al.2009; Lauron-Moreau et al.2013) while the markers coded as WPMS18, PMGC2709, PMGC2889, and PMGC2163 were developed for poplar species (Web Site of International Populus Genome Consortium2014). Fifteen of these SSR markers were tested and used in S. alba for the first time in the current study (Table2). After optimization of re-action components and PCR cycles, forward primers of all the
loci were resynthesized fluorescently by the SACEM Company (Ankara) in order to discriminate polymerase chain reaction (PCR) products during the verification of fragment analysis.
For Sare03, Sare04, Sare08, SB80, gSIMCT011, gSIMCT052, and PMGC2163 SSR loci, the PCR
reactions were performed with a 20-μl total volume con-taining 5 μl 5× HOTFIRE Pol Blend Master Mix (here on, it is referred to as Master Mix for short (Solis BioDyne, Tartu, Estonia)), 0.8 μl of each primer pair, 6μl template DNA (20 ng/μl), and 7.4 μl double distilled water in 0.2-ml sterile Eppendorf tubes. For SB194, Table 1 Detailed geographic and topographic information on studied S. alba populations
River system Population/code Pop no. Sampled genotypes (N) Location Latitude range (N) Longitude range (E) Altitude range (m)
Göksu Göksu upstream/GRUP1 1 31 Mut 36° 84′ 03″ 33° 17′ 75″ 246–284
36° 27′ 48″ 33° 07′ 24″
Ermenek upstream/GRUP2 2 23 Ermenek 36° 57′ 43″ 33° 47′ 27″ 333–342 36° 34′ 25″ 33° 03′ 12″
Mut midstream/GRMID 3 28 Mut 36° 56′ 99″ 33° 47′ 50″ 91–104 36° 22′ 21″ 33° 25′ 19″
Silifke downstream/GRDOWN 4 30 Silifke 36° 43′ 53″ 33° 76′ 42″ 27–58 36° 25′ 38″ 33° 44′ 47″
Sub-total 112
Kızılırmak Kayseri upstream/KRUP 5 33 Kayseri/Ürgüp 38° 83′ 20″ 35° 22′ 52″ 789–1113 38° 71′ 19″ 34° 67′ 47″
Kırsehir midstream/KRMID1 6 32 Kırşehir 40° 08′ 78″ 33° 48′ 62″ 640–816 39° 61′ 52″ 33° 43′ 52″
Kırıkkale midstream/KRMID2 7 52 Kırıkkale 39° 69′ 17″ 34° 98′ 85″ 730–1269 38° 22′ 94″ 32° 97′ 79″
Corum downstream/KRDOWN1 8 15 Çorum 41° 09′ 71″ 35° 75′ 73″ 358–424 41° 00′ 10″ 34° 41′ 80″
Bafra downstream/KRDOWN2 9 15 Bafra 41° 69′ 01″ 35° 93′ 65″ 0–2 41° 60′ 02″ 35° 90′ 44″
Sub-total 147
Total 259
Fig. 1 Map showing the locations of studied populations. Please see Table1for the population codes (population numbers 1 through 4 and 5 through 9 represent Göksu and Kızılırmak river system, respectively)
SB96, SB233, SB265, W293, and W784 SSR loci, the reaction mixture contained 4μl Master Mix, 0.5 μl each primer pair, and 10 μl water. On the other hand, 5 μl Master Mix, 0.5 μl of each primer pair, and 9 μl water were used for SB24, SB243, SB493, gSIMCT024, WPMS18, PMGC2709, and PMGC2889 SSR loci. Five-microliter template DNA (20 ng/μl) were added to PCR reactions involved in the last two groups of SSR loci.
PCR cycles were followed as 3 min at 94 °C for initial denaturation, then 30 cycles at 94 °C for 1 min of addi-tional denaturation, at 50–55 °C (Ta) for 30 s of anneal-ing, and at 72 °C for 30 s of extension and a final exten-sion at 72 °C for 5 min for SB24, SB80, SB194, SB196, SB233, SB243, SB265, SB493, W293, and W784 loci. For Sare03, Sare04, Sare08, gSIMCT011, gSIMCT024, gSIMCT052, WPMS18, PMGC2709, PMGC2889, and PMGC2163 loci, cycling conditions were at 94 °C for 3 min, then 30 cycles at 94 °C for 30 s, at 52–58 °C (Ta) for 45 s, and at 72 °C for 1 min and a final extension period at 72 °C for 10 min (Eppendorf Mastercycler, Eppendorf, Canada).
Amplification products (5μl) were loaded in 3% aga-rose gel prepared with 1× Tris-Borate-EDTA (TBE) buffer solution and run in 1× TBE (0.4 M Tris Boric Acid
EDTA) buffer at ~ 120 mA for at least 30 min. The am-plified products were visualized under UV light (Vilber Lourmat, France). Thermo Scientific GeneRuler Low Range DNA Ladder was used to determine the product size. Finally, the gels were photographed by Alpha Imager Gel Documentation System (Alpha Innotech, San Leandro, CA, USA).
Assay procedure for SSR fragment analysis was done by the BM Labosis Company (Çankaya, Ankara). Analyses of the samples were performed with the Applied Biosystems 3730xl DNA Analyzer (Applied Biosystems, Foster City, CA, USA), using an internal standard size as a marker (The GeneScan 400HD ROX dye). Allele sizes were checked and scored manually from electropherograms using the Peak Scanner Software 2.0 (Applied Biosystems Inc., Foster City, CA).
Analysis of data
The distinct and identical multilocus genotypes (MLGs) among all sampled genotypes were determined with the GenClone 2.0 software (Arnaud-Haond and Belkhir2007). The MICRO-CHECKER software with Bonferroni-adjusted 95% confidence interval was used to detect the existence of Table 2 Descriptive statistics by loci
SSR locus N Na ± Se Ne ± Se Ar PIC Ho ± Se He ± Se FIS± Se Sare03 28.78 ± 3.70 14.00 ± 0.62 7.83 ± 0.49 10.59 0.92 0.80 ± 0.04 0.87 ± 0.01 0.08 ± 0.05 Sare04 28.78 ± 3.70 11.78 ± 1.01 6.19 ± 0.47 9.92 0.90 0.78 ± 0.05 0.83 ± 0.01 0.06 ± 0.06 Sare08 28.78 ± 3.70 11.33 ± 0.96 6.51 ± 0.43 9.03 0.88 0.78 ± 0.06 0.84 ± 0.01 0.07 ± 0.07 SB24 28.78 ± 3.70 8.56 ± 0.47 4.65 ± 0.37 7.72 0.85 0.74 ± 0.08 0.77 ± 0.02 0.04 ± 0.10 SB80 23.33 ± 3.74 3.11 ± 0.26 1.74 ± 0.18 3.16 0.35 0.35 ± 0.08 0.37 ± 0.07 0.01 ± 0.09 SB194 28.78 ± 3.70 3.00 ± 0.00 2.23 ± 0.06 2.82 0.47 0.59 ± 0.05 0.55 ± 0.01 −0.08 ± 0.09 SB196 28.78 ± 3.70 1.67 ± 0.17 1.05 ± 0.02 1.37 0.05 0.05 ± 0.02 0.05 ± 0.02 −0.04 ± 0.01 SB233 28.67 ± 3.70 10.78 ± 0.97 3.79 ± 0.32 7.15 0.74 0.73 ± 0.03 0.72 ± 0.02 −0.02 ± 0.04 SB243 28.67 ± 3.70 4.56 ± 0.18 3.07 ± 0.12 3.90 0.64 0.86 ± 0.03 0.67 ± 0.01 −0.29 ± 0.05 SB265 28.78 ± 3.70 3.11 ± 0.26 1.47 ± 0.08 2.66 0.30 0.28 ± 0.04 0.30 ± 0.04 0.08 ± 0.05 SB493 28.78 ± 3.70 4.22 ± 0.46 2.38 ± 0.19 3.70 0.55 0.59 ± 0.06 0.55 ± 0.05 −0.08 ± 0.04 W293 28.67 ± 3.70 6.44 ± 0.58 2.88 ± 0.14 5.39 0.66 0.95 ± 0.02 0.65 ± 0.02 −0.48 ± 0.05 W784 28.78 ± 3.70 3.56 ± 0.24 2.30 ± 0.06 2.88 0.46 1.00 ± 0.00 0.56 ± 0.01 −0.78 ± 0.04 gSlMCT011 28.78 ± 3.70 3.89 ± 0.68 1.44 ± 0.11 3.19 0.28 0.21 ± 0.06 0.27 ± 0.06 0.23 ± 0.11 gSlMCT024 27.56 ± 3.59 4.67 ± 0.17 3.48 ± 0.20 4.39 0.71 0.60 ± 0.06 0.70 ± 0.02 0.15 ± 0.07 gSlMCT052 28.22 ± 3.42 13.67 ± 1.08 6.80 ± 0.56 9.57 0.88 0.75 ± 0.03 0.84 ± 0.02 0.10 ± 0.04 WPMS18 28.78 ± 3.70 4.00 ± 0.53 1.54 ± 0.14 3.30 0.34 0.23 ± 0.06 0.31 ± 0.06 0.32 ± 0.08 PMGC2709 28.78 ± 3.70 10.89 ± 0.9 4.97 ± 0.59 8.90 0.86 0.76 ± 0.03 0.77 ± 0.03 0.02 ± 0.03 PMGC2889 28.78 ± 3.70 9.89 ± 0.70 5.00 ± 0.30 7.45 0.81 0.87 ± 0.04 0.80 ± 0.01 −0.10 ± 0.05 PMGC2163 28.78 ± 3.70 6.56 ± 0.88 2.82 ± 0.19 5.45 0.63 0.88 ± 0.04 0.63 ± 0.02 −0.40 ± 0.06 Mean 28.40 ± 0.78 6.98 ± 0.32 3.61 ± 0.16 0.61 0.64 ± 0.02 0.60 ± 0.02 −0.06 ± 0.02 N = mean number of individuals with amplification, Na = mean number of different alleles, Ne = mean number of effective alleles, Ar = allelic richness, PIC = polymorphic information content, Ho = observed heterozygosity, He = expected heterozygosity, FIS= inbreeding coefficient, Se = standard errors
genotyping failure such as null alleles, stuttering, large allele dropout, and typographic errors caused by DNA degradation, low DNA concentrations, and primer site mutations. The fre-quencies of null alleles (r) according to the Brookfield (1996) method were also estimated. Probability test (Guo and Thompson1992) for each locus in the populations was con-ducted to test the Hardy-Weinberg equilibrium (HWE) via GENEPOP software (Raymond and Rousset1995; Rousset
2008). Linkage disequilibrium (LD) was estimated with the R poppr package (Kamvar et al.2014) based on the index of association (Brown et al.1980) proposed by Agapow and Burt (2001).
To be able to apply numerical analysis to latitude and lon-gitude values, they were converted from“degrees/minutes/ seconds (DMS)” units to “decimal degrees (DD)” units. Latitude, longitude, and altitude were evaluated as indepen-dent variables for He and Ho. Analysis of variance (ANOVA) was conducted to test if these topographical variables have a significant effect on estimated He and Ho.
To evaluate the amount of genetic differentiation among the nine populations, the population pairwise FST values (Slatkin 1995), their statistical significance, and the number of migrants (Nm) were estimated by using ARLEQUIN software (Excoffier and Lischer
2010) with the number of different allele distance meth-od (number of permutations set to 1000).
The genetic structure of populations was determined by using the STRUCTURE software (Pritchard et al. 2000; Falush et al.2003,2007; Hubisz et al.2009). Bayesian cluster-ing methods were applied in two different assumptions: (i) one with a priori identification associated with population location and (ii) the other without a priori identification of specific grouping. Admixture ancestry and correlated allele frequency models (withλ = 1) were used in all runs. Run parameters consisted of 10 replicates each with 250,000 Markov Chain Monte Carlo (MCMC) replications after 50,000 burning length for K = 1 to 9 clusters. With the help of the STRUCTURE HARVESTER which is a web-based software, theΔK statistics (true number of clusters) were calculated according to Evanno et al. (2005) and the graphic representation of these statistics was obtained by the CLUster Matching and Permutation Program (CLUMPP) software (Earl and vonHoldt2012). The results from the CLUMPP were then used to find out the aver-age membership coefficient matrices (Jakobsson and Rosenberg2007). The output data of the CLUMPP was directly used as input data into the POPHELPER program (Francis
2017) to display graphical representation of population clusters. Lastly, a principal coordinate analysis (PCoA = classical mul-tidimensional scaling, CMDS) was used to get further confir-mation of the results of STRUCTURE analysis with the help of GenAlEx software (Peakall and Smouse2012). The software helps to discover and visualize not only the similarities but also the dissimilarities of the data.
Analyses of molecular variance (AMOVA) were performed to partition the total genetic variation of white willow into com-ponents due to variation among river systems, among popula-tions within a river system, and among genotypes within popu-lations in a hierarchical form. To confirm the population subdi-visions that were assumed by STRUCTURE, AMOVA was again carried out separately for Göksu and Kızılırmak rivers with the use of ARLEQUIN software (Excoffier and Lischer2010).
Results
SSR loci and data assessment
Twenty SSR loci were found to be useful for detecting poly-morphism in 259 white willow populations. Fifteen of 20 SSR loci were successfully amplified in white willow for the first time (Table2). The percentage of missing data was found to be 1.3%. As reported by the results of MICRO-CHECKER software, there was no confirmation of mistyped allele sizes, typographic errors, and deviations from regular repeat motifs. Likewise, scoring errors due to large allele dropout were not observed in any locus across the nine populations.
Among the studied 20 SSR loci, it appeared that there were some loci with slightly high null allele frequencies for partic-ular populations (Supplementary Table2). Because of this, all analyses were carried out with and without null allele possessing loci in order to assess the genetic diversity and genetic differentiation of populations. Since there was no dis-tinct change in estimated genetic diversity parameters, all loci were included in the analyses. Furthermore, after screening the studied genotypes with 20 loci, the results clearly indicated that there was no duplicated genotype existing in the sampled populations.
LD was assessed for the studied loci. The results revealed that all loci were in weak LD (rd= 0.0219 at P < 0.001). The rd value did not fall into the expected range from permutation tests (Fig.2).
Genetic diversity of loci
When descriptive statistics by loci were examined, all loci were found to be polymorphic (Table 2). The means of ob-served and effective alleles were estimated as 6.98 and 3.61 alleles per locus, respectively. The SSR loci Sare03 and gSlMCT052 had the highest mean observed and effective numbers of alleles while the locus SB196 had the lowest values. Allelic richness (Ar) and polymorphic information content (PIC) of loci indicated that they varied in informative-ness. Allelic richness varied from 1.37 in SB196 to 10.59 in Sare03 while PIC values ranged from 0.05 to 0.92 with a mean value of 0.61. There was only one locus (SB196) classified as low informative markers with the value of PIC < 0.25. Six of
the 19 loci were evaluated to be moderately informative and the remaining loci to be highly informative (the PIC values exceeding 0.5). The changes in Ar and PIC values among different SSR loci follow the pattern as the heterozygosity level of loci. As a result, it was clear that the most diverse loci were found to be Sare03, Sare04, Sare08, and gSlMCT052 (Table2).
The observed heterozygosity for the locus across popula-tions varied from 0.05 in SB196 to 1.00 in W784 with an average of 0.64, while expected heterozygosity ranged from 0.05 in SB196 to 0.87 in Sare03 with an average of 0.60. The excess of heterozygosity was observed for 9 out of 20 loci, whereas the rest had positive FISvalues (Table2). It was found that the loci Sare04, SB24, SB243, W293, W784, gSlMCT011, gSlMCT024, WPMS18, PMGC2889, and PMGC2163 showed significant deviations from the Hardy-Weinberg equilibrium. The highest FSTvalues were estimated for the loci SB24, SB80, SB265, SB493, and PMGC2709, which contributed greatly to the differentiation of populations. The mean number of migrants (NM) was found to be 5.00 with the highest contribution from locus W784 and the lowest from locus SB265 (Supplementary Table3).
Genetic diversity of populations
Polymorphism in populations of the Göksu and Kızılırmak river systems was high (100% for Göksu and 96% for Kızılırmak). The mean observed number of alleles (Na) was 7.08 in the Göksu and 6.91 in the Kızılırmak river popula-tions. The means of effective number of alleles (Ne) were 3.69 (ranged from 3.50 to 3.85) in the Göksu and 3.54 (ranged from 3.06 to 3.85) in the Kızılırmak river populations. The highest number of private alleles was found in the upstream popula-tion of the Göksu (GRUP1) and the middle populapopula-tion (KRMID2) of the Kızılırmak rivers.
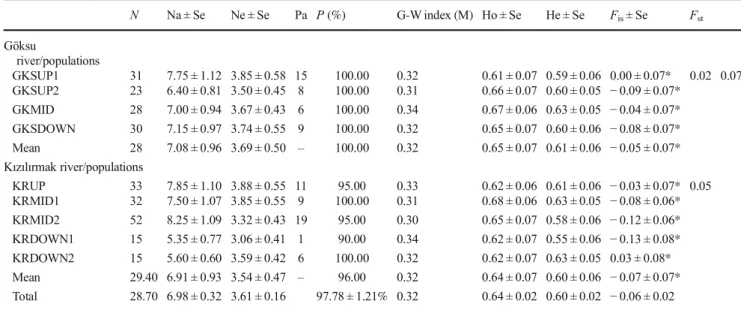
In general, all studied populations had moderately high genetic diversity. The mean observed heterozygosity value of the Göksu river populations was 0.65 and varied from 0.61 in the upstream population (GRUP1) to 0.67 in the mid-dle population (GRMID). Likewise, the mean observed het-erozygosity value was 0.64 for the Kızılırmak river popula-tions. It ranged from 0.62 (KRUP and KRDOWN1, KRDOWN2) to 0.68 (KRMID2). The mean of expected het-erozygosity was moderate and ranged from 0.59 to 0.63 (av-erage = 0.61) in the Göksu river populations and from 0.55 to 0.63 (average = 0.60) in the Kızılırmak river populations. All studied populations showed significant departure from Hardy-Weinberg equilibrium frequencies. The excess of heterozy-gosity was observed across all populations except for the downstream population of the Kızılırmak (KRDOWN2) and the upstream population of the Göksu river (GRUP1). The inbreeding coefficients (FIS) for each population within river systems indicated that there was excess of heterozygotes (FIS=− 0.05 in the Göksu and − 0.07 in the Kızılırmak river populations). Only one population from the Kızılırmak river system showed a slight presence of inbreeding (FIS= 0.03). The genetic differentiation (FST) between two river systems was moderate (0.07). About 93% of genetic variation occurred within the river systems. Low to moderate levels of genetic differentiation existed among populations within the river sys-tems (FST= 0.02 among the populations of Göksu river and FST= 0.05 among the Kızılırmak river populations) (Table3). The Garza-Williamson indices indicate whether a popula-tion experienced a past genetic bottleneck or not (Garza and Williamson 2001). All estimated Garza-Williamson index values for each of the nine populations were lower than < 0.68 which is the critical value. It was clear that there was a past reduction in effective population sizes of the species in both river systems (Table3).
Effects of geographic factors such as longitude, latitude, and altitude on genetic diversity of white willow populations Fig. 2 Graph showing the
estimated overall linkage disequilibrium. The rdis the
standardized index of association. Blue-dashed line indicates observed value
were represented in Fig.3. Analysis of variance with these variables indicated that these geographic factors did not have significant effects on estimated He or Ho of the studied pop-ulations in the Kızılırmak river system (P > 0.05).
Genetic differentiation and structuring of populations
Pairwise genetic distance values (FST) among populations var-ied from 0.010 (between middle populations (KRMID1, KRMID2 of the Kızılırmak river)) to 0.11 (between down-stream populations (KRDOWN1, KRDOWN2 of the Kızılırmak river)). The downstream populations of the Kızılırmak river (KRDOWN1, KRDOWN2) were genetically most distant to other populations. The highest number of mi-grants (NM) was found between the upstream (GRUP1) and downstream populations (GRDOWN) of the Göksu river as
20.62 and between middle populations (KRMID1, KRMID2) of Kızılırmak as 24.38 (Supplementary Table4).
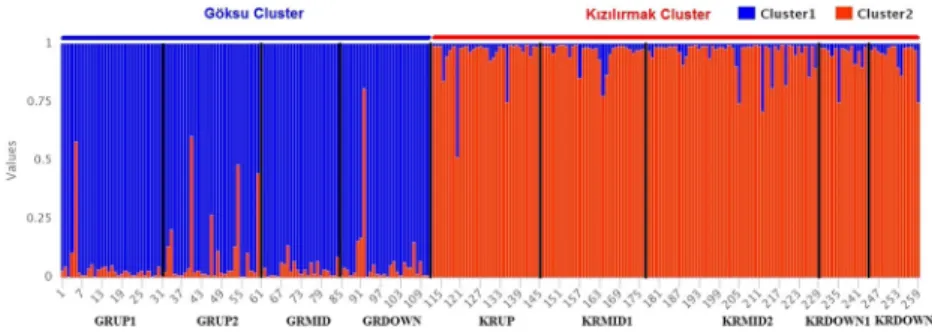
There were no differences in the estimation of delta K values between the two methods (with and without prior information on the geographic distribution of ge-notypes) when data from river systems were combined. The result of the analysis pointed out the existence of two main clusters based on the delta K value of nine populations from the Göksu and the Kızılırmak rivers. The graphical representation of delta K with the Evanno method is shown in Supplementary Fig. 1. The first cluster consisted of members of the Göksu river popu-lations (97.47% of genotypes) except for three geno-types which ended up in the Kızılırmak river while all genotypes of the Kızılırmak river were placed into the second cluster with a 100% membership value. It was Table 3 Estimated genetic diversity parameters for studied populations in the Göksu and the Kızılırmak river systems
N Na ± Se Ne ± Se Pa P (%) G-W index (M) Ho ± Se He ± Se Fis± Se Fst Göksu river/populations GKSUP1 31 7.75 ± 1.12 3.85 ± 0.58 15 100.00 0.32 0.61 ± 0.07 0.59 ± 0.06 0.00 ± 0.07* 0.02 0.07 GKSUP2 23 6.40 ± 0.81 3.50 ± 0.45 8 100.00 0.31 0.66 ± 0.07 0.60 ± 0.05 − 0.09 ± 0.07* GKMID 28 7.00 ± 0.94 3.67 ± 0.43 6 100.00 0.34 0.67 ± 0.06 0.63 ± 0.05 − 0.04 ± 0.07* GKSDOWN 30 7.15 ± 0.97 3.74 ± 0.55 9 100.00 0.32 0.65 ± 0.07 0.60 ± 0.06 − 0.08 ± 0.07* Mean 28 7.08 ± 0.96 3.69 ± 0.50 – 100.00 0.32 0.65 ± 0.07 0.61 ± 0.06 − 0.05 ± 0.07* Kızılırmak river/populations KRUP 33 7.85 ± 1.10 3.88 ± 0.55 11 95.00 0.33 0.62 ± 0.06 0.61 ± 0.06 − 0.03 ± 0.07* 0.05 KRMID1 32 7.50 ± 1.07 3.85 ± 0.55 9 100.00 0.31 0.68 ± 0.06 0.63 ± 0.05 − 0.08 ± 0.06* KRMID2 52 8.25 ± 1.09 3.32 ± 0.43 19 95.00 0.30 0.65 ± 0.07 0.58 ± 0.06 − 0.12 ± 0.06* KRDOWN1 15 5.35 ± 0.77 3.06 ± 0.41 1 90.00 0.34 0.62 ± 0.07 0.55 ± 0.06 − 0.13 ± 0.08* KRDOWN2 15 5.60 ± 0.60 3.59 ± 0.42 6 100.00 0.32 0.62 ± 0.07 0.63 ± 0.05 0.03 ± 0.08* Mean 29.40 6.91 ± 0.93 3.54 ± 0.47 – 96.00 0.32 0.64 ± 0.07 0.60 ± 0.06 − 0.07 ± 0.07* Total 28.70 6.98 ± 0.32 3.61 ± 0.16 97.78 ± 1.21% 0.32 0.64 ± 0.02 0.60 ± 0.02 − 0.06 ± 0.02
N = number of individuals, Na = mean number of different alleles, Ne = mean number of effective alleles, Pa = private alleles, %P = percentage of polymorphic loci, G-W index (M) = Garza-Williamson index, Ho = observed heterozygosity, He = expected heterozygosity, Fst= fixation index, Fst= the
inbreeding coefficient within subpopulations, Se = standard errors of estimates *P < 0.05
Fig. 3 The scatter plots and best fit lines (linear regression lines) represent Ho (observed
heterozygosity) and He (expected heterozygosity) vs. latitude, longitude, and altitude of the studied population in the Göksu (a) and Kızılırmak rivers (b)
clear that there was a significant spatial effect on the genetic structuring of populations from two river sys-tems (Fig. 4).
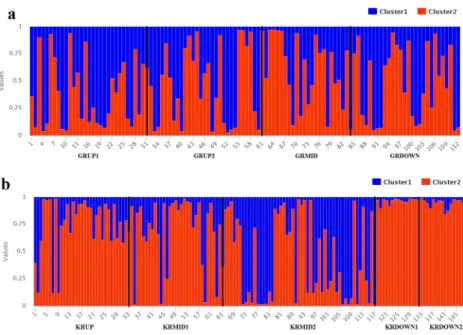
When STRUCTURE analysis for only the Göksu riv-er was carried out, 112 genotypes from four diffriv-erent populations were placed into two major clusters (Supplementary Fig. 2). Fifty-seven of the 112 sampled genotypes were in the first cluster and 55 in the second cluster. Two clusters did not correlate with the geo-graphic origins of the genotypes with regard to the pro-portion of membership (Fig. 5). When the results of STRUCTURE analysis within the Kızılırmak river sys-tem were taken into consideration, the maximum delta K was detected as 2 (Supplementary Fig. 2). Thirty-nine of 147 sampled genotypes formed the first cluster, whereas 108 genotypes were in the second cluster. All genotypes from the downstream populations were placed in the second cluster (Fig. 5).
The results of PCoA with nine populations revealed that 74% of the total variation was explained by the first three axes with 30%, 23%, and 21%, respectively. The Göksu and Kızılırmak river populations were separated by the first prin-cipal coordinate (30%). However, one downstream population (KRDOWN1) was an exception in that it was separated by the first (30%) and second axes (23%). This downstream popula-tion (KRDOWN1) seemed to be the most distant to the other populations (Fig.6). The genetic grouping of populations from both river systems followed the same results from the PCoA when the analyses were repeated by STRUCTURE and pairwise FSTbased on neighbor joining method.
Partition of total genetic diversity
The results of global locus-by-locus (no. of different alleles, FST) analyses of molecular variance (AMOVA) revealed that there was a significant differentiation (P < 0.001) among nine populations from the two river systems. The fixation index values (FST= 0.07) were significant and consistent with the pairwise FST results. Small portion of the total variation
was found to be among river systems (3.27%) and among the population within the river system (3.47%). The great portion of the total variation was among genotypes within the population in the two rivers (93.26%) (Table4).
The Göksu river populations were subdivided into two ma-jor groups depending on both the distance method and the Bayesian analysis. The Ermenek population (GRUP2), tribu-tary of the Göksu river, formed one group while the upstream (GRUP1), middle (GRMID), and downstream (GRDOWN) populations formed another group. When AMOVA was car-ried out later, the total variance that accounted for river sec-tions was found to be insignificant (0.86%). A great portion of the total variance was found to be among genotypes within the populations of river sections. Based on both the distance method and the Bayesian analysis, two major groups were also detected in the Kızılırmak river system. One group was composed of the upstream (KRUP) and middle populations (KRMID1 and KRMID2). The other group included the downstream populations (KRDOWN1 and KRDOWN2). AMOVA results showed that 93.94% of the total variation was attributed to genotypes within the population. Only 3.44% and 2.82% of the total variation were due to popula-tions within river secpopula-tions and among river secpopula-tions, respec-tively (Table4).
Discussion
This is the first study dealing with the magnitude and struc-turing of genetic diversity of white willow populations in two ecologically different river systems exposed to intensive hu-man activities for so long. The study revealed important find-ings on the structuring of genetic diversity of populations and ecological and evolutionary factors that affect the genetic composition of the species in connection with the establish-ment of future conservation and breeding strategies.
Studied SSR loci developed for different Salix species ap-peared to be polymorphic and useful for genetic characteriza-tion of genetic resources of white willow. Allele size ranges of
Fig. 4 Graphical representation of the cluster membership of 259 S. alba genotypes from nine populations sampled from the Göksu and Kızılırmak rivers. The graph indicates two inferred clusters and their associations
with populations. The different clusters were represented with different colors. Vertical lines separate the populations within the river systems. Please see Table1for the codes of the populations
SSR loci identified in the current study are compatible with those reported in the previous studies (King et al.2010; Singh et al.2014; Rungis et al.2017). Some loci indicated that there may be presence of null alleles, which were specific to certain populations. However, inclusion or exclusion of these loci did not affect the estimation of genetic diversity parameters. PCR failure caused by inconsistent DNA template quality or low template quantity is the potential causes of null alleles in this study. No clonal duplication among sampled genotypes was detected in the two river systems. This finding is not surpris-ing since similar results were reported in other Salix species (Stamati et al.2007; Steltzer et al.2008; Douhovnikof et al.
2010; Kikuchi et al.2011; Sitzia et al.2018). Even though Salix species are reproduced easily with vegetative materials and transferred downstream of rivers (Rood et al. 2003; Kuzovkina et al. 2008), they rarely produce root suckers. Thus, it was obvious from the results of the current study that white willow is dispersed mainly by sexual reproduction in both the Göksu and Kızılırmak river systems.
In the current study, 16 of the 20 SSR loci exhibited high allelic richness (> 0.3). Only locus SB196 was found to be less
informative (< 0.25). Thirteen of 20 SSR loci were informa-tive with high PIC values (> 0.5). We recommend that the Sare03, Sare04, Sare08, SB24, SB233, SB243, W293, gSIMCT024, gSIMCT052, PMGC2709, PMGC2889, and PMGC2163 loci can be used effectively in the future genetic studies dealing with white willow or other related willow spe-cies. Although SB194, SB243, and SB80 loci had higher al-lelic richness parameters (Ne, PIC, and He), previous studies (King et al.2010; Singh et al.2013a,b,2014; Rungis et al.
2017) did not report similar results due to differences in the number of SSR loci, sample sizes of populations, and their geographic locations. Also, geographically distant popula-tions which are exposed to different environmental condipopula-tions and human-related activities may have contributed to a differ-ent evolutionary history in white willow. The excess of het-erozygosity was observed in 9 out of 20 loci. Five of these deviated significantly from the Hardy-Weinberg equilibrium. Excess of heterozygosity may be due to selection and dispers-al of trees with heterozygote superiority by human-assisted migration. There were also five loci with excess of homozy-gosity, significantly deviating from the Hardy-Weinberg equi-librium due to inbreeding and the population sub-structuring caused by loss and fragmentation of natural habitats. The highest contributions to mean FSTvalues, in turn, differentia-tion of populadifferentia-tions, were found to be from the loci SB24, SB80, SB265, SB493, and PMGC2709 with low number of migrants (NM). To reduce the cost of similar studies and to increase efficiency of studies in the future, these loci could be preferred to study genetic characterization of white willow populations.
All studied populations were found to be highly polymor-phic with the presence of a high level of allelic diversity. The highest number of private alleles was found in the upstream population of the Göksu river (GRUP1, 15 private alleles) and Fig. 5 a Graphical representation
of the cluster membership of 112 S. alba genotypes sampled from the Göksu river.b Graphical representation of the cluster membership of 147 S. alba genotypes sampled from the Kızılırmak river. Please see Table1for the codes of the populations
Fig. 6 Principal coordinate analysis (PCoA) with nine populations based on Nei’s (1972) genetic distances showing differentiation of populations. Please see Table1for the codes of the populations
in the middle population (KRMID2, 19) of the Kızılırmak river. Apparently, these populations maintained original ge-netic diversity through harboring larger intact habitats. They may be considered as the major genetic diversity areas along two river systems for future genetic resource conservation or selection practices related to tree improvement.
In general, high levels of genetic diversity were found in populations of both the Göksu and Kızılırmak rivers. Mean observed heterozygosity (Ho = 0.64) was found to be higher than mean expected heterozygosity (0.60). This was also true for almost all studied populations of the river systems except for the downstream population (KRDOWN2) in the Kızılırmak river. Previous studies conducted with Salix spe-cies also reported similar results, that is, excess of heterozy-gosity (Salix eriocephala, Lauron-Moreau et al.2013; Salix caprea, Perdereau et al.2014; Salix hukaoana, Kikuchi et al.
2011; Salix daphnoides, Sochor et al.2013). This high hetero-zygosity could be due to negative assortative mating, selection (heterozygote advantage), or the proportion of heterozygote genotypes in founder populations. Excess of heterozygosity was also evident from estimated Garza-Williamson indices for populations (less than critical value of 0.68). Low values sug-gested that a reduction in population size occurred due to an experienced genetic bottleneck in the past coupled with ran-dom genetic drift eliminating low frequency alleles. Allelic diversity is generally lost faster than heterozygosity when a population undergoes bottleneck (Nei et al. 1975). Furthermore, wind pollination, seed dispersal via animals, and vegetative material movements by locals could also
contribute to increased heterozygosity in studied white willow populations.
In unfragmented natural river ecosystems, higher genetic diversity could be expected in mid-streams as well as down-stream populations compared to updown-stream populations if seed and vegetative propagules are freely dispersed in river sys-tems. This pattern seemed to be true for only middle popula-tions of both river systems. Not observing a similar pattern in downstream populations may be explained by the lack of suit-able habitats or interruptions of the natural river ecosystems by hydroelectric power stations and irrigation dams. Although downstream accumulation of genetic diversity in some species has been reported in different river systems (Lundqvist and Andersson 2001; Liu et al. 2006), the current study and studies with other Salix species in the literature have not supported these findings except for the study carried out by Kikuchi et al. (2011) on S. hukaoana. Discrepancies between the results of previous and current studies may be due to var-iation in effectiveness of seed and clonal material dispersal, effective population size, and degree of fragmentation in river ecosystems.
The genetic differentiation pattern of the populations within and between two river systems was found to be similar in all three analyses (STRUCTURE, AMOVA, and PCoA). Two hundred and fifty-nine white willow ge-notypes were placed to two genetic clusters by genetic STRUCTURE analysis. It appeared clearly that white wil-low populations in two different river basins originated from two different founder populations. Genetic Table 4 Analyses of molecular variance (AMOVA) based on SSR loci S. alba
Sum of squares Variance components Percentage of total variation Fixation indices Source of variation
Among rivers 74.69 0.22 3.27 FCT= 0.03*
Among populations within river 129.35 0.23 3.47 FSC= 0.04*
Within populations 3093.18 6.14 93.26 FST= 0.07*
Total 3297.22 6.58 100 –
Source of variation/Göksu river
Among river sections 15.21 0.05 0.86 FCT= 0.008*
Among populations within river 24.56 0.10 1.64 FSC= 0.02*
Within populations 1353.19 6.19 97.50 FST= 0.02
Total 1392.96 6.34 100 –
Source of variation/Kızılırmak river
Among river sections 31.71 0.18 2.82 FCT= 0.03*
Among populations within river 57.87 0.22 3.44 FSC= 0.04*
Within populations 1739.99 6.08 93.94 FST= 0.06*
Total 1829.57 6.49 100 –
FCT= differences among river systems, FSC= difference among populations within rivers, FST= differences within populations, FCT= differences among
river sections, FSC= difference among populations within river sections, FST= differences within populations
differences are often correlated with geographic distance between populations, so it seems that geographical dis-tance has an important effect on genetic differentiation of white willow populations in the current study. Geographical barriers such as mountains (Taurus Mountain ranges) are likely to contribute to the differen-tiation of populations of two river systems by preventing extensive gene flow (FST= 0.07). Although genetic differ-entiation between white willow populations of Göksu and Kızılırmak river systems was found to be moderate (FST= 0.07), a low level of genetic admixture was still present in reproductively isolated populations of two riv-ers. Similar previous studies dealing with different willow species have reported the genetic differentiation of popu-lations between river systems as low or moderate (Puschenreiter et al. 2010; Trybush et al. 2012; Sochor et al. 2013; Berlin et al. 2014; Perdereau et al. 2014; Ukwubile et al. 2014). All members of the family Salicaceae generally display a low FST value among the populations when compared with other forest trees as a result of small, light seeds readily dispersed by wind and water and vegetative propagation (Ciftci et al. 2017). Although long-distance gene flow is not common in wil-low species due to short viability of the seed, human-mediated vegetative material movements lead to genetic similarities of populations at distant locations. The Göksu river basin is located on one of the major migratory routes of people moving from the Mediterranean region to cen-tral Turkey (where the Kızılırmak river cuts through its large part) or from central Turkey to the Mediterranean regions. The long history of human migration is likely to contribute genetic material exchange between the two river systems so that a low level of admixture between river systems is still present.
When genetic structures of the Göksu and Kızılırmak river systems were examined separately, the populations of both rivers seemed to have two genetic clusters with a high level of admixtures among populations, especially in the Göksu river. Altitude differences and the Gezende Dam may cause slight differentiation of the Ermenek pop-ulation from other poppop-ulations in the Göksu river. Despite the presence of geographic barriers, four populations of the Göksu river were genetically close to each other due to the high level of gene flow among subpopulations. Even though willow seeds stay viable only for a few weeks and v uln erable to long-distance dispersal (Maroder et al.2000), seed dispersal via hydrochory (dis-persion by water) and anemochory (dis(dis-persion by wind) (Imbert and Lefèvre2003) or a combination of both and human-assisted vegetative material dispersals may have played an important role in long-distance gene flow among white willow populations in the Göksu river system.
In the Kızılırmak river system, upstream (KRUP) and middle populations (KRMID1 and KRMID2) indicated higher admixture while the downstream populations (KRDOWN1 and KRDOWN2) had a homogeneous struc-ture. The reason for finding high admixture in the mid-stream populations (KRMID1 and KRMID2) could be explained by human-assisted material dispersal. These middle populations of the river are located in the Kızılırmak river section where human population and de-mand for fuel-wood and building material are high. Interestingly, the KRDOWN1 and KRDOWN2 popula-tions were found to be highly diverged within the Kızılırmak river system, as well as genetically the most distant ones to the populations of the two river systems. Considering the locations of these downstream popula-tions where there are less human impacts and habitat frag-mentations, it is comprehended that the genetic structure of the populations may not be affected extensively by human-assisted material dispersal. Additionally, several constructed dams (Boyabat, Altınkaya, and Derbent Dams) between the KRDOWN1 and KRDOWN2 popula-tions interrupting the natural river flow may have also contributed to their genetic differentiation.
Conclusion
& Fifteen of 20 SSR loci were used for the first time in the current study and 13 of them were highly informative. We recommend that these SSR loci could be effectively used in future genetic diversity and characterization studies in white willow.
& In general, high levels of genetic diversity were found in populations of both the Göksu and Kızılırmak river sys-tems; genetic diversity was especially high in middle pop-ulations of the rivers. There was an excess of heterozygos-ity in populations between and within river systems. These findings could be due to experienced past bottlenecks, extensive vegetative material movements, and habitat fragmentation in natural ecosystems of the rivers. & Although genetic differentiation between white willow
populations of the Göksu and Kızılırmak river systems was found to be moderate (FST= 0.07), a low level of genetic admixture was found in reproductively and geo-graphically isolated populations of the two rivers. The presence of the high level of genetic admixture within the river systems is most likely to be caused by human-mediated vegetative material movements.
& The results of the study demonstrate that white willow populations in two different river systems may have evolved from two different founder populations.
& This study provides important insights for efficient con-servation, management, utilization, and breeding of
genetic resources of economically valuable white willow. In order to conserve existing riparian ecosystems of wil-low species, effective legislation on the conservation issue should be established and a proper management policy should be put into action for setting up in situ conservation areas.
Data archiving statement The data used in the study have been formatted according to the requirements of Species Database of Tree Genes (http:// dendrome.ucdavis.edu/treegenes/). The data will be deposited in Tree Genes on acceptance.
Funding This study has been funded by the Scientific and Technological Council of Turkey (TUBITAK) (Project #: TOVAG 213O154).
References
Agapow P, Burt A (2001) Indices of multilocus linkage disequilibrium. Mol Ecol Notes 1(1–2):101–102
Argus GW (1997) Infrageneric classification of Salix (Salicaceae) in the New World. Syst Bot Monogr 52:1–121
Arnaud-Haond S, Belkhir K (2007) Genclone: a computer program to analyse genotypic data, test for clonality and describe spatial clonal organization. Mol Ecol Notes 7:15–17
Avcı M (1999) Türkiye’nin Doğal Söğütleri ve Coğrafi Dağılışları. İstanbul Üniversitesi Edebiyat Fakültesi Coğrafya Bölümü Coğrafya Dergisi 1:1–24
Ball J, Carle J, Lungo AD (2005) Contribution of poplars and willows to sustainable. FAO, Unasylva 56:3–9
Barker JHA, Pahlıch A, Trybush S, Edwards KJ, Karp A (2003) Microsatellite markers for diverse Salix species. Mol Ecol Notes 3: 4–6.https://doi.org/10.1046/j.1471-8286.2003.00332.x
Berlin S, Trybush SO, Fogelqvist J, Gyllenstrand N, Hallingbäck HR, Åhman I, Nordh NE, Shield I, Powers SJ, Weih M, Lagercrantz U, Rönnberg-Wästljung AC, Karp A, Hanle SJ (2014) Genetic diver-sity, population structure and phenotypic variation in European Salix viminalis L. (Salicaceae). Tree Genet Genomes 10:1595–1610.
https://doi.org/10.1007/s11295-014-0782-5
Brookfield JFY (1996) A simple new method for estimating null allele frequency from heterozygote deficiency. Mol Ecol 5:453–455 Brown AHD, Feldman MW, Nevo E (1980) Multilocus structure of
nat-ural populations of Hordeum spontaneum. Genetics 96:523–536 Ciftci A, Karatay H, Kücükosmanoğlu F, Karahan A, Kaya Z (2017)
Genetic differentiation between clone collections and natural popu-lations of European black poplar (Populus nigra L.) in Turkey. Tree Genet Genomes 13:69.https://doi.org/10.1007/s11295-017-1154-8
Davis PHR (1965-1988) Flora of Turkey and the East Aegean Islands, Univ. Press, Edinburgh, pp 694–716
Douhovnikof V, Goldsmith GR, Tape KD, Huang C, Sur N, Bret-Harte MS (2010) Clonal diversity in an expanding community of Arctic Salix spp. and a model for recruitment modes of Arctic plants. Arct Antarct Alp Res 42(4):406–411
Doyle JJ, Doyle JL (1987) A rapid DNA isolation procedure for small quantities of fresh leaf tissue. Phytochem Bull 19:11–15
Earl DA, vonHoldt BM (2012) STRUCTURE HARVESTER: a website and program for visualizing STRUCTURE output and implementing the Evanno method. Conser Genet Resour 4(2): 359–361
Esbrí JM, Cacovean H, Higueras P (2018) Usage proposal of a common urban decorative tree (Salix alba L.) to monitor the dispersion of gaseous mercury: a case study from Turda (Romania). Chemosphere 193:74–81.https://doi.org/10.1016/j.chemosphere.2017.11.007
Evanno G, Regnaut S, Goudet J (2005) Detecting the number of clusters of individuals using the software structure: a simulation study. Mol Ecol 14:2611–2620
Excoffier L, Lischer HEL (2010) Arlequin suite ver 3.5: a new series of programs to perform population genetics analyses under Linux and Windows. Mol Ecol Resour 10:564–567.https://doi.org/10.1111/j. 1755-0998.2010.02847.x
Falush D, Wirth T, Linz B, Pritchard JK, Stephens M, Kidd M, Blaser MJ, Graham DY, Vacher S, Perez-Perez GI, Yamaoka Y, Mégraud F, Otto K, Reichard U, Katzowitsch E, Wang X, Achtman M, Suerbaum S (2003) Traces of human migrations in Helicobacter pylori populations. Science 299(5612):1582–1585
Falush D, Stephens M, Pritchard JK (2007) Inference of population struc-ture using multilocus genotype data: dominant markers and null alleles. Mol Ecol Notes 7(4):574–578
Francis RM (2017) POPHELPER: a R package and web app to analyse and visualise population structure. Mol Ecol Resour 17(1):27–32.
https://doi.org/10.1111/1755-0998.12509
Garza J, Williamson E (2001) Detection of reduction in population size using data from microsatellite loci. Mol Ecol 10:305–318.https:// doi.org/10.1046/j.1365-294x.2001.01190.x
Guo SW, Thompson EA (1992) Performing the exact test of Hardy-Weinberg proportion for multiple alleles. Biometrics 48:361–372 Hardig TM, Anttila CK, Brunsfeld SJ (2010) A phylogenetic analysis of
Salix (Salicaceae) based on matK and ribosomal DNA sequence data. J Bot 2010:1–12
Hubisz JM, Falush D, Stephens M, Pritchard JK (2009) Inferring weak population structure with the assistance of sample group informa-tion. Mol Ecol Resour 9(5):1322–1332
Hughes RA, Inouye BD, Johnson MTJ, Underwood N, Vellend M (2008) Ecological consequences of genetic diversity. Ecol Lett 11:609–623 Imbert E, Lefèvre F (2003) Dispersal and gene flow of Populus nigra
(Salicaceae) along a dynamic river system. J Ecol 91:447–456 Jakobsson M, Rosenberg NA (2007) CLUMPP: a cluster matching and
permutation program for dealing with label switching and multimodality in analysis of population structure. Bioinformatics 23:1801–1806
Kamvar ZN, Tabima JF, Grünwald NJ (2014) Poppr: an R package for genetic analysis of populations with clonal, partially clonal, and/or sexual reproduction. PeerJ 2:e281.https://doi.org/10.7717/peerj.281
Kikuchi S, Suzuki W, Sashimura N (2011) Gene flow in an endangered willow Salix hukaoana (Salicaceae) in natural and fragmented ripar-ian landscapes. Conserv Genet 12:79–89.https://doi.org/10.1007/ s10592-009-9992-z
King RA, Harris SL, Karp A, Barker JH (2010) A characterisation and inheritance of nuclear microsatellite loci for use in population stud-ies of the allotetraploid Salix alba–Salix fragilis complex. Tree Genet Genomes 6:247–258. https://doi.org/10.1007/s11295-009-0245-6
Kuzovkina YA, Weih M, Romero MA, Charles J, Hurst S, McIvor I (2008) Salix: botany and global horticulture. Hortic Rev 34:447–489 Lauron-Moreau A, Pitre FE, Brouillet L, Labrecque M (2013) Microsatellite markers of willow species and characterization of 11 polymorphic microsatellites for Salix eriocephala (Salicaceae), a potential native species for biomass production in Canada. Plants 2:203–210.https://doi.org/10.3390/plants2020203
Lian C, Nara K, Nakaya H, Zhou Z, Wu B, Miyashita N, Hogetsu T (2001) Development of microsatellite markers in polyploid Salix reinii. Mol Ecol Notes 1:160–161
Lin J, Gibbs JP, Smart LB (2009) Population genetic structure of native versus naturalized sympatric shrub willows (Salix; Salicaceae). Am J Bot 96:771–785
Liu S (1999) Salix. In: Fang ZF, Zhao SD, Skvortsov AK (eds) Flora of China, Cycadaceae through Fagaceae. Science Press, Beijing, China and Missouri Botanical Garden Press, St Louis, MO, USA, p 139– 279
Liu Y, Wang Y, Huang H (2006) High interpopulation genetic differenti-ation and unidirectional linear migrdifferenti-ation patterns in Myricaria laxiflora (Tamaricaceae), an endemic riparian plant in the Three Gorges Valley of the Yangtze River. Am J Bot 93:206–215 Lundqvist E, Andersson E (2001) Genetic diversity in populations of
plants with different breeding and dispersal strategies in a freeflowing boreal river system. Hereditas 135:75–83
Maroder HL, Prego IA, Facc Iuto GR, Maldonado SB (2000) Storage behaviour of Salix alba and Salix matsudana seeds. Ann Bot 86: 1017–1021.https://doi.org/10.1006/anbo.2000.1265
Mleczek M, Rutkowski P, Rissmann I, Kaczmarek Z, Golinski P, Szentner K, Strazynska K, Stachowiak A (2010) Biomass produc-tivity and phytoremediation potential of Salix alba and Salix viminalis. Elsevier. Biomass Bioenergy 34(9):1410–1418.https:// doi.org/10.1016/j.biombioe.2010.04.012
Nei M (1972) Genetic distance between populations. Am Nat 106:283– 292
Nei M, Maruyama T, Chakraborty R (1975) The bottleneck effect and genetic variability in populations. Evolution 29:1–10
Peakall R, Smouse PE (2012) GenAlEx 6.5: genetic analysis in Excel. Population genetic software for teaching and research-an update. Bioinformatics 28:2537–2539
Perdereau AC, Kelleher CT, Douglas GC, Hodkinson TR (2014) High levels of gene flow and genetic diversity in Irish populations of Salix caprea L. inferred from chloroplast and nuclear SSR markers. BMC Plant Biol 1:202.https://doi.org/10.1186/s12870-014-0202-x
Pritchard JK, Stephens M, Donnelly P (2000) Inference of population structure using multilocus genotype data. Genetics 155(2):945–959 Puschenreiter M, Türktaş M, Sommer P, Wieshammer G, Laaha G, Wenzel WW, Hauser MT (2010) Differentiation of metallicolous and non-metallicolous Salix caprea populations based on phenotyp-ic characteristphenotyp-ics and nuclear mphenotyp-icrosatellite (SSR) markers. Published in final edited form as: Plant Cell Environ 33(10):1641– 1655.https://doi.org/10.1111/j.1365-3040.2010.02170.x
Raymond M, Rousset F (1995) GENEPOP (version 1.2): population genetics software for exact tests and ecumenicism. J Hered 86: 248–249
Rood SR, Kalischuk AR, Polzin ML, Braatne JH (2003) Branch propa-gation, not cladoptosis, permits dispersive, clonal reproduction of riparian cottonwoods. For Ecol Manag 186:227–242
Rousset F (2008) Genepop'007: a complete reimplementation of the Genepop software for Windows and Linux. Mol Ecol Resour 8: 103–106
Rungis D, Laivins M, Gailite A, Korica A, Lazdina D, Skipars V, Veinberga I (2017) Genetic analysis of Latvian Salix alba L. and hybrid populations using nuclear and chloroplast DNA markers. iForest 10:422–429.https://doi.org/10.3832/ifor2004-009
Singh NB, Joshi S, Choudhary P, Sharma JP (2013a) SSR DNA marker aided genetic diversity assessment of selected willow clones. Genetika 45(2):527–536
Singh NB, Singh MK, Naik PK, Thakur S, Sharma JP (2013b) Analysis of genetic diversity in female, male and half sibs willow genotypes through RAPD and SSR markers. Afr J Biotechnol 12(29):4578– 4587.https://doi.org/10.5897/AJB2013.12120
Singh MK, Singh NB, Sankhyan HP, Naik PK (2014) Congruence of random amplification of polymorphic deoxyribonucleic acid (RAPD) and simple sequence repeats (SSR) markers in genetic characterization of willow (Salix spp). 13(32):3217–3229.https:// doi.org/10.5897/AJB013.1544
Sitzia T, Barcaccia G, Lucchin M (2018) Genetic diversity and stand structure of neighboring white willow (Salix alba L.) populations along fragmented riparian corridors: a case study. Silvae Genetica 67(1):79–88.https://doi.org/10.2478/sg-2018-0011
Skvortsov AK (1999) In: Zinovjev AG, Argus GW, Tahvanainen J, Roininen H (eds) Willows of Russia and adjacent countries: Taxonomical and Geographical Revision (transl from: Skvortsov AK (1968) Willows of the USSR: Taxonomic and Geographic Revision. Nauka, Moscow). Joensuu University, Joensuu 307 Slatkin M (1995) A measure of population subdivision based on
micro-satellite allele frequencies. Genetics 139:457–462
Sochor M, Vasut RJ, Bartova E, Majesky L, Mracek J (2013) Can gene flow among populations counteract the habitat loss of extremely fragile biotopes? An example from the population genetic structure in Salix daphnoides. Tree Genet Genomes 9:1193–1205
Stamati K, Blackie S, Brown JWS, Russell J (2003) A set of polymorphic SSR loci for subarctic willow (Salix lanata, S. lapponum and S. herbacea). Mol Ecol Notes 3:280–282
Stamati K, Hollingsworth PM, Russell J (2007) Patterns of clonal diver-sity in three species of sub-arctic willow (Salix lanata, Salix lapponum and Salix herbacea). Plant Syst Evol 269:75–88 Steltzer H, Hufbauer RA, Welker JM, Casalis M, Sullivan PF, Chimner R
(2008) Frequent sexual reproduction and high intraspecific variation in Salix arctica: implications for a terrestrial feedback to climate change in the High Arctic. J Geophys Res 113:G03S10.https:// doi.org/10.1029/2007JG000503
Terzioğlu S, Serdar B, Karaköse M, Coşkunçelebi K, Gültepe M (2014) New data on Salix anatolica (Salicaceae) endemic to Turkey. Phytotaxa 167:111–118
Trybush SO, JahodováŠ, Čížková L, Karp A, Hanley SJ (2012) High levels of genetic diversity in Salix viminalis of the Czech Republic as revealed by microsatellite markers. Bioenerg Res 5:969–977.
https://doi.org/10.1007/s12155-012-9212-4
Tunçtaner K (1990) Çeşitli Söğüt Klonlarının Genetik Varyasyonları ve Türkiye’nin Değişik Yörelerine Adaptasyonları Üzerine Araştırmalar. Tarım, Orman ve Köy İşleri Bakanlığı, Orman Genel Müdürlüğü, Kavak ve Hızlı Gelişen Orman Ağaçları Araştırma Enstitüsü,1990-2, Teknik Bülten No: 150,İzmit (In Turkish) Ukwubile CA, Ahuchaogu CE, Tajudeen BL (2014) Congruence of
ran-dom amplification of polymorphic deoxyribonucleic acid (RAPD) and simple sequence repeats (SSR) markers in genetic characteriza-tion of willow (Salix spp.). European Journal of Biotechnology and Bioscience 2(1):11–23
Velioğlu E, Akgül S (2016) Poplars and willows in Turkey: country progress report of the National Poplar Commission. Time period: 2012–2015
Vries De MG (2001) Conservation of natural ecosystems of poplar and willow. For Chron 77(2):255–257
Web site of the International Populus Genome Consortium (2014) Available athttp://www.ornl.gov/sci/ipgc/ssr_resources.htm. Accessed March
Publisher’s note Springer Nature remains neutral with regard to jurisdictional claims in published maps and institutional affiliations.