I
Connectedness Cycles
in Turkish and International Stock Markets
on the Way to Investment Grade
YİĞİT GÖZÜBÜYÜK
111620017
İSTANBUL BİLGİ ÜNİVERSİTESİ
SOSYAL BİLİMLER ENSTİTÜSÜ
FİNANSAL EKONOMİ/SAYISAL FİNANS YÜKSEK LİSANS PROGRAMI
HARALD SCHMIDBAUER
2013
II
Connectedness Cycles
in Turkish and International Stock Markets
on the Way to Investment Grade
Türkiye ve Uluslararası Hisse Piyasalarında
Etkileşim Döngüleri
Yatırım Yapılabilir Seviyeye İlerlerken
YİĞİT GÖZÜBÜYÜK
111620017
Tez Danışmanının Adı Soyadı (İMZASI) : Harald Schmidbauer
Jüri Üyelerinin Adı Soyadı (İMZASI) : Serda Selin Öztürk
Jüri Üyelerinin Adı Soyadı (İMZASI) : Sema Bayraktar
Tezin Onaylandığı Tarih : 22/05/2013
Toplam Sayfa Sayısı: 52
Anahtar Kelimeler
Keywords
1) Yayılım
1) Spillover
2) VAR – Vektör Otoregresyon
2) VAR – Vector Auto-regression
3) FEVD – Tahmin Hatası Varyans
Ayrışması
3) FEVD – Forecast Error Variance
Decomposition
4) Loess – Lokal regresyon
4) LOESS - Local regression
III
Abstract
In this study the connectedness of global stock markets are discussed. After the recent credit crisis the correlation between the financial assets are discussed more than before. In this study the connectedness cycles of stock markets’ returns are investigated by applying Forecast Error Decomposition (FEVD) from Vector Auto-Regression (VAR) models. Spillover, directional spillover and net directional spillover methods are used (Diebold & Yilmaz, 2012). The study aims to find out how “The Credit Rating Upgrades”, which was one of the most popular themes for Turkey in 2012, is affecting the change in the connectedness or not. Obtained results show that the connectedness of the stock markets of the countries on the way to the announcement of the investment grade is decreasing until the event, but after the announcement, it starts to increase. On the other hand, the stock markets of such countries become relatively the affected ones instead of being the affecting ones, but they cannot protect this capability for a longer period.
Özet
Bu çalışmada küresel hisse piyasalarının birbirleriyle olan bağlantıları ele alınmaktadır. Son yaşanan kredi krizinin ardından finansal varlıklar arasındaki benzer hareketler eskisinden daha çok tartışılmaktadır. Bu çalışmada 11 uluslararası hisse endeksinin getirilerindeki olası etkileşim döngüleri Vector Autoregression (VAR) ve Forecast Error Variance Decomposition (FEVD) modelleri ile incelenmektedir. Yayılım, yönlü yayılım ve net yönlü yayılım metodları
kullanılmaktadır (Diebold & Yilmaz, 2012). Etkileşimdeki değişimlerde, 2012 yılında Türkiye için hayli popüler bir konu olan “Kredi Notu Artışları”ndan ne ölçüde etkilendiği sorgulanmıştır. Elde edilen sonuçlar notu yatırım yapılabilir seviyeye yükseltilen ülkelerin hisse piyasalarının bu süreçte etkileşimlerinin azaldığını, ancak bir süre sonra yeniden arttığını göstermektedir. Öte yandan notu yükseltilen ülkelerin hisse piyasaları aynı süreçte göreceli olarak diğer piyasalardan etkilenen değil, diğer piyasaları etkileyen haline gelmiş, ancak bu özelliklerini kayda değer bir sürede koruyamamışlardır.
IV
Acknowledgements
I want to thank my adviser Mr. Harald Schmidbauer, who never leaves my questions unanswered. Angi Rösch and Erhan Uluceviz, I appreciate your help and support. Their R-script was an extraordinary tool for me.
V
CONTENTS
1. Introduction 6 2. Data 12 3. Methodology 15 3.1. Total Spillover 153.2. Directional Spillover & Net Directional Spillover 17
3.3. Spillover Plots 18
3.4. Smoothing – Local Regression 19
4. Results 21 4.1. Spillover Measures 22 4.2. Hypothesis 1 27 4.3. Hypothesis 2 32 4.4. Turkey’s Case 37 5. Robustness 38 6. Conclusion 41 References 42 Appendix A
RELATIVE NOMINAL VALUES & LOG RETURNS (as %) OF THE DATA SERIES
45
Appendix B
SMOOTHED RELATIVE DIRECTIONAL SPILLOVER PLOTS & SMOOTHED NET DIRECTIONAL SPILLOVER PLOTS OF THE STOCK MARKETS
49
Appendix C
SMOOTHED RELATIVE DIRECTIONAL SPILLOVER PLOTS & SMOOTHED NET DIRECTIONAL SPILLOVER PLOTS OF TURKEY AS MARKED WITH CRITICAL MACRO-EVENTS
6
1. Introduction
The aim of this study is to explain the connectedness in the global stock markets by using spillover methodology based on Forecast Error Variance Decomposition (FEVD) from Vector Auto-Regression (VAR) models. As long as financial crises occur regularly and more often, the connectedness of financial assets will be more interesting. In this study the behavior of the connectedness in stock markets is analyzed as well. Diebold and Yilmaz are the pioneers for developing the spillover measures, considering the several articles they have written on this topic. The spillover measure based on FEVD from VAR can be used to measure return and volatility spillovers (Diebold & Yilmaz, 2009). This study is concentrated on return spillovers.
One has to note that connectedness should not be confused with contagion. The
interdependence is called as “connectedness” in this study. Therefore, the term is about measuring stock market co-movements. On the other hand, contagion means the increase in unconditional correlation coefficients (Forbes & Rigobon, 2001). Credit rating is usually the credibility of a bond issuer. The issuer can be governments and also corporations. Credit rating agencies are grading these issuers in different scales (Table 1).
Standard & Poor’s and Moody’s and Fitch are the biggest and most powerful agencies in the credit rating industry. Investable status for an issuer means to be classified by at least two of these three credit rating agencies at investment grade.
7 (Table 1)
The year 2012 was a profitable year for investors, whose exposure is on Turkish stocks. The performance of Turkish stock market (IMKB or BIST as the new name) was separated positively from its peer group, other emerging markets, and even from some developed ones (Figure 1).
8 As the Figure 1 shows, Turkey and Philippines are two outliers among the countries. It has to be asked whether it is possible that the reason for this decoupling is the decreasing connectedness or not. The reason for Russia’s and Brazil’s low returns might be related to the decreasing connectedness as well. Why are some markets gaining, when some of them are losing? Is there an effect of the change in connectedness cycles on the determining good and bad markets?
Not incidentally Turkey is upgraded to investment grade by Fitch in 5 November 2012. As the data set was being prepared, Philippines were upgraded by Fitch in 27 March 2013. So, one might argue that the abnormal returns of these two stock markets could be explained by the changes in connectedness cycles. The possible changes in connectedness cycles may give early warning signals for the coming events such as “Credit Rating Upgrades”. It had been argued that the market participants had the expectation for such upgrades (e.g. Financial Times, November 2, 2012). Some news headlines reveal that:
Turkish stocks have gained 46 per cent this year, making Turkey the third-best equity market in the world, behind only Venezuela and Egypt. The bulls put a lot of weight on hopes that Fitch might next week become the first international credit agency to raise Turkey to investment grade.
Turkey: Can stocks go any higher? Nov 2, 2012, 6:09 pm by Stefan Wagstyl, Financial Times.
Hot inflows of $15 to $20 billion in foreign direct investment have fueled this market’s growth. As well, after 18 years, Fitch’s recent upgrade has returned Turkey to investment grade territory.
The 10 Hottest Stock Markets In The World, Dec. 30, 2012, 8:05 am by Lucas Kawa, Business Insider.
9
Astro del Castillo, managing director at local (Philippines) stock brokerage First Grade Holdings, said the upgrade will boost markets despite its having been anticipated.
S&P Lifts Philippines Closer to Investment Grade. July 4, 2012, 11:20 am by Cris Larano, Online WSJ.
“We believe that the Philippines will be rated investment grade by all three major rating agencies before Indonesia, as political concerns and external vulnerability are likely to remain a key ratings constraint for the latter in the coming 18 months,” Barclays said.
PH may soon get investment grade from 2 other major credit agencies, April 10, 2013 3:43 am by Doris C. Dumlao, Business Inquirer.
They (Barclays’ strategists) expect Philippine bonds issued in U.S. dollars to benefit both local buying and foreign purchases due to inclusion in investment-grade bond indexes. “We believe [dollar denominated bonds] will trade as tight as Brazil on an upgrade, and eventually settle between Mexico and Brazil,” the strategists write.
Is the Philippines Headed for Investment Grade? January 14, 2013, 10:03 A.M. ET by By Ben Levisohn, Barron’s.
According to the market participants’ comments there were some expectations about the credit rating upgrades. This expectation should be exposed somehow more scientifically. The credit rating explains the credibility of the issuer. So, how can one explain the relationship with the stock market?
First of all, every large corporation is also a bond issuer. Higher credit ratings decrease risk premium and the cost of debt, so the spreads are decreasing. The investors experienced from 1990 to 2003 that the credit rating upgrades and downgrades of Asian countries affect not only their domestic stock markets, but also cross-country stock markets (Li, Jeon, Cho & Chiang, 2008). In addition to that work, Dichev and Piotrovski (2001) showed by analyzing the long-run stock returns following bond ratings changes that not only credit rating upgrades affect the
10 stock returns. The stock returns are affected by the bond ratings downgrades more
significantly. Credit ratings affect also capital structures of the firms (Kisgen, 2006). The credit ratings have direct effects on the dynamics of the valuation models of the investors.
The aim of this work is to show the changes in connectedness cycles by return spillovers, to identify a possible separation by directional spillover, and to determine whether the credit rating upgrade has an effect on the overall status of a stock market or not by net directional spillover. Additionally, some macro events of Turkey are explained by the changes in directional spillover and net directional spillover.
Only the credit rating upgrades to first investment grade from big three credit rating agencies among selected countries are considered as the possible reasons for the changes in
connectedness. The connectedness can be measured by spillover by using the returns of the stock market indices. In this study 11 different stock market indices are used as the following main indices1 with the corresponding countries:
TURKEY – IMKB 100 or BIST 100; BRAZIL – BOVESPA; INDIA – SENSEX; RUSSIA – MICEX; INDONESIA – JCI; MEXICO – MEXBOL; SOUTH AFRICA – TOP40; ROMANIA – BET-C; PERU – IGBVL; PHILIPPINES – PCOMP; DEVELOPED COUNTRIES – MSCI WORLD.
1
The following main indices are presented with Bloomberg tickers. MSCI World is a composite stock index, which includes over 6000 stocks from Australia, Austria, Belgium, Canada, Denmark, Finland, France, Germany, Greece, Hong Kong, Ireland, Israel, Italy, Japan, Netherlands, New Zealand, Norway, Portugal, Singapore, Spain, Sweden, Switzerland, United Kingdom, United States. All of the countries in that index are developed ones, and they also have investment grade credit rating.
11 The following sections explain the data set and the methodology in more detailed. Section 2 describes the data set, and why these indices and the following credit rating upgrades are selected. Section 3 identifies the methodology. The fourth section discusses the two hypotheses below. In this section there is also a special part for Turkey, which presents the connectedness of Turkey on the way to announcement of the investment grade. The following section, Section 5, explains the sensitivity of the results to the window width which is the most significant variable to structure a rolling VAR model. Finally, the last section concludes by stating how the results may be combined, and how the techniques in this study could be upgraded. In addition, appendix C has a spillover plot for Turkey as marked with critical domestic macro events.
The previous news articles give some clues about the expectation of the investment grade. The assumption in this study is that this expectation causes an extraordinary outperformance of the stock markets. Apart from an abnormality, could this outperformance and the possibly
upcoming credit rating upgrade be observed in the connectedness? Is it possible to say that the countries on the way to the announcement of to the investment grade experience their own stories, and do their market dynamics change rapidly? This study addresses these questions by testing the two hypotheses below.
Hypothesis I: 6 months before the credit rating upgrade of the investment grade, the relative directional spillover decreases, but afterwards, it recovers.
Hypothesis II: An upgrade to investment grade level makes the stock market of a country an affecting one (net sender) for the rest of the world, instead of an affected (net receiver) one.
12
2. Data
The present study consists of eleven time series of daily closing quotations of the stock indices IMKB-100 or BIST-100 (Turkey, in the following called TUR), Bovespa (Brazil, BRA), Sensex (India, IND), Micex (Russia, RUS), JCI (Indonesia, INDO), Mexbol (Mexico, MEX), Top40 (South Africa, SAF), BET-C (Romania, ROM), IGBVL (Peru, PER), PCOMP (Philippines, PHI) and MSCI World in the time period beginning 01-Jun-1998 and ending 22-Mar-2013. The data set has 2733 observations per stock index. As it will be mentioned later, the starting date is the one of the first days for which all 11 stock indices were available and also it has an acceptable space before the first credit rating upgrade event. The daily log returns in percent are used. The data set is simplified by erasing the days, when all 11 indices were traded together and
simultaneously.
The data set includes the stock indices of 10 emerging countries, which are upgraded by credit rating agencies in different times. It has also a composite index, the MSCI World. This index has over 6000 stocks from 24 developed countries. Because the countries in the index have been initially graded in investment grade level, there was no credit rating upgrade event for the index participants. Because directly adding 24 developed countries to data set may create some computation problems for the spillover, developed countries are presented with MSCI World in the data set.
Table 2 presents descriptive statistics of the log returns of the indices as percentage. The data had been provided by Bloomberg. Appendix A has a normalized graph of the level series and separated graphs for the returns.
13 (Table 2)
14 The credit rating upgrade events are as important as the level series and returns of the stock indices, which generate connectedness cycles. Only the credit rating upgrades, which led in the first step to investment grade, are considered in this study. Table 3 presents the dates of the considered events with the corresponding credit rating agencies and countries. At these dates the following countries are graded at the same level of investment grade. (Table 1 for the steps of investment grade level.) These dates present their first steps to investment grade level. It should not be forgotten that there are several other credit rating events of the countries in this data set, but the unmentioned events here do not present the first steps to investment grade.
(Table 3) Source: Bloomberg.
SAF (South Africa) was initially graded as investment grade by Moody’s before the starting date of the data set in 3-Oct-1994. Philippines were added to this study because of its remarkable performance in 2012. Not incidentally it was upgraded to investment grade only two trading days after the ending day of the data set.
15
3. Methodology
Christopher A. Sims together with Thomas J. Sargent was awarded the Nobel Memorial Prize in Economic Sciences on 25 October 2011. The award cited their “empirical research on cause and effect in the macroeconomics”. The award was a result of their work on vector auto-regression models (Sims, 1980). The Nobel Prize triggered the popularity of Forecast Error Variance Decomposition from Vector Auto-Regression models. However, the spillover measure is also based on Engle’s traditional VAR studies. It is a FEVD study based on VAR models to measure the connectedness.
3.1. Total Spillovers
Diebold and Yilmaz (2012) suggest several connectedness measures derived from variance decompositions. The decomposition of forecast error variance is given in terms of the structural VAR. This needs to be identified on the basis of the standard VAR by imposing suitable
restrictions in the form of an ordering of the variables (Schmidbauer, Rösch, Uluceviz, 2012). To circumvent the undesirable dependence on the ordering, following Diebold and Yilmaz,
Schmidbauer, Rösch and Uluceviz revert to the so-called generalized FEVD, proposed by Pesaran and Shin (1998), which remedies the dependence on the ordering by giving each component of the series in question first priority.
Instead of attempting to orthogonalize shocks, the generalized approach allows correlated shocks but accounts for them appropriately using the historically observed distribution of the
16 errors. As the shocks to each variable are not orthogonalized, the sum of contributions to the variance of forecast error is not necessarily equal to one (Diebold & Yilmaz, 2012).
In their recent article, Schmidbauer, Rösch and Uluceviz (2012) explain the creation of the FEVD for a spillover measure in 3 steps:
1. Fit a standard VAR (vector autoregressive) model to the series. The multivariate empirical time series is 11-dimensional in this study.
2. Using series data up to, and including, time t, establish an n period ahead forecast (up to time t + n).
3. Decompose the error variance of the forecast for each component with respect to shocks from the same or other components at time t.
Variance decompositions allow us to split the forecast error variances of each variable into parts attributable to the various system shocks. More precisely, at the most simple two dimensional form, they answer the following questions: What fraction of the n-step-ahead error variance in forecasting first variable is due to shocks to first variable or shocks to second one? And similarly, what fraction of the n-step-ahead error variance in forecasting second variable is due to shocks to first one or shocks to second one?
17
3.2. Directional Spillover & Net Directional Spillover
In their study “Better to Give than to Receive: Predictive Directional Measurement of Volatility Spillovers” Diebold & Yilmaz (2012) clearly explain how the spillover measure is created. In this work this technique is applied to calculate return spillovers. In their article, Diebold and Yilmaz also mention Directional Spillover and Net Directional Spillover. Although the authors bring a point of view to present these two terms, the approach in this study uses them in a different way.
Directional Spillover (DS) = Sum of the Variance Percentage from All Other Participants
Net Directional Spillover (NDS) = DS – (Sum of the Variance Percentage to All Others)
In other words, this study defines the Directional Spillover as the inflow to a variable from all other variables, and Net Directional Spillover as the difference between the Directional Spillover and the outflow from a variable to all other variables.
The upcoming next section represents clearly how spillover, directional spillover and net directional spillover is obtained. To obtaining the results a special R-script is used, which is written by Schmidbauer, Rösch and Uluceviz. The R-script automatically determines the optimal lag length according to Akaike Information Criterion (AIC) and afterwards represents spillover matrix.
18
3.3. Spillover Plots
Two key points to obtaining a spillover matrix is to determine a window width and forecast horizon. The R-script is run by using every time 100 days long data and 5 days ahead forecast. A regular week for financial markets has 5 trading days. The assumption in this study is that the connectedness may figure out in the coming 5 trading days in a one week long period. So, if we have 11 dimensional data with 2733 observations, we have 2634 different spillover measures as a result of using 100 days long window width. This is spillover plotting. Changing the number of the days ahead “n” to forecast does not change the number of spillover measures, again 2634 observations, but it would change the spillover measures. More clearly, by making spillover measures a time series data we can obtain spillover plots. It makes our job easier to observe changes and possible trends of the connectedness through spillover. This study is concentrated on the connectedness by using return spillovers of 5 days ahead forecasts in 100 days long window width. Robustness section reviews the sensitivity of spillover measure of this data set to different window widths.
19
3.4. Smoothing – Local Regression
As Figure 2 at the next section will show, a spillover plot is highly volatile and also has some large outliers. To decrease the volatility and to make the data easily to analyze a specified smoothing technique is used in this study.
Locally weighted regression is an econometric way to smooth a series (Cleveland & Loader, 1996). The process is considered local because each smoothed value is determined by
neighboring data points defined within the span. The process is weighted because a regression weight function (wi, explained by the equation below) is defined for the data points contained
within the span. The used span in this study is 10% of the data series.
If it is aimed to eliminate the effects of outliers more powerfully, we can apply robust locally weighted regression (Cleveland, 1979). With the history to Macaulay’s book The Smoothing of Time Series (1931) local regression is easy to interpret.
Because this study is concentrated on connectedness cycles, it is aimed to observe the trend changes. In other words, the effects of the outliers should not be eliminated, but they should be smoothed.
One disadvantage of local regression is that old results are changing by adding data to the series. If the regression involves the same number of neighboring data points on either side of the smoothed data point, the weight function is symmetric. However, if the number of
neighboring points is not symmetric about the smoothed data point, then the weight function is not symmetric. The span never changes. Because this study is not a dynamic analysis, this situation does not create a major problem.
20 From the weight function (wi) above x is the predictor value associated with the response value
to be smoothed, xi are the nearest neighbors of x as defined by the span, and d(x) is the
distance along the abscissa from x to the most distant predictor value within the span. The weights have the following characteristics:
The data point to be smoothed has the largest weight and the most influence on the fit.
Data points outside the span have zero weight and no influence on the fit.
After the weights are determined by the weight function above, a weighted linear least squares regression is performed. The regression is applied by using a second degree polynomial. It is called the “Loess method”.
21
4. Results
First 10 months of the year 2012 brought high returns for Turkish financial assets. As it has been shown previously, the stock market had a distinctive performance, and the yields of
government bonds retreated to their lowest levels. This study tries to explain this decoupling of Turkish assets made in the name of the connectedness.
There are several academic studies about connectedness in international financial assets. A large part of these studies contains also Turkish assets such as bonds, CDS, etc. For example, Ismailescu & Kazemi’s study (2010) “The reaction of emerging markets’ credit default swap spreads to sovereign credit rating changes” includes Turkish CDS levels. They handled that the effects of the events in credit markets spill over in international CDS levels. Diebold & Yilmaz (2012) made several explanations in their articles about the effects of the macro events on the connectedness through return and volatility spillovers.
While the rumors and the expectations about the credit rating upgrading of Turkey for the investment grade were increasing, Central Bank of Turkey published a working paper about the dynamics of getting to investment grade on stock markets and bond yields (Kanli & Barlas, 2012). The study is on the comparison of the returns of different emerging countries’ assets, which are previously upgraded to investment grade by credit rating agencies. Kanli & Barlas emphasize that the upgrade from a second credit rating agency comes approximately 10 months later after the first agency upgraded.
If the dates from Table 3 are examined, similar results can be reached. So, the emerging countries in this study are largely the same ones in the article of Kanli & Barlas. On the other
22 hand, this study is not concentrated simply on the comparison of the returns, but rather on the connectedness of the stock markets’ returns.
4.1. Spillover Measures
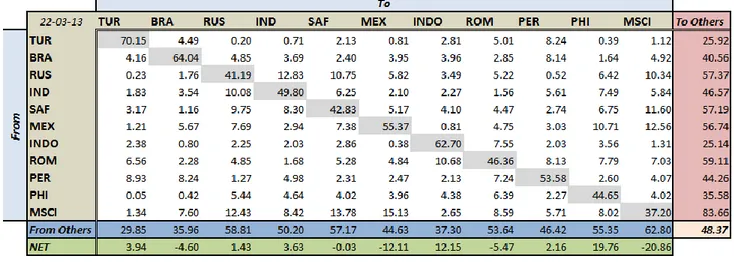
Table 4 represents the spillover matrix of 11 stock markets’ returns for 22 March 2013:
(Table 4)
This spillover matrix represents the values from the ending date of the data set for 5 steps ahead forecast in 100 days long window width. Unlike the matrix structure of Diebold & Yilmaz, the rows show the spillover from the corresponding country to the other ones in the columns, and the columns show the spillover from the country to the other ones in the rows. For example, the value “4.49” gives the percentage of the spillover from Turkey to Brazil in 22 March 2013.
The value “48.37” at the bottom-left corner of the table gives the total spillover of the data set. In other words, 48 percent of the all the variance spill over to the markets from the others.
23 The row, which begins with “From Others”, represents the percentage of the spillover to the markets in the columns from the other ones. The value “29.85” represents the amount of the spillover from other markets to Turkish market. This is called the directional spillover, as mentioned previously. The column, which begins with “To Others”, represents the percentage of the spillover from the market to all other markets. The value “25.92” represents the amount of the spillover from Turkish stock market to all other markets. Finally, the row starting with “Net” represents the net directional spillover. The value is obtained by subtracting the amount of the spillover to others from the amount of the spillover from others. That indicates inflow minus outflow.
By using the term net directional spillover, Alter & Beyer (2013) explain whether a variable could be a sender or a receiver. If one compares the two values from different markets, one can get a clearer idea. The net directional spillover of MSCI World is “-20.86”; on the other hand, the net directional spillover of Indonesia is “12.15”. MSCI World sends the shocks to other markets, but Indonesia receives shocks from other markets.
Figure 2 on the next page sums up the amount of the net directional spillover for the ending day in 22 March 2013.
24 (Figure 2)
To analyze the connectedness, the key point is the total spillover measure. The directional and the net directional spillover measures are derived from the total spillover. Because not only the data from the ending day of the data set would be used, it must be concentrated on the whole data set. The whole spillover changes through time could be reviewed by the spillover plot. Figure 3 in the next page shows the spillover plot for 5 steps ahead forecast in 100 days long window width.
25 (Figure 3)
26 The total spillover measures have clearly identifiable cycles. It is a volatile level series. The graph at the previous page shows the smoothed data in addition to the total spillover measure. To smooth the data, quadratic polynomial locally weighted regression (Loess) with 10% span is used. Due to the remarkable outliers, high kurtosis and standard deviation, the spillover data was smoothed. Table 5 provides an overview of the descriptive statistics for the percentage of the changes (log) in the total spillover data.
(Table 5)
The next subsections explain how the connectedness cycles of these stock indices are affected by credit rating upgrades of the investment grade. Each data series in the next subsections is smoothed by applying Loess. The possible explanations are reviewed through the two previous hypotheses.
27
4.2. Hypothesis I
Could the expectation of the credit rating upgrade to investment grade isolate the country’s benchmark stock exchange index from the macro-events in the world? Do the countries on the way investment grade experience their own stories?
Hypothesis I: 6 months before the credit rating upgrade of the investment grade the relative directional spillover decreases, but afterwards, it recovers.
It is an important question whether one may answer these questions by analyzing the
connectedness cycles or not. Although Bolton, Freixas & Shapiro (2011) showed that the ratings of the top three credit rating agencies are quiet manipulative, it is intended to show the
possible effects of the credit rating upgrades on the connectedness cycles.
The working paper of Central Bank of Turkey (Kanli & Barlas, 2012) indicates that the stock exchange indices beat relatively their peers 6 months before the announcement of the credit rating upgrade of the investment grade, but after the announcement, a reversal process starts. The relative directional spillover (RDS) for every stock market is studied to analyze possible changes in the connectedness.
RDS = DS / Total Spillover
RDS may identify relative dynamics of the changes in connectedness independently from the common trend. Appendix B reviews RDS plots of all stock indices in the data set.
Analyzing RDS dynamics separately for every stock market may create some noise. So, a generally accepted solution is needed. Cantor & Packer (1996) concentrated on mean
28 cumulative changes of the relative bond spreads when they studied the effects of sovereign credit rating changes on bond spreads.
The approach in this study tries to show the relative performance changes, which are
mentioned by Kanli & Barlas (2012), by studying relative directional spillover changes. At this point MSCI World index, Philippines’ PCOMP and Turkey’s BIST 100 were removed from my data set because of the following reasons:
The participants of MSCI World had not any credit rating upgrades to investment grade because they initially have been graded by the agencies in investment grade.
Philippines have been graded to investment grade two trading days later the ending day of the data set. On the other hand, since the credit rating upgrade of Turkey until the ending day of the data series, six months did not have pass. So, Turkey and Philippines cases do not represent efficient data.
The first upgrade of South Africa by Moody’s in 3 October 1994 stays out of the data set. Therefore, there are 22 credit rating events to analyze. Every event is studied separately
without being classified with the corresponding market. Table 6 reviews descriptive statistics of the RDS levels of these 22 events in two 180 calendar day periods such as before and after the credit rating upgrades. “t” stands for the date of the event.
29 For example, if Indonesia has two upgrades, one in 18 January 2011 and the other in 15
December 2012, these two events are added to the cumulative data as two different events, but every time with the data of Indonesia’s stock market.
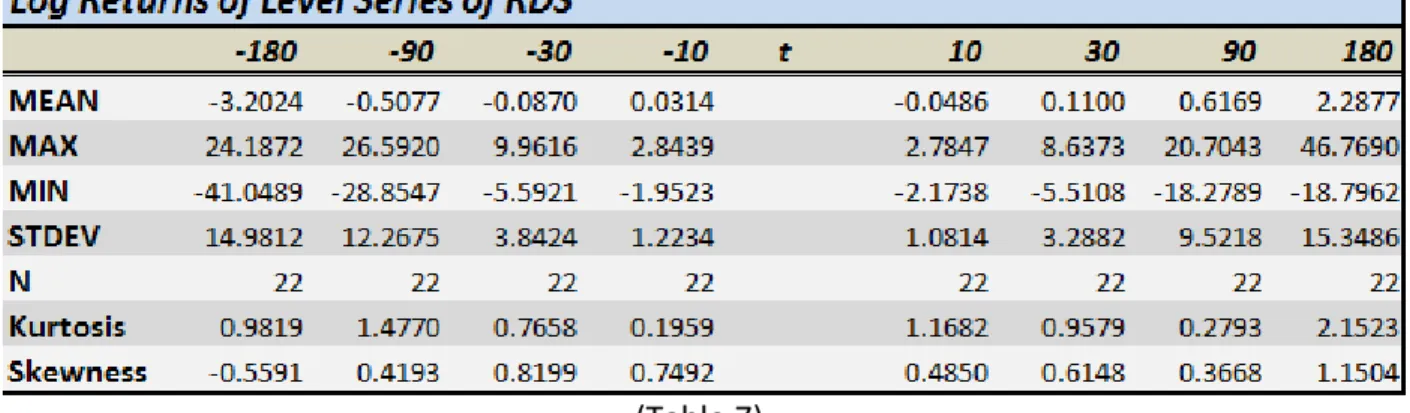
Table 7 reviews descriptive statistics of the log returns of the RDS levels.
(Table 7)
If all results are summed up, the cumulative mean of the RDS levels according to the credit rating upgrades to investment grade gives the graph “Figure 4” below.
30 Figure 4 shows that the connectedness of the stock markets decreases before the credit rating announcement, then the connectedness starts to recover. So, RDS has a u-shaped form in the period before and after the credit rating upgrade to the investment grade. In other words, the stock markets experience their own stories on the way of investment grade. The first
hypothesis cannot be rejected.
RDS analysis gives different outcomes when we compose the same graph separately for the first, second and third upgrade and also for the credit rating agencies. Second upgrade means that the country is graded by a second credit rating agency, and third upgrade means that the country is graded by a third one. Figure 5 shows different effects on RDS levels.
(Figure 5)
One has to note that an issuer should be graded by at least two of the top three credit rating agencies to gain investable status. So, second upgrade has a dominant effect. Because there are some countries in the data set, which are graded repeatedly in a short period, first and third upgrades have each other complementary effects on the second upgrade.
31 Figure 6 below shows the effects on RDS levels according to credit rating agencies.
(Figure 6)
This time the dominant effect comes from Standard & Poor’s (S&P). The expectations of a coming upgrade from Fitch cannot decrease the RDS level significantly. With respect to Moody’s a totally different effect occurs. The graph gives a common view excluding S&P case: In 360 day period RDS levels come close to their old levels at the beginning, but they need more time for a complete recovery.
32
4.3. Hypothesis II
One should ask the following questions: Could the credit rating upgrade to investment grade change the class of a country? Could a country be an affecting one for the rest of the world instead of an affected one after several upgrades?
Hypothesis II: An upgrade of the investment grade makes the stock market of the country an affecting one (net sender), instead of an affected (net receiver) one.
Figure 2 demonstrates that MSCI World is clearly a net sender. My point is that the credit rating upgrades could make the country a net sender. If credit rating upgrades to the investment grade decrease the directional spillover for a while, and then the directional spillover recovers afterwards, a similar effect could be seen also in net directional spillover.
Alter & Beyer (2012) studied the dynamics of spillover effects during the European sovereign debt turmoil in the paper with the same name. They analyzed the changes in the net spillover following the macro events. As it is mentioned previously, again the same data set is used with 22 credit rating events and the corresponding data in 360 calendar day horizon (180 days before and 180 days after the event). This time the changes in the net directional spillover (NDS) are reviewed. Because net directional spillover creates a zero-sum game, there was no need to use relative values, again, cumulative series were used.
Because of the same reasons, which are mentioned while explaining the used data set for RDS levels, the same 22 events are used with the net directional spillover levels of the
33 (Table 8)
NDS levels may be positive (net receiver) and negative (net sender), and these levels create zero-sum game. Because of these reasons normalized relative values are not used.
“Figure 7” shows the cumulative data of NDS levels for 180 calendar days before and after the credit rating upgrade announcements.
34
The stock markets become a net sender on the way to the announcement of the investment grade, but they cannot protect this capability for a long time, again another cycle like the previous one starts. Although we have a powerful argument, we cannot reject the hypothesis easily.
The three graphs below (Figure 8, 9 & 10) show the effects of the upgrades according to their orders.
(Figure 8)
35 (Figure 10)
The stock markets enter the net sender status only after the first upgrade. The other upgrades are unable to bring the stock markets to net sender status, but each time, there is an effect decreasing the net spillover. On the other hand, this could be a result of decreasing directional spillover.
The graphs below (Figure 11, 12 & 13) show the NDS levels according to the credit rating agencies.
36 (Figure 12)
(Figure 13)
It is not easy to make a statement according to these graphs. S&P case represents an
unexpected effect, the upgrade makes the stock market to an affected one (net receiver). The result, which may be seen as a supportive argument for the second hypothesis, is provided with the Fitch case.
37
4.4. Turkey’s Case
Turkey is upgraded by Fitch to the first step of investment grade in 5 November 2012. Figure 14 demonstrates that RDS for the Turkish stock market continues to decrease. The expectation for another upgrade continues.
(Figure 14)
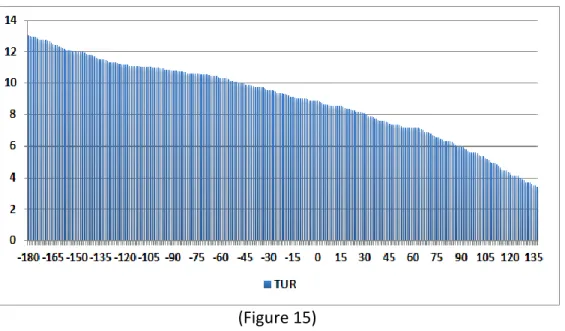
After the upgrade on 5 November 2012, Turkey’s RDS is still decreasing. Figure 15 on the next page is supporting the previous argument. NDS is still positive, but it continues to decrease. Turkish stock market moves on to be an affecting one. According to the two hypotheses, these two arguments are the symptoms of an upcoming credit rating upgrade of the investment level, or alternatively, these two arguments only show that how powerful the expectation of an upcoming credit rating upgrade dominates the dynamics of the Turkish stock market.
38 (Figure 15)
5. Robustness
The major problem for the robustness of the spillover measures is the sensitivity of the results to the window width and number of steps ahead to forecast. Because of using all the data set after smoothing by local regression, the percentage of span in Loess may create some question marks. The sensitivity of the total spillover measure to the number of steps ahead to forecast is not examined because the assumption was basically that the shocks do not more than 5 trading days to be settled down among the markets. However, the graphs below show some
explanations about the sensitivity.
39 (Figure 16)
The noise in the total spillover decreases, as the window width enlarges. To decrease the sensitivity to window width and to the decrease the volatility in the series smoothed data is used. Figure 17 shows the spillover measures with the 50, 100 and 200 days long window widths after they are smoothed by using Loess with 10% span.
40 As long as the data set enlarges, the smoothed series become closer than before. After the year 2007 the series converge. Before the year 2007, the series with 100 days long window width stay always between the other two series.
Finally, the graph below shows total spillover series with 100 days long window width and its smoothed versions with different span percentages.
41
6. Conclusion
The study aimed to show the possible effects of credit rating upgrades to the investment grade on the shaping of connectedness cycles. Although there are lots of studies about the effects of credit rating announcements on bonds and CDS markets, the studies, which examine the effects on stock markets, are published in limited numbers as secondary alternatives. OECD working paper of Maltzan, Reisen & Larrain (1997) is an example of the first alternatives.
The approach is motivated by spillover techniques, which are developed by Diebold & Yilmaz (2012). To calculate he spillover, using spatial econometrics could be a respectful alternative (Baldacci, Dell’Erba, Poghosyan, 2011). On the other hand, the connectedness could be studied also by using panel data.
All in all, the results are obtained by developing some measures such as relative directional spillover (RDS) based on already known techniques. At least the effects of the investment grade level on the stock markets may be shown from the perspective of Turkey. First, the results showed that investment grade expectation decreases the connectedness of the stock market in the name of relative directional spillover. Second, the study presented the changes in the net directional spillover before and after the credit event with two terms, net sender & net receiver.
Determining the window width and the number of days to forecast in VAR models are Achilles’ heels of this spillover measure technique. Alter & Beyer (2012) propose a solution to determine optimal window width. They calculate the intersection point of percentage of significant y-coefficients and marginal change of mean residual sum of squares in structured VAR on the same graph. A future direction of the research will focus on an analytically rich article trying to bring possible solutions for the optimal window width.
42
References
Alter, A. & Beyer, A., 2012. The Dynamics of Spillover Effects during the European Sovereign Debt Turmoil. CFS Working Paper, 2012/13.
Baldacci, E. & Dell’Erba, S. & Poghosyan, T., 2011. Spatial Spillovers in Emerging Market Spreads. IMF Working Paper, WP/11/221.
Bloomberg Professional Terminal
Bolton, P. & Freixas, X. & Shapiro, J., 2012. The Credit Ratings Game. Journal of Finance, American Finance Association, Vol. 67(1), 85-112, 02.
Cleveland, William S., Dec., 1979. Robust Locally Weighted Regression and Smoothing Scatterplots. Journal of American Statistical Association, Vol. 74, Issue 368, 829-836.
Cleveland, W. S. & Loader, C., 1996. Smoothing by Local Regression: Principles and Methods. Statistical Theory and Computational Aspects of Smoothing, Contributions to Statistics, 10-49. Cantor, R. & Packer, F., Oct., 1996. Determinants and Impact of Sovereign Credit Ratings. FRBNY Economic Policy Review.
Dichev, I. D. & Piotroski, J. D., 2001. The Long-Run Stock Returns Following Bond Rating Changes. Journal of Finance, Vol. 56, No. 1.
Diebold, F.X. & Yilmaz, K., 2009. Measuring Financial Asset Return and Volatility Spillovers, with Application to Global Equity Markets. Economic Journal, 119, 158-171.
Diebold, F. X. & Yilmaz, K., 2011. On the Network Topology of Variance Decompositions: Measuring the Connectedness of Financial Firms. PIER Working Paper , 11-031.
Diebold, F. X. & Yilmaz, K., 2012. Better to Give than to Receive: Predictive Directional Measurement of Volatility Spillovers. International Journal of Forecasting, Issue 28, 57-66.
Forbes, K. J. & Rigobon R., 1999. No Contagion, Only Interdependence: Measuring Stock Market Co-Movements. NBER Working Paper, 7267.
43 Hernandez, L. & Valdes, R. O., 2001. What Drives Contagion? Trade, Neighborhood and
Financial Links. International Review of Financial Analysis, Vol. 10, Issue 3, 203–218.
Ismailescu, I. & Kazemi, H., 2010. The Reaction of Emerging Market Credit Default Swap Spreads to Sovereign Credit Rating Changes. Journal of Banking and Finance, 34 (12), 2861-2873.
Kanli, I. B. & Barlas, Y., Sep., 2012. Credit Rating Upgrade to Investment Level: Trends Before and After the Upgrade. CBT Research Notes In Economics, 2012-25.
Kisgen, D. J., Jun., 2006. Credit Ratings and Capital Structure. Journal of Finance, Vol. 61, No. 3.
Larrain, G. & Reisen, H. & Maltzan J., Apr. 1997. Emerging Market Risk and Sovereign Credit Ratings. OECD Working Paper, 124.
Li, H. & Jeon, B. N. & Cho, S. & Chiang, T., 2008. The Impact of Sovereign Rating Changes and Financial Contagion on Stock Market Returns: Evidence from Five Asian Countries. Global Finance Journal, 46-55.
Norden, L. & Weber, M., 2004. Informational Efficiency Of Credit Default Swap And Stock Markets: The Impact Of Credit Rating Announcements. CEPR, Discussion Paper, 4250.
Pesaran, H. H. & Shin, Y., 1998. Generalized Impulse Response Analysis in Linear Multivariate Models. Economics Letters, 58, 17-29.
Schmidbauer, H. & Rosch, A. & Uluceviz, E., 2012. Understanding Market Connectedness: A Markow Chain Approach. The International Institute of Forecasters (ed.), Proceedings of The 32nd International Symposium On Forecasting ISF 2012.
Schmidbauer, H. & Rosch, A. & Uluceviz, E., 2012. Connectedness Cycles In Equity Markets: A Wavelet Approach. EcoMod Network (ed.), Proceedings of The International Conference On Policy Modeling EcoMod 2012.
44 Varian, Hal R., 1997. How to Build an Economic Model in Your Spare Time. Passion and Craft: Economists at Work. University of Michigan Press.
45
APPENDIX A
RELATIVE NOMINAL VALUES & LOG RETURNS (as %)
OF THE DATA SERIES
49
APPENDIX B
SMOOTHED RELATIVE DIRECTIONAL SPILLOVER PLOTS
& SMOOTHED NET DIRECTIONAL SPILLOVER PLOTS
52
APPENDIX C
SMOOTHED RELATIVE DIRECTIONAL SPILLOVER PLOTS & SMOOTHED NET DIRECTIONAL SPILLOVER PLOTS
OF TURKEY