by
Melike Nur Önder
Submitted to the Institute of Graduate Studies in Science and Engineering in partial fulfillment of
the requirements for the degree of Master of Science
in
Electrical and Electronics Engineering
Istanbul Bilgi University 2017
PAPER BASED LOW COST BIOSENSOR DESIGN AND FABRICATION
APPROVED BY:
Assist. Prof. Dr. Y. Dağhan Gökdel ……….
(Advisor)
Assist. Prof. Dr. Özgür Gül ……….
(Co-advisor)
Prof. Dr. Sedat Ölçer ……….
Assist. Prof. Dr. Okan Zafer Batur ……….
Assist. Prof. Dr. Onur Ferhanoğlu ……….
ACKNOWLEDGEMENT
I would like to mention about my gratitude to whom make this thesis possible to complete.
Firstly, I would like to give my sincere gratitude to my advisor Asst. Prof. Dr. Y. Dağhan Gökdel and my co-advisor Asst. Prof. Dr. Özgür Gül. Throughout of my thesis, I am motivated and encouraged with their patience and guiding. Their guiding is not only aspect of project, they also lead me to my career plans and encourage me to relief my best.
Being a member of Micro-System Lab and part of Biosensor Research Group make me feel lucky. I would like to thank all the members in both Micro-System Lab and Biosensor Research Group.
I am gratitude to have such team mates Ö. Gökalp Akcan and Tuğçe Ayraç. I am thankful for their help and motivation.
I would also thank to Prof. Dr. Ahmet Denker to encourage me to study at master degree and Prof. Dr. Sedat Ölçer for his comments and without his support, it would not be possible to complete this project.
Finally, I would like to express my appreciation to my family. I owe my parents Ayfer Önder and Murat Önder so much for their tolerance, understandings and supports. I am grateful my sister Gökçe Gül Önder, my friends Akın Kaya and Taylan Parlak for their continuous pertinacity to motivate me.
ABSTRACT
PAPER BASED LOW COST BIOSENSOR DESIGN AND FABRICATION
MEMS devices as being one of the incrementally developing field with micro scale range and higher sensitivity are quite valuable. In the scope of this thesis, a paper-based MEMS device is produced with a low cost and fast fabrication procedure. The sensor, which is designed to measure weights, can be easily modified as a biosensor. Hence, the most important parameter of this sensor is its sensitivity.
The sensor measures the magnitude of the applied force by using the change in piezoresistor which is directly proportional to the applied force. Piezoresistive material coated sensor, which is designed as a cantilever shaped structure, is electrically connected to the Wheatstone bridge circuit. Graphite ink is used as a piezoresistor due to the ease of implementation. Paper-based sensor measures the weight by using the direct relation between the voltage change (Wheatstone bridge circuit output) and applied force excited on the cantilever.
The novelty of this sensor is addition of magnetic amplifier. The advantage of magnetic amplifier is to increase the effective mass of the weight. This addition provides 0.3 mg resolution measurement from 20 mg resolution weight sensor.
This sensor can only quantify the weights that are magnetically active. Furtherance, it can be easily transformed to a biosensor. The only thing that is necessary is to bind the MNP (magnetic nano particle) and the biological/chemical particle to make it a magnetically active component. After the binding process, these components can be detectable and measurable by this weight sensor that uses the magnetic mass increase scheme.
ÖZET
KAĞIT TABANLI DÜŞÜK MALİYETLİ BİYOALGILAYICI TASARIMI VE ÜRETİMİ
Hızla gelişen alanlardan biri olan MEMS cihazları mikro boyutlarda olmaları ve yüksek hassasiyete sahip olmaları dolayısıyla oldukça önem arz etmektedirler. Bu proje kapsamında ucuz ve hızlı üretim tekniklerine sahip olması sebebiyle son zamanlarda en çok ilgilenilen alanlardan biri olan kağıt tabanlı algılayıcı üretilmiştir. Bu proje kapsamında, ağırlık ölçümlerinde kullanılmak için üretilen bu algılayıcının biyoalgılayıcıya dönüştürülmesinin kolay olması istenmektedir. Bu nedenle de algılayıcının tasarım ve üretim aşamalarında en çok dikkat edilen kısım hassasiyetinin yüksek olmasıdır.
Yapılan algılayıcı piyezo malzemenin, uygulanan kuvvetle doğru orantılı değişen direncini ölçerek ağırlığın ölçümünü yapmaktadır. Piyezo malzeme uygulanmış dirsek şeklindeki algılayıcı, okuma devresi amacıyla, Wheatstone köprüsüne bağlanmıştır. Piyezo malzeme olarak üretim sürecini kolaylaştırması sebebiyle grafit esaslı macun kullanılmıştır. Wheatstone köprüsündeki voltaj değişimi grafit direncin değişimiyle, o da kağıda uygulanan kuvvetle doğru orantılıdır. Algılayıc bu doğrusal değişimleri kullanarak ölçüm yapmaktadır.
Piyezodirencin özelliğiyle üretilen bu algılayıcıyı, literatürdeki diğer basınç algılayıcılardan ayıran en önemli özelliği, yükseltmek amacıyla manyetik alanın kullanılmasıdır. Mıknatısla çekilebilen ve dirseğin uç kısmına yerleştirilen parçacıklar, mıknatıs etkisiyle efektif ağırlıkları arttırılarak ölçülmüştür. Bu sayede 20 mg aralıklarla ölçümü yapılabilen ağırlıklar 0.3 mg aralıklarla ölçülebilir hale gelmiştir.
Hassasiyeti 0.3 mg olan bu algılayıcı manyetiksel olarak aktif maddelerin ağırlığını ölçebilmektedir ve biyoalgılayıcıya kolaylıkla dönüştürülebilmektedir. Yapılması gereken tek şey MNP (manyetik nano parçacıklar)’ın biyolojik/kimyasal elementlere bağlanarak manyetiksel olarak aktifleştirilmesidir. Bu aktifleştirme işleminden sonra bir solüsyondaki biyolojik/kimyasal parçacığın ağırlığı ölçülebilmektedir.
ACKNOWLEDGEMENT ... iii
ABSTRACT ... iv
ÖZET ... v
TABLE OF CONTENTS ... vi
LIST OF FIGURES ... viii
LIST OF TABLES ... xi
LIST OF SYMBOLS/ABBREVIATION ... xii
1. INTRODUCTION ... 1
1.1. MEMS DEVICES ... 1
1.2. BIOSENSORS ... 6
1.3. METHODOLOGY ... 9
2. MECHANICAL DESIGN AND SIMULATIONS ... 13
2.1. CANTILEVER MECHANICS ... 13
2.2. MICROSTRUCTURE DESIGNS ... 15
3. ELECTRICAL DESIGNS AND CALCULATIONS ... 23
3.1. READ-OUT CIRCUITRY ... 23
3.1.1. Wheatstone Bridge Circuit ... 23
3.1.2. Optimization of Wheatstone Bridge ... 24
3.2. GRAPHITE ... 26
3.2.1. Material Property ... 26
3.3. PIEZORESISTIVITY ... 27
3.4. OPTIMIZATION OF PIEZORESISTOR ... 30
3.4.1. Heating ... 30
3.4.3. Experimental Analysis of Piezoresistive Material ... 35
4. IMPLEMENTATION METHODS ... 39
4.1. ADDITIONAL PARTS ... 39
4.1.1. Borders and Alignment Platform ... 39
4.1.2. Cantilever Base and Stencils ... 41
4.2. SCREEN PRINTING IMPLEMENTATION ... 42
5. RESULTS AND DISCUSSION ... 44
5.1. TEST SETUP ... 44
5.2. TEST RESULTS ... 45
5.3. DISCUSSION ... 49
6. SUMMARY AND CONCLUSION ... 52
REFERENCES ... 54
APPENDIX A: Modified Printers ... 61
Silver Ink Printing ... 61
Protein Ink Printing ... 62
APPENDIX B: METHODOLOGY OF PIEZORESISTIVE BIOSENSOR ... 65
LIST OF FIGURES
Figure 1.1. Schematic of MEMS Devices [2] ... 1
Figure 1.2. Thermal Couples [18] ... 2
Figure 1.3. HEPAs types and their on/off positions [34] ... 4
Figure 1.4. Structure and Operation Principle of Biosensors ... 6
Figure 1.5. Classification of Biosensors ... 7
Figure 1.6. Operation Principle of SPR Biosensors (a) three layers’ geometry for excited surface plasmon. A surface plasmon wave is excited in the metal interface. (b) SPR reaction [48]. ... 8
Figure 1.7. Schematics of proposed weight sensor. ... 11
Figure 1.8. Wheatstone Bridge Circuit ... 11
Figure 1.9. Schematics of proposed weight sensor that uses the magnetic mass increase scheme ... 12
Figure 2.1. Flexural beams of different combination of boundary conditions ... 14
Figure 2.2. A fixed-free beam with dimensions l, w, t under applied force (F). ... 14
Figure 2.3. Microstructure designs with various dimensions. (Dimensions are shown in Table 2.2,2.3,2.4,2.5) ... 16
Figure 2.4. Simulation results of first cantilever whose parameters are given in Table 2.2 19 Figure 2.5. Simulation results of second cantilever whose parameters are given in Table 2.3. ... 19
Figure 2.6. Simulation results of serpentine cantilever whose parameters are given in Table 2.4. ... 20
Figure 2.7. Simulation results of bridge structure whose parameters are given in Table 2.5. ... 20
Figure 2.8. Simulation results of Bristol paper (400µm) and Photocopy paper (88µm) (A)Displacement of first design with various dimensions under 1N/m applied load (B)Stress of first design with various dimensions under 1N/m applied load ... 21
Figure 2.9. Displacement and Stress Graph of selected cantilever design where the properties of 400µm Bristol paper is used. ... 22
Figure 3.1. Wheatstone Bridge calculation graphs showing the relation between (A) RPR -Vout and (B) R2- Vout ... 25
Figure 3.2. Comparison of theoretical and measurement results showing the relation between
RPR and Vout. ... 25
Figure 3.3. Graphite Molecular Structure [74] ... 26
Figure 3.4. Longitudinal strain of the beam under pure bending. ... 28
Figure 3.5. Free-end cantilever design under applied force (F) with dimensions l, w, t. .... 28
Figure 3.6. Cantilever with the piezoresistor (A) Thin layer of piezoresistor (doped) (B)Thin layer of piezoresistor (deposited) (C) Thick layer of piezoresistor (doped) (D)Thick layer of piezoresistor (deposited) ... 29
Figure 3.7. Heating Test of Graphite (A)Implemented graphite resistors on the cantilever for heating test. Dimensions of conductive lines are given with width and length respectively. (1)4mm*10mm, (2)2mm*10mm, (3)1mm*10mm, (4)2mm*20mm, (5)2mm*30mm. (B) Resistance-time graph of piezoresistors ... 30
Figure 3.8. Theoretical Expression Graph of Width and Voltage Change ... 33
Figure 3.9. Mathematical Expression Graph of Length and Width ... 34
Figure 3.10. Alternative shapes for implementation of graphite ink ... 34
Figure 3.11. Conductive lines are produced by using graphite ink (A) 2mm width, 18,16,14 and 12 mm length respectively. (B) 5mm width, 18,16,14 and 12 mm length respectively. (C) 6mm width, 18,16,14 and 12 mm length respectively. (D) Conductive lines’ resistance change are tested under same force (5mN) ... 35
Figure 3.12. Piezoresistance shapes with different length and width ... 36
Figure 3.13. The length effect of piezoresistors in resistance change. ... 36
Figure 3.14. Different designs for implementation of graphite ink. ... 37
Figure 3.15. Implemented Graphite Ink ... 38
Figure 4.1. Additional Parts for Alignment and Fastening (A)Cantilever based with borders (B)Graphite stencil (C)Silver stencil (D)Alignment platform ... 39
Figure 4.2. Drawing of Sensor (Dimensions are given in Table 2.6) ... 40
Figure 4.3. Fabrication steps of weight sensor ... 42
Figure 5.1. Schematic of Test Setup for Weight Sensor with Magnetic Amplifier. ... 45
Figure 5.2. Weight Test correspond to Voltage and Weight Relation ... 46
Figure 5.3. Weight Test for Observing Deformation ... 47
Figure 5.4. Displacement Test for both Loading and Unloading ... 48
Figure 5.5. Weight Test with Magnetically Amplified Sensor ... 48
Figure 5.7. Weight and Change in Output Voltage Graph for Both Devices ... 51 Figure 5.8. Comparison of Weight Sensors ... 51 Figure 0.1. Brother MFC-J200 (A)Original printer (B) Addition of silver nanoparticle ink to the fillable cartridge (C) Printer without the covers ... 61 Figure 0.2. Calibration Test (A)Silver ink printed conductive line and black ink printed nonconductive line (B)Calibration test results ... 62 Figure 0.3. Epson L110 (A)Original printer (B )Addition of protein ink to the cartridge entrance (C) Printer without the covers ... 63 Figure 0.4. Calibration test for protein ink printing. (A) Vertically and horizontally protein ink printing. (B) Vertically and horizontally black ink printing. (C) Rotated (90 degree) and zoomed printed protein lines. (D) Calibration test results for both measurement microscope and ImageJ ... 64 Figure 0.1. (A) Types of Biological/Chemical Components (B)Initial condition of the Biosensor (C)Electro Coil is activated (D) The Force of the electro coil is at maximum value ... 65
LIST OF TABLES
Table 2.1. Relation between the boundary conditions and the degree of freedom. ... 13 Table 2.2. The basic designs with dimensions; width (w), thickness (t) and length (l). The parameters are given in µm range. ... 17 Table 2.3. The fixed-free end designs with dimensions; width (w) and length (L). The parameters are given in µm range. ... 17 Table 2.4. The serpentine designs with dimensions; width (w) and length (L). The parameters are given in mm range. ... 18 Table 2.5. The fixed-free end designs with dimensions; width (W) and length (L). The parameters are given in µm range. Existence of the cantilever is marked as X. ... 18 Table 4.1. Dimensions of Cantilever, Graphite Resistor and Silver Contact Pad ... 41 Table 6.1. Comparison table of weight sensors ... 52
LIST OF SYMBOLS/ABBREVIATION
Ɵ Bending angle F Applied Force L Length E Young’s modulus I Moment of inertia x Displacement k Spring constant w Width t Thickness Lc Length of cantilever wc Width of cantilever tc Thickness of cantilever ֯C Centigrade Q Diameter D Design ρ, σ Resistivity A Cross-section area RPR(ε) Piezoresistance ΔRPR(ε) Resistance change ΔL Length change G Gauss factor ε Stressεmax Maximum stress
M(x) Moment
Ω Ohm
Vout Output voltage
Vin Input voltage
ΔVout Output voltage change
1. INTRODUCTION
1.1. MEMS DEVICES
The device of Micro Electro Mechanical System (MEMS) are divided into two groups; (a) sensors and (b) actuators. Sensors detect a specific input, such as light, gas, pressure, heat or force, from the physical environment to which it creates a response, mostly an electrical signal. Actuators, on the other hand, convert energy into movement which are mainly used in motors, pumps, switches, robotic arms and valves [1].
Figure 1.1. Schematic of MEMS Devices [2]
As seen in Figure 1.1, regarding their sensing and actuating principles, MEMS devices can be divided into mainly five distinct groups. These groups are (i) electrostatic [3] [4], (ii) thermal [5] [6], (iii) magnetic [7], (iv) piezoresistive [2] [8] [9] and (v) piezoelectric [10].
Electrostatic sensors are to measure the increase of capacitance which occurs between two oppositely charged conductors [11] [12]. Electrostatic actuators, on the other hand, are induced by electrostatic force which is occurred as a result of interaction of the two oppositely charged conductors under the applied voltage [13].
Thermal sensors aim to detect the temperature change by using various sensing methods, and the most commonly used ones are thermal couples, thermal resistive sensors and thermal
bi-morph sensors. In thermal resistive sensors, a material, whose resistance is subject to changes in accordance with the temperature change, is used [14] [15]. Thermal bi-morphs are composed of two merged materials by their longitudinal axis. Their axis faces different amount of elongation due to their different material properties. Consequently, the structure bends to the side which lengthens less [16]. Lastly, as it is seen in Figure 1.2, thermal couples are formed of two wires of dissimilar materials which are situated closely on one side so that they are able to connect at a point. There occurs a temperature difference between the sensing (measuring) junction and the reference junction. This temperature difference creates currents [17]. Apart from this, thermal actuation happens when the change in temperature of the microscale devices or structures cause mechanical displacement or creates force as an output.
Figure 1.2. Thermal Couples [18]
Magnetic sensors generally use the magneto-resistive effect and the hall effect to measure the magnetic field. For magnetic actuators, permanent magnets or magnetic coils are mostly used to generate a moving force by creating magnetic field [7].
Piezoresistive sensors are made of piezoresistive materials. Their property called piezoresistivity makes the material to be subject to resistance change when the stress is applied [19] [20] [21].
Piezoelectric sensors exist by the virtue of some materials’ properties such as Rochelle salt and quartz since those generate voltage or electric charge as a result of a mechanical
deformation [22] [23] [24]. And the opposite result is achieved by piezoelectric actuator since it transforms voltage or current change into mechanical deformation [25] [26].
Besides the types of MEMS devices, it is also important to examine the production of them. The primary material of MEMS devices is silicon [27]. It is used as a base material and since it is not flexible, chemical and mechanical etching can be applied for silicon slenderizing. However, those methods requiring advance fabrication techniques make the production process challenging. Additionally, the clean room equipment and laboratories are needed to produce and the manufacturing process can quickly escalate in complexity. As a consequence, the costs of silicon-based devices increase significantly.
New alternative to silicon-based MEMS device is paper-based design which enables to eliminate the disadvantages of silicon. Paper is lightweight, ubiquitous and easily disposable by incineration. It is flexible and can be easily shaped by laser cutter. Moreover, the manufacturing process of paper-based devices is faster, simpler and more inexpensive since it does not require clean room facilities and complicated fabrication techniques.
The advantage of paper was recognized in early twenties. One of the most important development in paper usage is the start of using filter papers in analyze laboratories. The novelty of filter paper is its contribution to acquirement of reliable results with a trace amount of sample. The filter paper was firstly produced by Martin and Synge in 1952 [28] [29] and it was used in the significant research of Whitesides et all which is called P-ELISA(Paper-basedEnzyme-LinkedImmuno SorbentAssay) [30]. ELISA as a quantitative measurement technic was known and used by other scholars to detect the antigen or antibody. Following the method, a sample is put in a solution including antigen or antibody and if a reaction occurs, it is detected that the other particle, antigen or antibody, exists in the sample as well. [31]. P-ELISA is based on same principle but filter paper is used as a base so the samples and solutions are dripped on the filter paper. Consequently, the detection is achieved with a trace amount of sample and it prevented the waste of the products. The technic has led to other projects which use the cellulose based materials to detect the biological or chemical molecules.
Moreover, the advancement in biosensors by paper usage has been reflected to MEMS field. In last decades, cellulose base materials have been successfully adapted to MEMS actuators and sensors as a main production material. Since cellulose-based materials are disposable and low-cost, their usage as a base in MEMS device has increased significantly [32]. Additionally, the production process of paper-based devices does require neither as much labor force, nor as high qualification to produce as microfabrication technics.
One of the prominent instance of the usage of paper-based MEMS device is conducted by Martinez et all by developing a pneumatic actuator. In the research, both elastomer (Ecoflex) and easily bendable sheet are used to generate actuators. These actuators with pressurization are capable of complex motions which cannot be achieved by hard robots [33]. A different paper based actuator is developed by Hamedi et all. The actuator in this research is activated via electric and it is called HEPAs (Hydroexpansive Electrothermal Paper Actuators). With various configuration of paper and PEDOT: PSS composite, four types of HEPAs (straight, pre-curved, creased-curved and creased-sawtooth) are produced. The Figure 1.3 shows the types of HEPAs and their movements [34].
Figure 1.3. HEPAs types and their on/off positions [34]
Paper-based MEMS devices also include sensors, one of which is the microfluidic device. µPEDs (Microfluidic Paper-based Electrochemical Devices) are one of the microfluidic devices which is produced only by adhesive tape, ink and paper. It is designed to detect for both glucose and heavy-metal ions [35]. Another paper-based sensor is capacitive touch pad. This pad is fabricated by metallized paper and double-sided tape. This structure functions as capacitive key and gives binary responses [36].
It is indicated by my literature search that there are several studies conducted to create paper based piezoresistive sensors. The similar trend has occurred resulting in the replacement of silicon with paper for a base of piezoresistive sensors. In one of the conducted research, chromatography filter paper is cut in a cantilever shape and graphite is used as a piezoresistor. This system’s response is examined by Wheatstone bridge circuit and weight is measured with the limit of detection(LOD)/resolution as 15g/25mg. This sensor is produced by screen printing method with simple laboratory equipment in sixty minutes [37].
Similar sensor is made by Yang et all. The aim of this research is to eliminate the necessity of laboratory. An ordinary photocopy paper, a pencil (2B) and scissors are used. Despite the fact that it has a worse rate (20g/50mg), the sensor is managed to be produced faster (thirty minutes) without laboratory equipment [38]. Another piezoresistive pressure sensor is developed by Crowley et all. In the research, the wind velocity, which is equal or higher than 3m/s, is measured by the sensor [39]. The disadvantage of paper based sensors is their single-use characteristic. It has been eliminated by Bailey et all by using PEN (Poly Ethylene Naphthalate) to generate a disposable piezoresistive sensor. This sensor gives reliable results in up to hundred thousand tests [40].
In brief, the increased use of cellulose based MEMS devices can be traced back in time as the benefits of cellulose, such as low cost and easiness in production process, has been taken advantage of by scientists.
The benefits of cellulose based materials explained above are taken into consideration to develop this thesis as well. Various types of paper and PLA are taken benefit of to generate a weight sensor. Besides, the thesis takes the advantage of piezoresistive materials to contribute the production of the sensor. As explained below [see section 1.3], resistance of piezoresistive materials, such as graphite, doped-silicon and germanium, change under mechanical deformation caused by applied stress. This property provides opportunity to measure the electrical response of applied force. In addition to that, graphite has an easiness in implementation which makes it a prior choice. Therefore, in this thesis, graphite is utilized as a piezoresistor. The material property of graphite is explained more detail in section 3.2.
1.2. BIOSENSORS
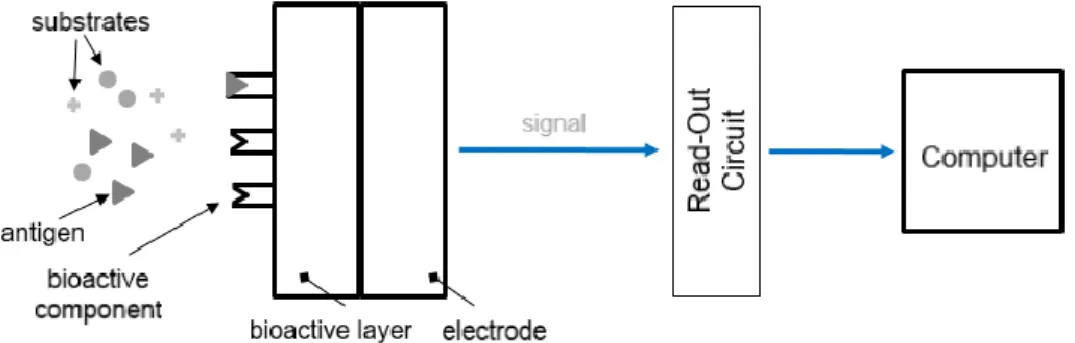
Biosensor as a terminology in science was first appeared in 1977 with the development of a sensor composed of an enzyme and an electrode and hence, called as a biosensor [41]. The main function of a biosensor is to measure the electrical response of biological reactions [42] [43]. As seen in Figure 1.4, in the older type of biosensor, there are only two main parts. One of them is called receptor which collects the required particles in the mixed solution and based on the reaction of these particles, it sends signals to transmission [44] [45]. These signals are transformed into readable electrical responses by the converter. Both transmission and converter form the second part of the biosensor called transformer.
Figure 1.4. Structure and Operation Principle of Biosensors
In the present, biosensors are developed with three main parts instead of two to increase the reliability of detection and to decrease the signal noise ratio (SNR). In addition to receptor and transformer which are traditional biosensor parts, reference element is added as a third part [41]. Different to the receptor, reference element does not include any biological particles and hence, no biological reaction takes place. The purpose of this element is to eliminate the effects of the environmental conditions or the minor device problems.
Biosensors can be examined under five groups based on bioactive layer-transmission and detection methods. As it is seen in Figure 1.5, these groups are (a) electrochemical in other words amperometric [46] [47], potentiometric [48] [49], voltametric [50] [51], voltamperometric [52] and conductometric biosensors [53]; (b) piezoelectric based biosensors [54] [55]; (c) calorimetric in other words thermistors [56] [57]; (d) piezoresistive
biosensors [58] [59] and lastly (e) optic based namely photometric [60] [61], fluorometric [62] [63] and bioluminescence [64] [65] biosensors.
Figure 1.5. Classification of Biosensors
In literature, the first amperometric sensor was generated by Prof. L.C. Clark Jnr. in 1956, then it was called as biosensor regarding its properties [66]. This biosensor which is called Clark Electrode is used to detect the oxygen level. Clark Electrode and other amperometric sensors mainly measure the current that occurs in accordance with the number of electrons. these electrons release due to the chemical oxidation reaction or reduction reactions in the electrochemical cells. In present, amperometric biosensors are still used as blood sugar detection devices. Alternatively, potentiometric biosensors are produced in the literature. This kind of sensors detects the changes in potentials of electrodes without applying additional voltage. Changes in potential occur in the electrochemical cells because of the chemical reaction of the electrodes [46]. The research conducted by Rechnitz et all can be given as a prominent instance of use of potentiometric biosensors in which they successfully measured the amount of urea by urease hydrolysis [46].
Other group of biosensors is optic based sensors whose mostly known example is Surface Plasmon Resonance (SPR). This type of sensor was firstly used by Liedberg et all to observe the real-time interaction [67]. In 1990, BI Acore, which is based on SPR principle, was produced and released by Pharmacia company [68]. The operation principle of SPR biosensors is briefly shown in Figure 1.6. In the SPR-based biosensors, when biochemical reactions on the sensing surface change the refraction index, the resonance angle and SPR are impacted. The resonance is created as a result of optical excitement on the interface between the conductive metal membrane and dielectric material. Hence, the ratio of
biological elements in the sample is sensitively quantified. Another optic based biosensor is brought out by Lubbers and Opitz [67]. They produced a fiber-optic biosensor which was called Optode. It quantifies the amount of oxygen and carbon dioxide which is released as a result of oxidase reactions [42].
Figure 1.6. Operation Principle of SPR Biosensors (a) three layers’ geometry for excited surface plasmon. A surface plasmon wave is excited in the metal interface. (b) SPR reaction [48].
Distinct from the groups based on the bioactive surface and measurement methods as shown in the Figure 1.5, the biosensors can also be grouped based on the relation of particles and their bioactive components. Under this method, three groups can be set, which are (1) biocatalytic (microorganism and enzyme used) biosensors, (2) microbe based biosensors and lastly (3) bioaffinity (antigen/antibody or receptor/ligand alike interaction used) biosensors [45]. The first biosensor of the biocatalytic group was produced in 1964 by Yahiro et all. In the sensor, the glycose/O2 is used as a fuel cell catalyst as well as an enzyme in the biofuel cell [69]. The idea of merging antibody to piezoelectric or potentiometric sensors leads to biocatalytic based biosensors. Ishiguro et all produced a biocatalytic sensor and published the related article in 1976 [70]. In the same year, another biosensor was produced by using a microbe which was the first of the second group of biosensors, namely microbe based biosensors [71]. The corn microbe was used to measure the rate of mutation of a corn which was due to the plant killing chemicals.
The aim of the thesis has been to generate a piezoresistive weight sensor which is to be used in production of piezoresistive biosensors in the further steps of the project. This potential sensor is planned to be part of bioaffinity group that can get benefits from the relation between the antigen-antibody. In the concept of this thesis, cellulose based piezoresistive
weight sensor is produced by fast and easy fabrication methods. In the further steps, it is planned that instead of measuring weight, the biological particles will be detected and quantified by using it as a biosensor. The sensor can be used to detect biological and chemical particles like cells, aflatoxin and DNA.
1.3. METHODOLOGY
The primary aim of this thesis as mentioned below is to generate a weight sensor which can be adapted as a piezoresistive biosensor. The biosensor will be basically composed of a paper-based microstructure, a read-out circuit and a magnet as depicted in Figure 1.7. This biosensor will recognize the existence and/or measure the amount of the biological/chemical particles.
The operation principle of the piezoresistive biosensor relies on the ELISA method of antigen/antibody. In the ELISA method, the key lock behavior of antigen and antibody is used to detect the antigens. Antigens bind only a specific antibody and the detection methods get benefits from this property. The antigens are marked with gold or latex nano particles. These particles are observable colors under the microscope. When the sample is mixed with the antibody solution, antigens and antibodies are bond to each other. Antibodies are mostly used to get rid of the unnecessary particles that the sample includes. Then, only marked antigens with antibodies are stayed. Under the microscope, the color concentration is observed to the amount of gold or latex particles which are equal to the amount of antigens.
In contrary to traditional ELISA method, in the furtherance study, the piezoresistive biosensor gets benefits from the magnetic nano particles (MNP). Instead of the gold or latex nano particles, MNP will bound to antigens and the number of them will be equal to the antigens. MNP is a magnetically active particle since it includes iron atoms. When the magnetic amplifier is active, the existence of MNP provides to increase the effective mass of biological component that is mainly composed of antigen, antibody and MNP and may also include additional biological particles like protein. The magnetically active component is pulled down by the magnetic amplifier since the amplifier creates a magnetic field with the help of magnet/electro-coil. Therefore, the magnetic amplifier is worked like increase in gravitation. This increase also causes an increase in effective mass of biological component
that makes the weight measurement possible with the paper based piezoresistive weight sensor.
Achieving this sensor is the main aim of this thesis and its working principle depends on the property of piezoresistive material. As shortly mentioned above, this kind of materials like graphite is sensitive to stress. The stress is occurred by the mechanical deformation which is caused by applied force. In substance, the applied force increases the stress level which is affected the piezoresistive material. The response of the piezoresistive material to the stress is to change the value of its resistance. This change is directly bonded to the applied force which is created by the interaction of biological component and the magnetic amplifier and its amplitude is linearly related to the amount of the biological component. Therefore, the value in resistance change of piezoresistive material corresponds to the amount of biological component.
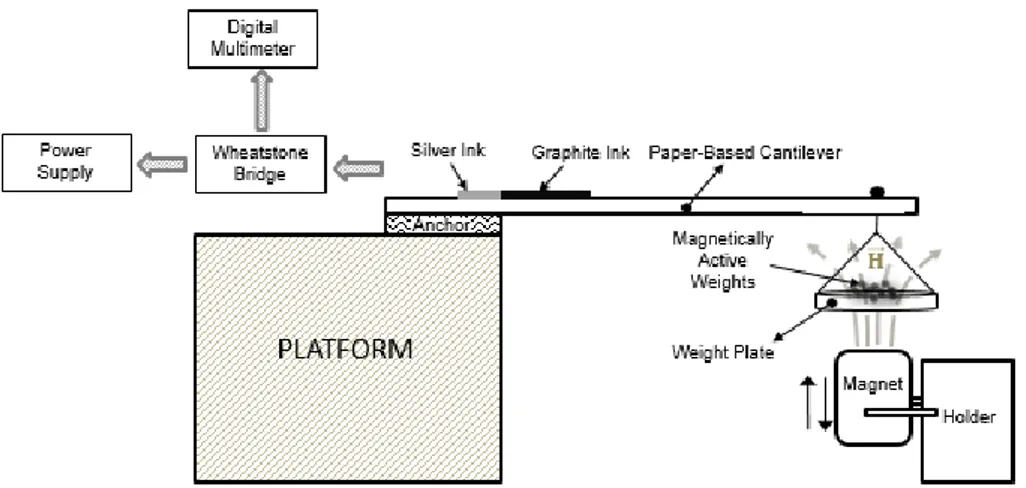
In order to achieving the detection of biological/chemical particles with weight, two different weight sensor device is prepared. In the first device (piezoresistive weight sensor without magnetic amplifier), there are three components; read-out circuit, cantilever and weight plate as seen in Figure 1.7. First component, the read-out circuit is composed of power supply which provides input voltage of the circuit, digital multimeter that is necessary to measure the output voltage of the circuit and the Wheatstone bridge which is essential to eliminate the environmental impact on the output voltage. Second component, the cantilever that can be also named as weight sensor includes paper base, graphite coated area (piezoresistive layer/piezoresistor) and silver coated area (contact pad). Third component, weight plate, a place to put the weights that are to be measured, is tied by a rope to the free end of the cantilever.
Figure 1.7. Schematics of proposed weight sensor.
Besides the components of weight sensor device, it is also important to examine the relation of the components with each other. When the weight is put into the weight plate, the rope pulls down the free-end of the cantilever. The free-end of cantilever bends as much as the amount of the weight. This bending cause mechanical deformation which increases the amount of stress that occurs in the fixed-end of the cantilever. The higher level of stress changes the value of piezoresistor which is located on the surface of the paper based as seen in Figure 1.7.
Figure 1.8. Wheatstone Bridge Circuit
The piezoresistor is connected to the Wheatstone bridge and this connection is provided by the silver contact pads. The connection is seen in Figure 1.8. The relation between the Rpr(ε)
and the Vout(ε) is given in Equation 1.1.
𝑉
𝑜𝑢𝑡(ε) =
(𝑅 𝑅22+𝑅𝑃𝑅(ε)
−
𝑅4
𝑅4+𝑅3)
𝑉
𝑖𝑛 (1.1)Rpr(ε) represents the piezoresistor, which changes its value with the stress ε, where Vout(ε)
of output voltage is inversely proportional to the value in resistance change of piezoresistive layer. As a consequence, the value in output voltage change which is measured by digital multimeter is proportional to the amount of the weight.
Figure 1.9. Schematics of proposed weight sensor that uses the magnetic mass increase scheme
In the second device (piezoresistive weight sensor with magnetic amplifier), on the other hand, there are four main components as seen in Figure 1.9. The three components are same as the first device and also their interaction. Fourth component comprises of a magnet and a holder which provides z-axis movement to the magnet, in other words, up and down displacement. The fourth component is called as magnetic amplifier. As mentioned above, magnetic amplifier increases the effective mass of the weight that is put into the weight plate, when the weight is magnetically active. Hence, this device can be only used for the weights which can be pulled down with magnet. At first, the magnet touches the weight plate, then the holder pulls down the magnet until the maximum displacement occurs that the force between the weight and the magnet counterbalances the endurance force of the cantilever to the bending. Therefore, the interaction between magnetic amplifier and the weight provides more bending compare to the weight provide itself.
Furthermore, addition to these two devices, in this thesis, two distinct printers are modified to print protein and silver ink. In the further studies of the project, for converting the device to the biosensor device, free-end of cantilever is coated by albumin to fasten the biological components to the cantilever. Therefore, the printer for protein printing is necessary where the silver printer is modified to improve the fabrication process. The details about the printer modification is mentioned at Appendix A.
2. MECHANICAL DESIGN AND SIMULATIONS
2.1. CANTILEVER MECHANICS
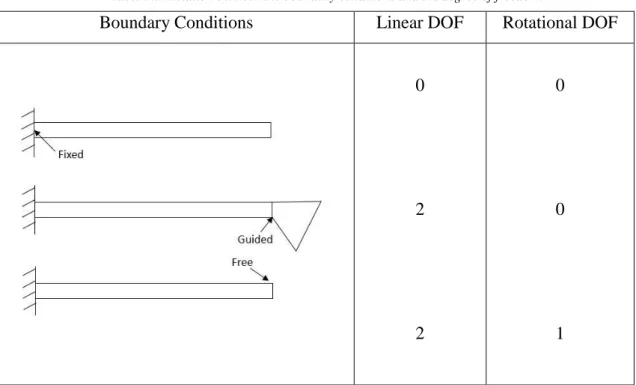
Beams are usually classified based on three boundary conditions: fixed, guided and free. Each of them has different degrees of freedom (DOF) [2].
Table 2.1. Relation between the boundary conditions and the degree of freedom.
Boundary Conditions Linear DOF Rotational DOF
0 2 2 0 0 1
The fixed end does not allow any kind of movement whereas the guided end only restricts the rotational DOF and allows the two linear DOF. The free end has the highest DOF with two linear and one rotational.
Combinations of boundary conditions are utilized for both generation of the flexural beams and the classification of them. In MEMS field, mostly the fixed-fixed (bridge), fixed-guided and fixed-free (cantilever) beams are used.
Figure 2.1. Flexural beams of different combination of boundary conditions
Figure 2.1 shows the various beam types, the most common ones in the MEMS fields. The beams are (a) a fixed-free cantilever parallel to the surface of the substrate, (b) a fixed-fixed beam parallel to the surface of the substrate, (c) two fixed end and guided boundary condition in the middle beam, (d) four fixed-guided beam connect to a rigid shuttle, (e) a fixed-free cantilever, (f) a fixed-free cantilever (the design allows the movement within the substrate), (g) a fixed-fixed beam, (h) a fixed-free beam with an object that restrict the flexural bending, (i) a bridge with the guided object in the middle, (j) a combination of several fixed-free cantilevers, (k) two fixed-free cantilevers connected in parallel [2].
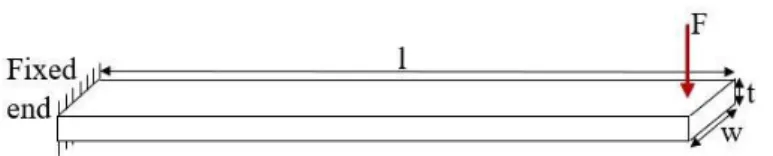
Figure 2.2. A fixed-free beam with dimensions l, w, t under applied force (F).
Fixed-free beams are called cantilevers and have two linear freedoms. First one is perpendicular to the fixed end (both up and down) and the second one is parallel to the fixed end (both left and right). In addition, cantilevers have rotational freedom thanks to their free end [2].
When the F magnitude of force is applied on the direction of the z-axis (Figure 2.2), the bent angle can be calculated by using the following equation
𝜃 =FL2
2EI
(2.1)
where the bent angle depends on force (F), length (L), Young’s modulus (E) and moment of inertia (I). Calculation of the displacement in the z-axis is calculated by same parameters, but the equation is
𝑥 =FL3
3EI
(
2.2)The spring constant (k) is also an important factor for cantilever designs and analysis. The k variable can be calculated by use of Equation 2.3, where width is w, the thickness is t.
𝑘 =F 𝐱= 3EI L3 = Ewt3 4L3
(2.3) These equations are the simplified formulas that analyze cantilever behavior. In this thesis, the comsol simulation program is used to analyze the displacement and stress characterization of the cantilever.
2.2. MICROSTRUCTURE DESIGNS
The cantilever is the most common beam type. They are mostly preferred thanks to their ease of fabrication and their usefulness, which is because cantilever design is simple and reliable that can be easily modified for different purpose and setups. Therefore, in this thesis, cantilever is preferred. The most important point of generating the device is to maximize the sensitivity of the sensor. It is analyzed by the relative change in the value of resistance as a result of the change in magnitude of applied force. It also aims to eliminate the environmental effect from the change in resistance and hence, reach more reliable results. Therefore, four different cantilever design are designed and shown in Figure 2.3. Each of design with various dimensions is simulated by Comsol software.
First design has an advantage in the fabrication process due to the dimensional limits of our fabrication method (Figure 2.3.A) whereas the expected advantage of second design is to increase the amount of displacement under the applied force (Figure 2.3.B). The third design, moroever, is a serpentine cantilever which increases the movement capacity of free end (Figure 2.3.C). The fourth design (Figure 2.3.D) is beneficial from many aspects. Connecting piezoresistor in series enables the total change in value of resistance in piezoresistive layer to increase and hence, the sensitivity of the sensor can be improved. Additionally, it provides opportunity to implement differential measurement by including more than one piezoresistances.
Figure 2.3. Microstructure designs with various dimensions. (Dimensions are shown in Table 2.2,2.3,2.4,2.5)
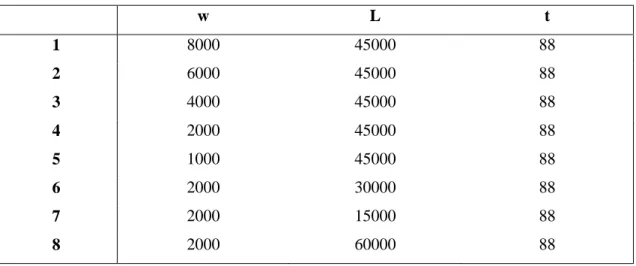
In the design under Figure 2.3 (A), eight different cantilevers are designed to identify the effect of change in width and length of cantilevers. When the length is kept constant, the width is changed to observe the effect of width on the values of displacement and stress. To the contrary, the width is kept constant while the length is changed to observe the effect of length.
Table 2.2. The basic designs with dimensions; width (w), thickness (t) and length (l). The parameters are given in µm range. w L t 1 8000 45000 88 2 6000 45000 88 3 4000 45000 88 4 2000 45000 88 5 1000 45000 88 6 2000 30000 88 7 2000 15000 88 8 2000 60000 88
In the second design under Figure 2.3 (B), eight different cantilever are designed to identify the effect of cross-section area. The fixed part of the cantilever is disintegrated into three parts as shown in the figure. Based on the parameters provided in Table 2.3, cantilevers are drawn.
Table 2.3. The fixed-free end designs with dimensions; width (w) and length (L). The parameters are given in µm range.
w1 w2 w3 w4 w5 L1 L2 L3 1 1900 1000 1900 3000 1700 5000 40000 1000 2 1230 2000 1240 3000 1700 5000 40000 1000 3 1900 1000 1900 3000 1700 5000 40000 2000 4 1230 2000 1240 3000 1700 5000 40000 2000 5 1900 1000 1900 3000 1700 5000 40000 3000 6 1230 2000 1240 3000 1700 5000 40000 3000 7 1900 1000 1900 3000 1700 5000 40000 4000 8 1230 2000 1240 3000 1700 5000 40000 4000
In the serpentine cantilever design under Figure 2.3 (C), parameters are chosen to determine the impact of serpentine shape. Additionally, the chosen parameters give opportunity to observe the effect of both the width and the length of cantilevers.
Table 2.4. The serpentine designs with dimensions; width (w) and length (L). The parameters are given in mm range. w1 L2 w3 w4 L1 w2 L3 1 1.5 5 1.5 3 15 0.1 0.3 2 1.5 5 1.5 3 30 0.1 0.3 3 1.5 5 1.5 3 15 0.2 0.6 4 1.5 5 1.5 3 30 0.2 0.6 5 1.5 5 1.5 3 60 0.2 0.6 6 1.5 5 1.5 3 25 0.5 1.5 7 1.5 5 1.5 3 50 0.5 1.5 8 1.5 5 1.5 3 75 0.5 1.5 9 1.5 5 1.5 3 25 1 3 10 1.5 5 1.5 3 50 1 3 11 1.5 5 1.5 3 75 1 3
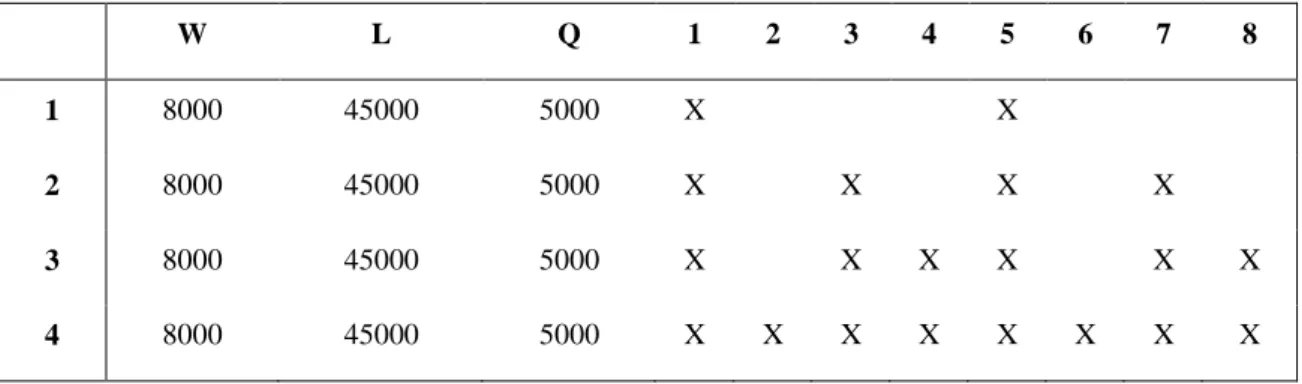
In the fourth design under Figure 2.3 (D), the cantilevers are drawn based on the chosen parameters to observe the amplitude of lost in displacement. The lost should be compared to the gain achieved by the series connection of piezoresistors. If it is acceptable or evitable, then this design will be preferred because it indicates that the sensor is more reliable.
Table 2.5. The fixed-free end designs with dimensions; width (W) and length (L). The parameters are given in µm range. Existence of the cantilever is marked as X.
W L Q 1 2 3 4 5 6 7 8
1 8000 45000 5000 X X
2 8000 45000 5000 X X X X
3 8000 45000 5000 X X X X X X
4 8000 45000 5000 X X X X X X X X
In the simulation part, the technical drawings for each design are prepared. The parameters of Figure 2.3 A, B, C and D are respectively given in Table 2.2, 2.3, 2.4 and 2.5. In the simulation, the force is applied to the edge which is located in the free-end. The magnitude of the force is equal to 1mN.
Stress and displacement results are simulated and accordingly, in Figure 2.4, 2.5, 2.6 and 2.7, maximum values of stress and displacement are given.
Figure 2.4. Simulation results of first cantilever whose parameters are given in Table 2.2
The simulation results of first design are shown in Figure 2.4. The graph points out that the length is more effective in maximizing the value of stress and displacement than the width. Hereby, the length should be maximized to generate the most sensitive sensor. Unfortunately, when the force is not applied, the cantilever cannot stay straight as it should and starts to bend as it lengthens.
The result graph of second design indicates that when the cross-section area is narrowed, the value of displacement and stress increases. Besides, it is indicated that the more the area extracted, the more cantilever bends.
Figure 2.6. Simulation results of serpentine cantilever whose parameters are given in Table 2.4.
The result graph of serpentine cantilever points out that both width and length of cantilever have influence on the magnitude of displacement and stress. When the cantilever is narrowed or lengthened, the magnitude increases.
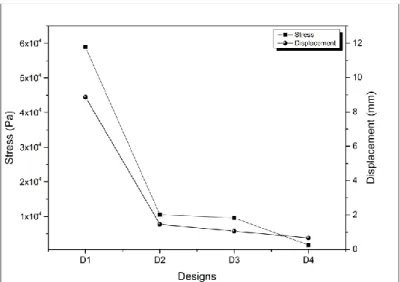
Figure 2.7. Simulation results of bridge structure whose parameters are given in Table 2.5.
The graph of bridge structure shows that the lost is neither evitable nor acceptable because each additional piezoresistor decreases the displacement value even more than it increases
the total change in the resistance. Therefore, this design cannot be preferred for the purpose of this thesis.
The results indicate that the displacement value of serpentine cantilever is the highest whereas the bridge design yields the lowest one. Although the serpentine cantilever seems as the best solution, the results may not be as reliable as others because its rotational movement causes inaccuracy in the values. Besides, its complexity makes the production process harder than the other designs. Regarding those facts, it has not become first choice in this thesis.
The displacement values of the first design (Figure 2.3 A) are not as high as the serpentine cantilever, however, it is acceptable and even selected as a cantilever shape since its fabrication process is easier. The graph indicates that the width of cantilever has a negligible effect on the values. Nevertheless, the length creates substantial difference. When the length is increased, the displacement increases as well. Due to the constraint explained above, the parameters cannot be selected in their maximum value. Hence, the drawing with the parameters 8 mm width and 45 mm length is the most suitable one. However, the dimensions are needed to be scaled by 0.79 to provide smaller sensor without changing the values. Thus, the new parameters are selected as 6,16 mm width, 35,6 mm length.
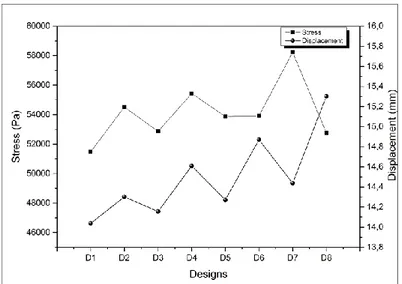
Figure 2.8. Simulation results of Bristol paper (400µm) and Photocopy paper (88µm) (A)Displacement of first design with various dimensions under 1N/m applied load (B)Stress of first design with various dimensions under 1N/m applied load
Even though the characterization of designs (cantilevers) are simulated with the properties of the photocopy paper, the cantilever is produced from Bristol paper. Therefore, the simulations for first design is repeated to observe whether the previous simulations and
assumptions are similar that can be used for fabrication without changing or not. The simulation results for both maximum displacement and stress are given in Figure 2.8. The similarity of the curves points out that the length and width effect in both material is same. Therefore, the selection of the dimensions should be similar. Additionally, the new material enables to lengthen the cantilever, nevertheless, the length is preferred not to be changed. It is because addition of the weight plate causes the cantilever to bend if the length is elongated. Moreover, the first design with selected dimensions (6.16mm width, 35,6 mm length) is simulated to observe the values in displacement and stress under various applied force.
Figure 2.9. Displacement and Stress Graph of selected cantilever design where the properties of 400µm Bristol paper is used.
In Figure 2.9, the values in displacement and stress is given. The data indicate that displacement and stress level is linearly proportional to the applied force. Therefore, in the experiment, the results should be linearly proportional quantities if the weight is in the range of sensor.
3. ELECTRICAL DESIGNS AND CALCULATIONS
3.1. READ-OUT CIRCUITRY
3.1.1. Wheatstone Bridge Circuit
Piezoresistive materials are the most widespread material in the MEMS field, especially to fabricate sensors, however, their property of being temperature sensitive declines their ability to yield reliable results. Therefore, it has utmost importance to eliminate external temperature impact on the results [2]. Bridge configuration is the mostly used way to achieve this mainly because they are portable and easily adaptable. In bridge configuration, more than one resistance is used and since all resistances are impacted equally from the external temperature, its effect on the circuit design’s output is managed to be restricted. The most commonly used bridge type for piezoresistive materials is the Wheatstone bridge circuit.
Wheatstone bridge is a circuit configuration with three resistances and a piezoresistance. It is effective to measure the values of the piezoresistances which are between 1Ω-1MΩ [72]. In other words, piezoresistances with values less than 1Ω or more than 1MΩ cannot be measured accurately. Outside of the range, the sensitivity and the accuracy of the measurement decrease. In the range, however, the value of resistance can be measured with the margin of error being 0.1%.
𝑉
𝑜𝑢𝑡(ε) =
(𝑅 𝑅2 2+𝑅𝑃𝑅(ε)−
𝑅4 𝑅4+𝑅3)𝑉
𝑖𝑛 (3.1)𝑅
𝑃𝑅(ε) =
𝑅2[(
𝑉𝑜𝑢𝑡(𝜀) 𝑉𝑖𝑛 + 𝑅4 𝑅4+𝑅3)
−1 − 1]
(3.2)In order to calculate the value of output voltage and the value of piezoresistance (RPR), the
3.1.2. Optimization of Wheatstone Bridge
In an attempt to find the optimum values of resistance, calculations are completed. The governing equation for a Wheatstone bridge circuit is given in Equation 3.1 where RPR (0) is
the initial resistance value of the unbent cantilever. One should remind that the magnitude of RPR (ε) is changing with the stress ε that occurs on the paper-based cantilever, same as the
magnitude of Vout (ε).
Our primary goal is to be able to detect minimum changes on RPR (ε), hence to increase the
resolution of the proposed cantilever. This resolution improvement will make the measurement of milligram range weights possible. To be able to detect even the slightest change on RPR (ε), one should maximize the related change of Vout(ε).
In order to maximize the magnitude of Vout (ε), the term R4/(R4+R3) in Equation 3.35 should
converge to zero. Therefore, the value of R3 in Equation 3.1 should be maximized, whereas
the value of R4 should be minimized. For this reason, the magnitude of R3 and R4 are chosen
as 1kΩ and 1Ω, respectively.
Assuming a negligible R4/(R4+R3) term; the relation between RPR, R2 and Vout is investigated
using Matlab software tools. The relation of RPR and Vout is depicted in Figure 3.2 (A), for
different R2 values. As it mentioned above, our main aim is to increase the sensitivity and
the resolution of the sensor. Therefore, large value of ΔVout and slope angle is necessary to
be able to detect slight RPR (ε) changes (ΔRPR). As it is seen in Figure 3.2 (A), the magnitude
of RPR is inversely related to the output voltage. Hereby the value of RPR (0) should be as
small as possible. Additionally, small value of R2 is required to have a large slope angle that
facilitate the detection, whereas at the same time decreasing R2 unlimitedly will create
Figure 3.1. Wheatstone Bridge calculation graphs showing the relation between (A) RPR -Vout and (B) R2- Vout
In Figure 3.2 (B), ΔVout versus R2 plot is drawn for different RPR (0) values, where RPR(0) is
the initial resistance value of piezoresistor when there is no bending in the cantilever. The ΔVout represents the output voltage difference between for 1Ω increase of a given RPR (0).
As it can be deduced from Figure 3.2 (B), the peak values of ΔVout occurs where the values
of R2 and RPR (0) are equal to each other.
In short, for the increased sensitivity, the slope of Vout-RPR plot (dVout/dRPR) should be large,
where the ΔVout should be maximized. This means that R2 should be small, while the initial
value of RPR (0) converges to R2. Thus, the R2 value should be preferred to be lower than
200 Ω.
In order to compare the theoretical and experimental results, a Wheatstone bridge circuit is implemented. Using the Equation 3.1, the magnitudes of Vin, R2, R3 and R4 are chosen as
12 Volt, 200 Ω, 1 kΩ and 1 Ω, respectively. The magnitude of Vout (0) is drawn for different
RPR (0) values in Figure 3.3. The plot indicates that the difference between the measurement
results and expected ones are negligibly close to each other.
3.2. GRAPHITE
3.2.1. Material Property
Carbon atom is a non-metallic element which is located in 4A group in the periodic table. Its atomic number is 6 [73]. Carbon atoms can be bound to each other with different combinations and these distinct combinations create various products such as diamond and graphite. Despite of the fact that both are composed of carbon atoms, there is a strong distinction between diamond and graphite in their molecular structure. Diamond has a covalent lattice structure which makes it rigid and insoluble [74].
Figure 3.3. Graphite Molecular Structure [74]
In contrast, graphite has a strong hexagonal binding structure and a weak bond between the layers as shown in Figure 3.4 [74]. This structure makes graphite conductive and piezoresistive and consequently, the force can easily break the bonds between layers and make electrons free. Graphite is also soluble in water. These features enable graphite to be easily implemented on the paper. Additionally, graphite is accessible easily and with low cost. Therefore, it is the most suitable choice as a piezoresistor in this thesis.
3.3. PIEZORESISTIVITY
Value of piezoresistor faces a proportionate change with the amount of experienced strain. This property of piezoresistors provides rectilinear transduction mechanism between the mechanical and electrical domains.
The value of resistors is represented in the following equation where is the resistivity, A is the cross-section area and L is the length of the resistor [2].
R = 𝛒𝐋
𝐀 (3.3)
Therefore, the value of piezoresistor changes dependently on both the dimensions of the resistor and the resistivity. The value of piezoresistor changes when a force is applied because the force has impact on stress level which has further impact on all of the variables in Equation 3.3. Firstly, force causes an increase in the length of the piezoresistor which, however, does not change the value itself. It is because the cross section area also increases under the force which helps keeping the value of piezoresistor approximately constant. The resistivity effect, to the contrary, changing under the applied force has a greater influence on the value. Therefore, the piezoresistor can be defined as the resistor whose resistivity value changes proportionately with the applied forced.
When it is defined in microscopic scale, the relation between the applied force and the change in the value of resistance is accepted linear being formulized as
G =
∆𝑅𝜀𝑅 (3.4)
where G is the gauge factor of a piezoresistor [2]. The gauge factor changes dependently on the material property and on temperature. In order to eliminate the temperature’s impact on G, and hence on the resistor, the Wheatstone bridge circuit configuration is often used. In section 3.1, it is examined in detail.
It is further important to examine the increase of stress under the force applied. When there is pure bending, the only strain emanated is longitudinal. The force applied on a beam bends its axis into a curve (Figure 3.5). The plane passing from nq points is bent as a convex which causes elongation and tension. Besides, the upper part of the beam is bent as a concave which causes contraction and compression. Between the concave and convex part of the beam, there is a place left undistorted. This cross-section plane is shown as st-plane in the Figure 3.5 and called as neutral surface. If the beam is uniform, the neutral surface is located right in the middle. As the distance between an interior point and the neutral axis increases, the magnitude of stress increases with a linear proportionate which is a result of the symmetry and material homogeneity of the beam. Therefore, the maximum stress level is observed on the top or bottom surface of the beam which is equal for both tensile and compressive stress.
Figure 3.4. Longitudinal strain of the beam under pure bending.
Furthermore, for the cantilever design that is shown in Figure 3.6, it should be emphasized that the magnitude of the stress increases from free-end to fixed end. Hence, the maximum stress level is observed at the closest point to the fixed end.
Figure 3.5. Free-end cantilever design under applied force (F) with dimensions l, w, t.
Based on two aforementioned results, the piezoresistive material should be implemented at a point on the surface and close to fix-end where the stress level is maximum. It is to increase the impact of the applied force on the resistance change.
The Equation 3.5 expresses the maximum stress in the cantilever, where M(x) is the total torque, E is the Young’s modulus and I is the moment of inertia.
ɛ
𝑚𝑎𝑥=
𝑀(𝑥)𝑡2𝐸𝐼 (3.5)
For the maximum torque, the maximum stress can be rewritten as
ɛ
𝑚𝑎𝑥=
𝐹𝑙𝑡2𝐸𝐼 (3.6)
It is vital to state that the equation can only be used for calculations when the piezoresistive material is implemented in a layer whose thickness and length are negligible compared to the cantilever. Otherwise, the thick layer of the material itself becomes another source of stress which creates a need for a reformulation. The implementation of thin layer of the material also helps to simplify the fabrication process by requiring less material and time and simpler methods.
Moreover, when the material is implemented in a thick layer as in Figure 3.7 (C)/(D), sensitivity of the sensor decreases. The reason beyond is based on the existence of two opposite stress types: compressive and tensile. When the doped region passes the neutral axis of the cantilever as in Figure 3.7 (D), the total of tensile and compressive stress decreases. In an extreme case where the piezoresistor covers entire thickness of cantilever, the tensile stress and the compressive stress cancel each other.
Figure 3.6. Cantilever with the piezoresistor (A) Thin layer of piezoresistor (doped) (B)Thin layer of piezoresistor (deposited) (C) Thick layer of piezoresistor (doped) (D)Thick layer of piezoresistor (deposited)
3.4. OPTIMIZATION OF PIEZORESISTOR
3.4.1. Heating
Graphite ink is in pasty form. It needs to dry after being implemented. In order to accelerate this drying process, a hot plate is used. An experiment is prepared to find the optimum duration for which five different conductive lines are produced with different width and length.
The conductive lines are placed on the hot plate. The degree is chosen as 60 ֯C since it is the degree of maximized heat which does not damage the products (paper, graphite and silver ink). The aim of maximizing the degree is to shorten the fabrication period. The values of resistances are measured every five minutes and the results are shown in Figure 3.8. The graph shows that after twenty minutes, the change in the values of resistances is minimal. On the other hand, waiting more than twenty-five minutes can cause damages. Therefore, the duration of heating is chosen as twenty minutes.
Figure 3.7. Heating Test of Graphite (A)Implemented graphite resistors on the cantilever for heating test. Dimensions of conductive lines are given with width and length respectively. (1)4mm*10mm, (2)2mm*10mm, (3)1mm*10mm,
(4)2mm*20mm, (5)2mm*30mm. (B) Resistance-time graph of piezoresistors
3.4.2. Theoretical Work for Piezoresistance
The piezoresistor can be calculated by Equation 3.7 and the piezoresistor formula is given in Equation 3.7 where ρ(ε), APR, LPR, wPR and tPR are the piezoresistive layer’s resistivity,
cross-section area, length, width and thickness, respectively. One should note that the magnitude of ρ(ε) is changing with the stress that occurs on the fixed end of the cantilever.
𝑅𝑃𝑅(ε) = 𝜌(𝜀)𝐿𝑃𝑅
𝐴𝑃𝑅
= 𝜌(𝜀) 𝐿𝑃𝑅
𝑤𝑃𝑅𝑡𝑃𝑅
(3.7)
In section 3.3, distribution of stress on the cantilever has been discussed. Stress under the pure bending increases towards the fixed end. Increased stress results in large resistance change on the piezoresistive material. Hence, the starting point of cantilever is the best location to implement the graphite.
In a piezoresistive layer, there are two types of stresses namely, tensile and compressive stress. These are reverse stresses that can be easily cancel each other. Thus, applying the piezoresistive material on the middle axis of the cantilever is undesirable. Moreover, one should assume that the thickness is negligibly thin compared to the thickness of the cantilever. Furthermore, the thickness is inversely related to the sensitivity of read-out circuitry. Resistance should be as small as possible to increase the sensitivity of Wheatstone bridge circuit, hence, piezoresistive layer should be thickened as much as the cantilever thickness tolerates. In line with these objectives, the thickness of graphite is planned to be 40 µm where the chosen paper thickness is 400 µm.
Additionally, the choice of dimensions of the piezoresistive layer is not only effected by the resistance change, but also by cantilever dimensions and property of read-out circuitry. All parameters and constraints are important for sensitivity and each of them is depended on the others. Therefore, the equation can be rewritten as below.
𝑉𝑜𝑢𝑡(0) = ( 𝑅2 𝑅2+𝑅𝑃𝑅(0)−
𝑅4
𝑅4+𝑅3) 𝑉𝑖𝑛 (3.8)
The RPR(0) value in Equation 3.8 is an initial value of piezoresistor whose resistance is
calculated by the Equation 3.7.
Assuming the following terms; 𝑅4
𝑅4+𝑅3≈ 0 and 𝑅2 = 𝑅𝑃𝑅(0), Vout (0) in Equation 3.8 becomes equal to Vin/2 where the Vin is the input voltage.
If bending occurs, Vout changes and the Equation 3.8 transform as follows. 𝑉𝑜𝑢𝑡(𝜀) = ( 𝑅2 𝑅2+𝑅𝑃𝑅(ε)− 𝑅4 𝑅4+𝑅3) 𝑉𝑖𝑛 (3.9)
As we make the same assumption as in Equation 3.9, Vout becomes:
𝑉𝑜𝑢𝑡(𝜀) = 𝑉𝑖𝑛(
𝑅𝑃𝑅(0)
𝑅𝑃𝑅(0)+𝑅𝑃𝑅(ε)) (3.10)
The difference between Vout (0) and Vout (ε) (ΔVout) is given in Equation 3.11.
∆𝑉𝑜𝑢𝑡 =𝑉𝑖𝑛
2 − 𝑉𝑖𝑛
𝑅𝑃𝑅(0)
𝑅𝑃𝑅(0)+𝑅𝑃𝑅(ε) (3.11)
The magnitude of RPR (ε) is equal to
𝑅𝑃𝑅
(
ε)
= 𝑅𝑃𝑅(
0)
+ ∆𝑅𝑃𝑅 (3.12)where
∆𝑅𝑃𝑅 = 𝜀𝐺𝑅𝑃𝑅
(
0)
(3.13)The Equation 3.13 can be transformed to
∆𝑅𝑃𝑅
=
𝐹𝐺𝑅𝑃𝑅(0)𝐿𝑐𝑡𝑐2𝐸𝐼 =
𝐹𝐺𝑅𝑃𝑅(0)𝐿𝑐𝑡𝑐4𝑤𝑐
24𝐸 (3.14)
and the moment of inertia (I) is assumed as 12/(wctc3). In Equation 3.14, F represents the
applied force, G is gauge factor, E is the Young’s modulus. Additionally, Lc, wc and tc
represent the dimensions of the cantilever.
𝑡𝑐 = 0.4mm; 𝐿𝑃𝑅= 𝐿𝑐
5 ; 𝑤𝑃𝑅 = 𝑤𝑐
By using Eq. 3.12 and assumptions which are given in Equation 3.15, Equation 3.11 can be transformed to ∆𝑉𝑜𝑢𝑡 = 𝑉𝑖𝑛 2 − 𝑉𝑖𝑛 𝐸𝜉 2𝐸𝐶+𝐹𝐺𝐿𝑃𝑅𝑤𝑃𝑅 (3.16)
where the ξ is a constant and equal to 7.1 x 10⁻¹⁷.
By using Equation 3.16, the theoretical results are calculated and given in Figure 3.8. The graph points out that the increase value of piezoresistive layer’s width (wPR) decrease the
resistance changes and also sensitivity.
Figure 3.8. Theoretical Expression Graph of Width and Voltage Change
The Equation 3.16 is transformed as follow to be able to monitor the relation between the length and the width.
𝑤𝑃𝑅 = 1 𝐹𝐺𝐿(
2𝑉𝑖𝑛𝐸𝜉
𝑉𝑖𝑛−2∆𝑉𝑜𝑢𝑡
− 2𝐸𝜉
) (3.17)The Equation 3.17 indicates that length and the width is inversely proportional to each other. In Figure 3.9, the plot of Equation 3.17 is given, where the length and width is variable and the other parameters are constant. Input voltage and the change in output voltage is selected as their maximum values based on the circuit design. Their values are 12V and 1V,
respectively. The Young’s modulus is chosen as 2,58 GPa which is the elastic modulus of the Bristol paper that is thought to be used. The range of Gauss factor is 5-15 for graphite ink, and 10 is chosen to be used in the graph. F is determined as 0.1 mN.
Figure 3.9. Mathematical Expression Graph of Length and Width
Furthermore, the graphite ink is electrically connected to the Wheatstone bridge circuit as mentioned previously. Therefore, the design should be like one of the shapes in Figure 3.10 to simplify the connection between the circuit and the piezoresistive layer. One should be noted that the aim is to minimize the length of the piezoresistor without increasing the width since it should be as small as possible for high-sensitivity values. Additionally, compared to the length of the cantilever, the length of piezoresistive layer should be negligible. Hereby, the designs in Figure 3.10 are preferred where the dimensions are chosen only to observe the characteristic of the shapes.
3.4.3. Experimental Analysis of Piezoresistive Material
Optimization of dimensions of piezoresistive layer is necessary to increase the sensitivity of the sensor. Based on aforementioned equations, calculations for optimization are completed and explained in the previous section. The experimental results, however, does not always match with the theoretical results. Therefore, an experiment is undertaken to verify the expected results for which twelve cantilever with a straight conductive line are produced.
Afterwards, the chosen five cantilevers are tested. The different level of change in their resistance values, which is due to their different width and length, are shown in the Figure 3.11. The graph shows that not only lengthening the piezoresistive but also narrowing its width increases the sensitivity of sensor.
Figure 3.11. Conductive lines are produced by using graphite ink (A) 2mm width, 18,16,14 and 12 mm length respectively. (B) 5mm width, 18,16,14 and 12 mm length respectively. (C) 6mm width, 18,16,14 and 12 mm length
respectively. (D) Conductive lines’ resistance change are tested under same force (5mN)
Unfortunately, it is not possible to use straight conductive lines in the weight sensor because each tip of the piezoresistive line must be connected to the Wheatstone bridge circuit. Thus, a structure with two legs is required as mentioned. Therefore, three different designs are tested which are shown in Figure 3.12 These designs are prepared with various dimensions, as it is seen as in Figure 3.10, to see the impact of the shape.
![Figure 1.1. Schematic of MEMS Devices [2]](https://thumb-eu.123doks.com/thumbv2/9libnet/4275548.68706/13.892.164.807.500.771/figure-schematic-of-mems-devices.webp)
![Figure 1.2. Thermal Couples [18]](https://thumb-eu.123doks.com/thumbv2/9libnet/4275548.68706/14.892.255.702.497.762/figure-thermal-couples.webp)