IDENTIFICATION OF ‘PULL’ & ‘PUSH’ FACTORS FOR THE
PORTFOLIO FLOWS: SVAR EVIDENCE FROM THE
TURKISH ECONOMY
PORTFÖY AKIMLARI İÇİN “ÇEKEN” & “İTEN” ETKENLERİN TANIMLANMASI: TÜRKİYE EKONOMİSİNDEN SVAR BULGULARI
Levent KORAP
İstanbul University, Institute of Social Sciences [email protected]
ABSTRACT: In this paper, the determinants of the portfolio based capital flows are examined for the Turkish economy. Following the structural vector autoregression methodology, the estimation results reveal that the ‘push’ factors based on the external developments for the Turkish economy have a dominant role in explaining the behavior of the portfolio flows. Further, the domestic real interest rate as one of the main ‘pull’ factors has been found in a negative dynamic relationship with the portfolio flows. This result is attributed to that the dynamic course of the portfolio flows should not be related to the excess return possibilities of the real interest structure of the Turkish economy.
Key words
:
Portfolio Flows; SVAR Analysis; Turkish Economy JEL Classification: C32; F32; G11ÖZET: Bu çalışmada portföy temelli sermaye akımlarının belirleyicileri Türkiye
ekonomisi için incelenmiştir. Yapısal vektör otoregresyon yöntemi izlenerek elde edilen sonuçlar Türkiye ekonomisi için dışsal gelişmelere dayalı ‘iten’ etkenlerin portföy akımlarının davranışı açıklamakta belirleyici bir işleve sahip olduğunu ortaya koymaktadır. Ayrıca, başlıca ‘çeken’ etkenlerden biri olarak yurt içi reel faiz oranı portföy akımları ile negatif bir dinamik ilişki içerisinde bulunmuştur. Bu sonuç portföy akımlarınının dinamik gelişme yolunun Türkiye ekonomisinin reel faiz yapısının aşırı getiri olanaklarıyla ilişkilendirilmemesi gerekliliğine atfedilmiştir.
Anahtar kelimeler: Portföy Akımları; SVAR Çözümlemesi; Türkiye Ekonomisi JEL Sınıflaması: C32; F32; G11
1. Introduction
The course of the capital flows affecting emerging market economies draws a considerable attention of both researchers and policy makers to search for various consequences occurred on the aggregate economic activity level. Given the limited amount of real and financial resources subject to the developing countries, the aims of policy authorities to obtain high growth rates are likely to lead the developing countries to be highly sensitive to the effects of these flows. The tendency of emerging markets to remove restrictions on the capital accounts and increasing deregulation of these economies have brought out the required conditions for global investors to invest into these economies, so that they are able to appreciate high return possibilities all around the world in an unfettered way. In this process, both financial developments that lead to the possibility of risk
dispersion and the pace of advances in communication technologies enable investors to distribute their flows of funds among the various regions of the world economy.
We can observe that a large volatility in capital flows seems to be a stylized fact of the world economy. The World Economic Outlook published by the International Monetary Fund (IMF) (2006) reports that the total net private capital flows comprising net direct investment, net portfolio investment, and other long-and short-term net investment flows in emerging markets were about $200 billion for the 1995-1997 period. In this period, the net private direct investment indicated a stable long-run path of on average $150 billion per year, but the post-1997 periods of the East Asian financial crisis witnessed that initially a decreasing private portfolio inflows and other capital flows and then an increasing private portfolio and other capital outflows for the 2001-2003 period dominated the emerging markets. But there exists an increase again in the flows of the private direct investment and the portfolio investment for the 2004-2006 period yielding about $821 billion in total private inflows. Also the recent World Economic Outlook of IMF (2008) reports a much larger increase in net private capital flows to the emerging markets and developing economies for the years 2007 and 2008 in the sense that the net private capital flows amount to $633 billion and $529 billion in 2007 and 2008, respectively. What is of more importance here is that the private portfolio flows constitute the most volatile sub-component of the total capital flows among the developed and developing countries. Indeed, although the net private direct investment and to some extent the net total private capital flows indicate a stable pattern to increase for the post-2000 period, no such characteristics can be observed for the net private portfolio flows which indicate a highly volatile pattern within the period of last decade.
Such a surge of private capital flows to the developing countries yields no clear-cut inference as to their possible consequences on these economies. Even though there exist some evidence in favor of that capital flows have been associated with higher growth rates leading to both consumption and investment booms as well as to the trade deficits due to appreciating real exchange rate, they have also been associated with a higher incidence of crises subject to high volatility of capital flows (Mishra et al. 2001). In the contemporaneous economics literature, factors that determine the supply of flows to the recipient country are generally called ‘push’ factors which give importance to the effects of external developments on portfolio flows. On the other side, the ‘pull’ factors mainly represent demand for flows by recipient country (Montiel and Reinhart, 2000). Calvo et al. (1993), Fernandez-Arias (1994), Kim (2000) and Ying and Kim (2001) give support to the ‘push’ factors for both developed and developing countries, while Dasgupta and Ratha (2000), Hernández et al. (2001) and Çulha (2006) find the dominance of ‘pull’ factors over ‘push’ factors in determining capital flows. Chuhan et al. (1993) and Taylor and Sarno (1997) estimate that both domestic and global factors explain bond and equity flows to the developing countries. A recent paper by Baek (2006) also examines the portfolio flows for emerging Asia and Latin America economies and estimates that portfolio investments in emerging Asia are dominantly pushed by external factors, while both ‘pull’ and ‘push’ factors are responsible for the portfolio investments in the Latin America countries.
Based on the distinction given above, in this paper, the dynamic course of the portfolio flows has been tried to be re-examined for the Turkish economy by employing structural vector autoregression (SVAR) methodology of the contemporaneous econometrics.1 The organization of the paper is as follows. The next section introduces data. Methodological issues for estimation purposes are briefly discussed in section 3. Section 4 focuses on identification issues and conducts an empirical model for the Turkish economy. The last section summarizes results and concludes. The appendix follows.
2. Data
Portfolio capital flows (CAPt) experienced by the Turkish economy are conditioned onto a set of ‘pull’ and ‘push’ based factors. The portfolio flows data consist of the sum of portfolio investments net of assets and liabilities as equity securities and debt securities in millions of US$s. In any given period t, for the ‘pull’ factors, the domestic real interest rate (Rdt), current account balance (CURdt), domestic stock return (EQdt) and expected domestic inflation (EXPdt) variables are used. For the ‘push’ factors, the data belong to the US economy and real interest rate (Rft), the growth rate of industrial production index (INDft) and return on share prices (EQft) are considered. The domestic and foreign real interest rate variables represent the difference between nominal interest rate, which is the immediate interest rate (interbank rate) per cent per annum, and the annualized monthly domestic inflation rate based on consumer price index using the base 2005: 100. The current account balance data in millions of US$s are extracted from the balance of payments statistics. The domestic and foreign stock return data are represented by the monthly logarithmic difference of the share prices using the base 2005: 100. For the expected domestic inflation, the annualized monthly inflation series using consumer price index with the base 2005: 100 are calculated, assuming an adaptive expectations hypothesis. We use the 2005: 100 based industrial production data for the US economy. The portfolio flows and current account balance data have been taken from the electronic data delivery system of the Central Bank of the Republic of Turkey (http://evds.tcmb.gov.tr), while all the other data are compiled from the electronic statistics portal of the Organization for Economic Co-operation and Development (http://stats.oecd.org). The data cover the period from 1992m01 to 2009m06 with 209 monthly frequency observations. Note that no exogenous impulse dummy variable has been used in the empirical analysis.2
3. Methodology
To assess the possible effects of ‘pull’ and ‘push’ factors on the portfolio flows experienced by the Turkish economy, we now tend to apply to the structural identification methodology of vector autoregressive models (SVARs) proposed by the so-called AB-model of Amisano and Giannini (1997). The advantage of the
1 For some other empirical papers examining the effects of capital flows upon the Turkish economy, see Agénor et al. (1997), Celasun et al. (1999), Kirmonoğlu and Özçiçek (1999), Akçoraoğlu (2000), Alper and Sağlam (2001), Biçer and Yeldan (2002), Berument and Dinçer (2004) and the Central Bank of the Republic of Turkey (2006).
2 As a difference from this paper, Çulha (2006) also assumes the budget deficits as a ‘pull’ factor but does not consider domestic inflation as a ‘pull’ and the US share prices as a ‘push’ factor. We can make here an implicit assumption that any fiscal pressure on public sector borrowing requirement (PSBR), which has a larger content than the general budgetary position of the govenment, will have essentially been reflected to the domestic interest structure led by the PSBR inside the period under investigation.
SVAR methodology against the unrestricted vector autoregressive models is to make researchers capable of using theoretical assumptions in their empirical models by imposing explicit restrictions for the structural relationships. Such a case can be implemented by introducing theoretical as well as atheoretical or auxiliary restrictions to achieve econometric identification issues. For this purpose, assume that = E[etet´] is the residual covariance matrix. Then, the reduced form model used for the structural analysis can be defined as follows:
Aet = But (1)
where et is the reduced form disturbance vector, while ut represents the unobserved structural innovation vector, both with a length k. Thus, Eq. 1 relates the reduced form disturbances to the underlying structural shocks. The SVAR analysis requires some restrictions for A and B matrices with a dimension kxk to be added. Note that the structural innovations have a covariance matrix E[utut´]=I where I represents the identity matrix so that ut imposes the following restrictions on A and B:
AA´=BB´ (2)
We must specify that for the identification of the AB model at least k2+k(k-1)/2 = k(3k-1)/2 restrictions are needed. If the model is over-identified, which is also the
case in the empirical application below, the value of a likelihood ratio (LR) statistic will be reported.
We must consider that the variables used in a vector autoregressive process to implement innovative accounting methods such as impulse responses do not need to be stationary. Sims (1980) yielding a pioneering paper on the VAR methodology argues against differencing even if the time series used follows a unit root process. Furthermore, Sims et al. (1990) show that parameters that can be written as coefficients on mean zero, nonintegrated regressors have jointly normal asymptotic distributions and suggest that the common practice of attempting to transform models to stationary form by difference operators whenever it appears likely that the data are of integrated form is unnecessary. Otherwise, some necessary knowledge contained in the data would possibly be thrown out by the researcher.
4. Estimation Results
In this section, an unrestricted vector autoregression (UVAR) model is initially constructed upon endogenous variables. For the lag length of UVAR model, the widely-used Schwarz information criterion, which suggests the use of lag length 1, is considered. Note that such a lag selection is also supported by the Hannan-Quinn criterion, but the Akaike information criterion suggests the use of lag length 3. However, in this case, the results are not sensitive to the lag specification. Thus VAR(1) model is estimated.3
As explained above, certain assumptions are required for identification of the system since the structural shocks cannot be observed directly without identifying
restrictions. For this purpose, we apply the structural restrictions to identify ‘pull’ and ‘push’ based factors. At this point, we try to use the same restrictions as Çulha (2006) as far as possible. In this sense, the US interest rates have been assumed responsive only to own shocks leading it to be the most exogenous variable in the system. The growth rate of the US industrial production index is responsive to the US interest rates, while the return on the US share price index is assumed to be affected by the shocks upon the US interest rate and growth rate of the US industrial production index. The domestic real interest rate is responsive to the US Treasury interest rate shocks. The current account is assumed to be affected by the shocks upon domestic real interest rate, domestic stock return, the US Treasury interest rate and growth rate of US industrial production index. The domestic stock return responds to shocks upon domestic real interest rate, the US Treasury interest rate, growth rate of US industrial production index and return on US share price index. Finally, domestic inflation responds to the domestic real interest shocks. Portfolio flows are assumed to be affected by all the shocks, leading it to be the most endogenous variable in the system. Further, all variables are assumed to be responsive to the their own shocks. More explicitly, the AB model used in this paper can be specified as follows:
=A t t t dt t dt t dt t dt t ft t ft ft
e CAP
e R
e CUR
e EQ
e EXP
e R
e IND
eEQ
=BAs can be seen in Appendix 1 in a more detailed way, the SVAR system is over-identified with 8 degrees of freedom. The LR test statistic estimated for the system identification restrictions under the null hypothesis is 2(8)=11.2025 with a probability value of 0.1905. Note that the structural parameters are estimated by
12 13 14 15 16 17 18 26 32 34 36 37 42
1
0 1 0 0 0
0 0
0
1
0
0
0
0 1 0
a
a
a
a
a
a
a
a
a
a
a
a
a
46 47 48 52 760
0 0 1 0 0 0
0 0 0 0 0 1 0 0
0 0 0 0 0
1 0
0 0
a
a
a
a
a
86 870 0 0
a
a
1
t t t dt t dt t dt t dt t ft t ft t ftu CAP
u R
u CUR
u EQ
u EXP
u R
u IND
u EQ
11 22 33 440 0 0 0 0 0 0
0
0 0 0 0 0 0
0 0
0 0 0 0 0
0 0 0
0
b
b
b
b
55 66 770 0 0
0 0 0 0
0 0 0
0 0 0 0 0
0 0
0 0 0 0 0 0
0
0 0 0
b
b
b
880 0 0 0 b
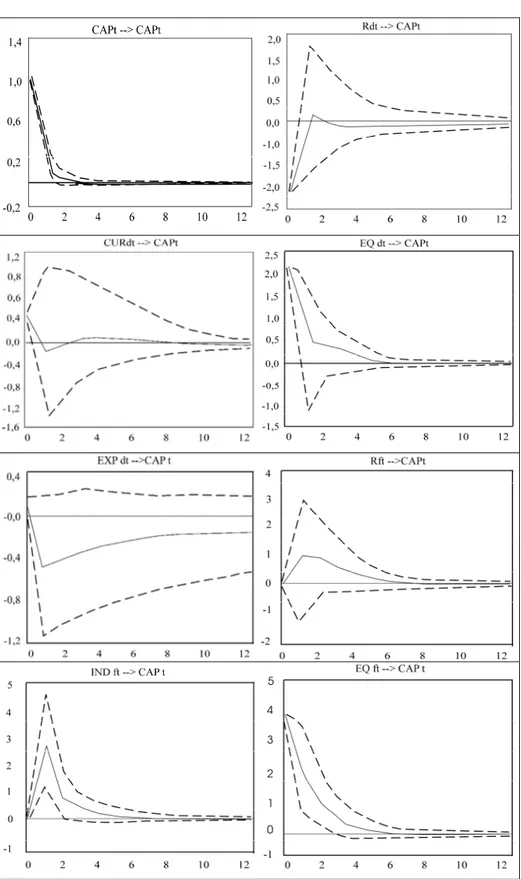
means of maximum likelihood esimator. In line with such specification issues, the SVAR impulse-response functions of the portfolio flows using 95% confidence intervals with 1000 bootstrapped replications over a 12 months period suggested by the percentile method of Hall (1992) are given in Fig. 1.
At first, notice that the confidence intervals estimated for some of the variables are quiet large, and such a case indicates that it is necessary to consider some margins of uncertainty while discussing the findings obtained in the paper. This is especially valid for the ‘pull’ factors resulted from the developments in the Turkish economy for the period investigated. As can be expected, the portfolio flows data respond to its own shocks positively for the first period following the shock. We can easily observe that the main ‘pull’ based factors affecting the portfolio flows are the domestic real interest rate in a negative way and the return on domestic share prices in a positive way. A structural positive innovation on the domestic real interest rates leads to a nearly immediate $208 million portfolio outflow, while the effect of the return on share prices, inversely, has a positive impact on the portfolio flows experienced by the Turkish economy. The immediate response of the portfolio flows to a structurally identified dynamic innovation on the share prices return is a $214 million portfolio inflow and this effect carries out in a decreasing way for the first ($52 million inflow) and second ($39 million inflow) periods following the initial shock. We also find that there seems to exist a negative dynamic interaction between expected inflation and portfolio flows. Indeed, a structurally identified positive innovation on inflation leads to a nearly $52 million portfolio outflow after one period following the shock and this negative impact of continue such that results indicate $19 million outflow after a 12 months horizon. Thus, due to the symmetric nature of impulse responses we can infer here that in the eyes of the foreign investors, the lower the domestic inflation the higher the investment opportunity possibilities for the Turkish financial assets. However being estimated with a trivial effect, finally, the dynamic course of the portfolio flows might have immediately been affected by the developments on the current account balance in a positive way.
On the other side, when we consider the dynamic relationships between the ‘push’ factors and the portfolio based capital flows, we find that both the US real interest rate and the US industrial production growth and the return on the US share prices have significant positive immediate effects on the portfolio flows. A structurally identified positive shock on the US real interest rates would be resulted in a $81 million, $77 million and $48 million portfolio inflow for the first, second and third periods following the shock. Similarly positive shocks on the US industrial output increases the portfolio flows to the Turkish economy nearly by $282 million, $74 million and $34 million for these periods. Of all the variables, the effect of the structural shock on the US share price return is the largest one and a positive structural innovation has an immediate positive $417 million impact on the portfolio flows, while this adds up to $836 million after 5 periods. These results reveal that the ‘push’ factors have a much larger impact on the portfolio flows in aggregate than the ‘pull’ factors and that the persistence of ‘push’ factors has a leading role on the portfolio flows experienced by the Turkish economy. Following the structural factorization of impulse responses, the SVAR foreceast error variance decomposition results are presented in Table 1:
Table 1. SVAR Forecast Error Variance Decomposition
Proportions of forecast error in CAPt accounted for by
Variance Period CAPt Rdt CURdt EQdt EXPdt Rft INDft EQft
1 0.80 0.03 0.00 0.03 0.00 0.00 0.00 0.13 4 0.71 0.03 0.00 0.03 0.00 0.01 0.06 0.15 8 0.71 0.03 0.00 0.03 0.01 0.01 0.06 0.15 12 0.71 0.03 0.00 0.03 0.01 0.01 0.06 0.15
Variance decomposition analysis indicates that over a period of 12 months, nearly 71% of the forecast error variance of the portfolio flows can be attributed to the own shocks. The results indicate that the variable that best explain the forecast error variance of the portfolio flows is the return on the US share prices. Shocks to the variable EQft explain nearly 15% of the variation in the portfolio flows. Then, the growth rate of the US industrial output is responsible for 6% of the variation in portfolio flows. When the overall effect of the ‘pull’ and ‘push’ factors have been considered, we estimate that the ‘push’ factors jointly account for 22% of the variation in portfolio flows, however, the ‘pull’ factors are able to explain only 7% of the forecast error variance of the portfolio flows.
All these estimation results reveal that over the dynamic course of the portfolio flows experienced by the Turkish economy, the dominant role belongs to the ‘push’ factors. Based on the dynamic impulse response analysis, the course of the portfolio flows should not be attributed to the excess return possibilities of the real interest structure, as was frequently emphasized by the commentators of the Turkish economy, led mainly by high PSBR for the period examined. Rather, the dynamic behavior of the capital flows should be related to the risk considerations of the economic agents resulted from the negative fundamentals of the economy associated with high risk premiums. In line with such a consideration, our estimation results indicate that positive shocks on domestic real interest rates lead to portfolio outflows. All in all, the dominance of the ‘push’ factors over the portfolio flows and the negative dynamic relationship between portfolio flows and domestic real interest structure would decrease the effectiveness of discretionary stabilization policies constructed on the domestic macroeconomic aggregates.
5. Concluding Remarks
In this paper, a structural vector autoregression (SVAR) model is constructed to identify the effects of ‘push’ and ‘pull’ based factors on the dynamic course of the portfolio based capital flows experienced by the Turkish economy. Considering the time period of 1992m01-2009m06, a large set of domestic and foreign based variables are used to represent these factors. Estimation results reveal that the ‘push’ factors based on the external developments for the Turkish economy have a dominant role in explaining the behavior of portfolio flows. Further, the domestic real interest rate as one of the main ‘pull’ factors is found in a negative dynamic relationship with portfolio flows. This result is attributed to that the dynamic course of the portfolio flows should not be related to the excess return possibilities of the real interest structure of the Turkish economy. Rather, the dynamic behavior of the capital flows should be related to the risk considerations of the economic agents resulted from the negative fundamentals of the economy associated with high risk premiums. Of course, future papers will bring out the sensitivity of these findings to the structural changes in the Turkish economy for the post-2001 economic crisis period. In this sense, Çulha
(2006) somewhat touches on the changing relative roles of the ‘push’ and ‘pull’ factors for the post-2001 economic crisis period.
Acknowledgement
The author would like to thank Dündar M. Demiröz of the Istanbul University Department of Economics for invaluable criticisms upon an earlier version of this paper.
References
AGENOR, P.R., MCDERMOTT, C.J., ÜÇER, E.M. (1997). Fiscal imbalances, capital inflows, and the real exchange rate: the case of Turkey. IMF Working Paper, No. 987/1. AKÇORAOĞLU, A. (2000). International capital movements, external imbalances and
economic growth: the case of Turkey. Yapı Kredi Economic Review, vol. 11, no. 2, pp. 21-36.
ALPER, C.E., SAĞLAM, İ. (2001). The transmission of a sudden capital outflow: evidence from Turkey. Eastern European Economics, vol. 39, no. 2, pp. 29-48.
AMISANO, G., GIANNINI, C. (1997). Topics in structural VAR econometrics. 2nd edition,
Berlin: Springer-Verlag.
BAEK, I.M. (2006). Portfolio investment flows to Asia and Latin America: pull, push or market sentiment?. Journal of Asian Economics, vol. 17, pp. 363-73.
BERUMENT, H., DİNÇER, N. (2004). Do capital flows improve macroeconomic performance in emerging markets? the Turkish experience. Emerging Markets Finance and Trade, vol. 40, no. 4, pp. 20-32.
BİÇER, G. and YELDAN, A.E. (2002). Patterns of financial capital flows and accumulation in the post-1990 Turkish economy. Canadian Journal of Development Studies, vol. 24, no. 2, pp. 250-65.
CALVO, G.A., LEIDERMAN, L., REINHART, C.M. (1993). Capital flows and real exchange rate appreciation in Latin America: the role of external factors. IMF Staff Papers, vol. 40, no. 1, 108-51.
CENTRAL BANK OF THE REPUBLIC OF TURKEY (2006). Inflation report, no. 2006-IV. CELASUN, O., DENİZER, C., HE, D. (1999). Capital inflows, macroeconomic management,
and the financial system: the Turkish case, 1989-97. World Bank Working Paper, no. 2141. CHUHAN, P., CLAESSENS, S., MAMINGI, N. (1993). Equity and bond flows to Asia and
Latin America: the role of global and country factors. World Bank Policy Research Working Paper, no.WPS 1160, July.
ÇULHA, A. (2006). A structural VAR analysis of the determinants of capital flows into Turkey. CBRT Research and Monetary Policy Department Working Paper, no. 06/05. DASGUPTA, D., RATHA, D. (2000). What factors appear to drive private capital flows to
developing countries? and how does official lending respond?. World Bank Policy Research Working Paper, no. 2392.
FERNANDEZ-ARIAS, E. (1994). The new wave of private capital inflows: push or pull?. World Bank Policy Research Working Paper, no. 1312.
HALL, P. (1992). The bootsrap and edgeworth expansion. New York: Springer.
HERNANDEZ, L., MELLADOI, P., VALDES, R. (2001). Determinants of private capital flows in the 1970s and 1990s: is there evidence of contagion?. IMF Working Paper, no. 01/64. INTERNATIONAL MONETARY FUND (2006). World economic outlook. September. INTERNATIONAL MONETARY FUND (2008). World economic outlook. October.
KIM, Y. (2000). Causes of capital flows in developing countries. Journal of International Money and Finance, vol. 19, pp. 235-53.
KIRMANOĞLU, H., ÖZÇİÇEK, Ö. (1999). The effect of short-term capital inflow on the Turkish economy. Yapı Kredi Economic Review, vol. 10, no. 1, pp. 27-34.
MISHRA, D., MODY, A., MURSHID, A.P. (2001). Private capital flows and growth. IMF Finance and Development, vol. 38, no. 2.
MONTIEL, P., REINHART, C.M. (2000). The dynamics of capital movements to emerging economies during the 1990s. In: S. GRIFFITH-JONES and M. MONTES (eds.),
Short-term Capital Movement and Balance of Payments Crises, Oxford: Oxford University Press, pp. 3-28.
SIMS, C.A. (1980). Macroeconomics and reality. Econometrica, vol. 48, no. 1, Jan., pp.1-48. SIMS, C.A., STOCK, A., WATSON, M.W. (1990). Inference in linear times series models
with some unit roots. Econometrica, vol. 58, no. 1, pp. 113-44.
TAYLOR, M.P., SARNO, L. (1997). Capital flows to developing countries: long- and short-term deshort-terminants. World Bank Economic Review, vol. 11, no. 3, pp. 451-70.
YING, Y.-H., KIM, Y. (2001). An empirical analysis on capital flows: the case of Korea and Mexico. Southern Economic Journal, vol. 67, no. 4, pp. 954- 68.
Appendix
Structural VAR Estimation Results ML Estimation
Log Likelihood: 60.8864
Structural VAR is over-dentified with 8 degrees of freedom LR Test: 2(8)=11.2025 (prob. 0.1905) Estimated A matrix 1.00 452.12 -0.06 -1655.92 -141.75 1093.69 -9709.38 -9752.36 0.00 1.00 0.00 0.00 0.00 0.10 0.00 0.00 0.00 -71.49 1.00 431.99 0.00 30.23 12670.35 0.00 0.00 0.08 0.00 1.00 0.00 -0.02 2.00 -1.26 0.00 0.01 0.00 0.00 1.00 0.00 0.00 0.00 0.00 0.00 0.00 0.00 0.00 1.00 0.00 0.00 0.00 0.00 0.00 0.00 0.00 -0.02 1.00 0.00 0.00 0.00 0.00 0.00 0.00 -0.14 0.61 1.00
Estimated standard errors for A matrix
0.00 204.99 0.11 551.58 885.67 3247.49 11769.49 2162.47 0.00 0.00 0.00 0.00 0.00 1.11 0.00 0.00 0.00 132.79 0.00 339.30 0.00 2104.07 7581.73 0.00 0.00 0.03 0.00 0.00 0.00 0.41 1.46 0.26 0.00 0.02 0.00 0.00 0.00 0.00 0.00 0.00 0.00 0.00 0.00 0.00 0.00 0.00 0.00 0.00 0.00 0.00 0.00 0.00 0.00 0.02 0.00 0.00 0.00 0.00 0.00 0.00 0.00 0.11 0.39 0.00 Estimated B matrix 1046.3 0.00 0.00 0.00 0.00 0.00 0.00 0.00 0.00 0.36 0.00 0.00 0.00 0.00 0.00 0.00 0.00 0.00 680.23 0.00 0.00 0.00 0.00 0.00 0.00 0.00 0.00 0.13 0.00 0.00 0.00 0.00 0.00 0.00 0.00 0.00 0.08 0.00 0.00 0.00 0.00 0.00 0.00 0.00 0.00 0.02 0.00 0.00 0.00 0.00 0.00 0.00 0.00 0.00 0.01 0.00 0.00 0.00 0.00 0.00 0.00 0.00 0.00 0.04
Estimated standard errors for B matrix
51.18 0.00 0.00 0.00 0.00 0.00 0.00 0.00 0.00 0.02 0.00 0.00 0.00 0.00 0.00 0.00 0.00 0.00 33.27 0.00 0.00 0.00 0.00 0.00 0.00 0.00 0.00 0.01 0.00 0.00 0.00 0.00 0.00 0.00 0.00 0.00 0.01 0.00 0.00 0.00 0.00 0.00 0.00 0.00 0.00 0.01 0.00 0.00 0.00 0.00 0.00 0.00 0.00 0.00 0.01 0.00 0.00 0.00 0.00 0.00 0.00 0.00 0.00 0.01