An Exploratory Study
On the Dynamics of Localization of Renewable Energy Industry
Among the Managers of a Leading Company
ANIL ŞERİFSOY
B.S. Electrical and Electronics Engineering, Koc University, 2011 M.A. International Business Management, Middlesex University 2013
Submitted to the Graduate School of Social Sciences in partial fulfillment of the requirements for the degree of Doctor of Philosophy in Contemporary Management Studies
IŞIK UNIVERSITY 2019
ii
iii
AN EXPLORATORY STUDY ON THE DYNAMICS OF LOCALIZATION OF RENEWABLE ENERGY INDUSTRY AMONG THE MANAGERS OF A
LEADING COMPANY
ABSTRACT
Utilizing localization as a strategy has increased especially in the energy sector due to the ever-growing need for being sufficient for survivability and sustainability. Governments have started to take energy needs into consideration when planning for the future, and finding local sources of energy as well as managing them became a priority in this context. Therefore to provide the required level of energy, not only MNEs but also governments have been working on the localization process for their energy needs. Following this framework, renewable energy production is a new trend to provide a clean and sustainable energy, appealing to both the governments and entrepreneurs with a shorter pay-back time and longer lifetime of the investments, grabbing the attention of private and governmental sectors alike.
This dissertation aims to be an exploratory study that shows the dynamics of the localization strategy on the renewable energy sector. There are two different phases for the conducting of the research. The first phase is collecting all the necessary information about the energy market of Turkey and the governmental position on the renewable energy with relevant policies. Primary and secondary data will be used in this stage to set the correct data .
In the second stage, a multinational company will be evaluated in order to ascertain how willing it is to comply with localization strategy in a new and developing market. A leading company’s managers who are directly involved and in point of fact, one of the determinants to achieve the success for the adaptation of the localization in the renewable energy market in Turkey, will be interviewed to accomplish this objective. In-depth interviews is the chosen method to get the critical opinions and the perspective of the small
iv
number of respondents who play a critical role for the determination of the strategy of the aforementioned MNE. Using their first hand experiences in the energy sector will also prove to be more effective as a primary source material to be collected for the qualitative analysis part of this study. A comprehensive review of the existing literature will take part as the secondary data collective in the qualitative analysis.
v
YENİLENEBİLİR ENERJİ SEKTÖRÜNDEKİ LOKALİZASYON TEMELLİ DİNAMİKLER ÜZERİNE LİDER BİR KURULUŞ YÖNETİCİLERİ ARASINDA
KEŞFEDİCİ BİR ARAŞTIRMA
ÖZET
Sürdürülebilirliğin sağlanabilmesi için giderek artan talep, özellikle de enerji sektöründe lokalizasyonun bir strateji olarak kullanımının artmasına sebep olmuştur. Devletler gelecek planlamalarını yaparken enerji ile ilgili ihtiyaçları göz önünde tutmaya başlamış, bu bağlamda da yerel enerji kaynaklarının bulunması ve yönetilmesi önem kazanmıştır. Bu sebepten ötürü, gereken enerji taleplerini karşılayabilmek adına hem devletler, hem de çok uluslu şirketler lokalizasyon süreçleri üzerinde çalışmaktadır. Bu çerçevede kısa süreli geri ödeme zamanı ve uzun vadeli yatırım olanaklarıyla öne çıkan temiz ve sürdürülebilir enerji sağlama trendi, hem hükümetlerin hem de yatırımcıların ilgisini çekmektedir.
Bu tez yenilenebilir enerji sektöründeki lokalizasyon stratejisinin dinamiklerini ortaya koyan, araştırıcı bir tez olma amacı taşımaktadır. Araştırmanın yürütülmesinde iki ayrı faz söz konusudur. İlk safha Türkiye’nin enerji marketi ve devletin yenilenebilir enerji üzerine ilgili politikaları ve duruşu hakkında bilgi toplama kısmını oluşturmaktadır. Bu aşamada, doğru veri grubunu oluşturabilmek adına birincil ve ikincil veri türleri kullanılacaktır.
Tezin ikinci safhasında, yeni ve gelişmekte olan bir markette lokalizasyon stratejisini uygulamak konusunda ne kadar istekli olduğunu anlayabilmek amacıyla, çok uluslu bir şirket incelenecektir. Bu sektöründeki lider firmanın Türkiye’deki yenilenebilir enerji sektöründe lokalizasyon stratejisinin uygulanması konusunda direkt olarak ilgili ve hatta stratejinin başarıya ulaşması üzerine karar verici olma niteliği taşıyan müdürleri ile görüşme yapılacaktır. Derinlemesine mülakat yöntemi, yukarıda bahsedilen çok uluslu firmanın stratejisinde belirleyici rol oynayan bu kişilerin eleştirel görüşlerini ve bakış
vi
açılarını değerlendirebilmek adına seçilmiştir. Bu kişilerin enerji sektöründeki bireysel deneyimlerinin bir araya getirilmesi, aynı zamanda bu çalışmanın nitel analiz kısmında temel kaynak materyali olma özelliğini taşıyacağı için ayrıca önem arz etmektedir. Hâlihazırda var olan kaynakların kapsamlı şekilde incelenmesi, nitel analiz için ikincil veri olarak kullanılacaktır.
vii
ACKNOWLEDGEMENT
First of all, thank you to my supervisor Prof. Dr. Murat Ferman. Your support has illuminated my path and given me direction. Your guidance has become irreplaceable in this journey.
The faculty in Işık University, in particular Prof. Dr. Suat Teker and Asst. Prof. Pınar Falcıoğlu, have helped me navigate the process of research and writing a thesis; thank you for your immense contributions.
Thank you for all our managers in ABB, who have given their valuable time for the in-depth interview part of this thesis. They shared their invaluable insights with me and contributed to my research for which I cannot thank enough. I would like to mention them here alphabetically: Eren Aydın, Tamer Kuzgunkaya, Robert Reinius, Raimo Sakki, Sami Sevinç, Taner Tezcan, Toni Tiihonen.
Thank you also to Ali Bülent Kapçı, from Department of Renewable Energy Resources, who like our ABB executives have given me his valuable time and insights for the in-depth interviews.
Thank you to my colleagues in ABB, Hasret Aslı Şeker and Evrim Koltuksuz, who have taken up the slack when I was too tired to proofread my own writing anymore. This experience wouldn’t be same without you!
To my brother Ahmet Cem Şerifsoy: your brilliant ideas have given me inspiration, and thank you for your wisdom when I needed it most.
I also would like to thank my parents, who have given me all kinds of support during this difficult process. My mother Ayfer Şerifsoy, who has been telling me to “C’mon Anıl!” since I was in elementary school and my father Vasıf Şerifsoy, who has been honoring me by calling me his pride and joy -I couldn’t do it without you! Thank you for being there for me, as always.
viii
Thank you to my beloved, precious sons Ateş Şerifsoy and Sarp Şerifsoy, who have been my staunchest supporters in this endeavor just by existing. You have given me the inner strength to finish this thesis.
To Nilüfer Şerifsoy, my wonderful wife, thank you for taking care of our two little monsters so that I could write in peace, and for your endless patience with me. I love you from the bottom of my heart and I am looking forward to all else we’ll be creating together in this life.
ix TABLE OF CONTENTS ABSTRACT... IIII ACKNOWLEDGEMENT ... VIIII TABLEOFCONTENTS ... IX LISTOFTABLES ... XI
LISTOFFIGURES ... XIIII
CHAPTER 1INTRODUCTION ... 1
1.1. RESEARCHOBJECTIVES ... 6
1.2. RESEARCHQUESTIONS ... 7
1.3. RESEARCHMETHODANDANALYSIS ... 7
CHAPTER 2LITERATURE REVIEW ... 10
2.1.INFORMATIONONTURKEY ... 14 2.1.1. GEOPOLITICAL POSITION ... 14 2.1.2. FINANCIAL CONDITIONS ... 15 2.1.3. DEMOGRAPHIC CONDITIONS ... 20 2.1.4. INTERNATIONAL RELATIONS... 31 2.1.5. GOVERNMENTAL ATTITUDE ... 32 2.2. ENERGYSITUATION ... 36
2.2.1. TURKEY AND RENEWABLE ENERGY ... 82
2.2.2. APPLIED STRATEGIES AND THE ATTITUDE OF TURKEY ... 85
CHAPTER 3LOCALIZATION STRATEGY ...107
3.1. 4PS ... 108 3.1.1. PEOPLE ... 109 3.1.2. PRODUCT ... 110 3.1.3. PLACE ... 111 3.1.4. PROMOTION ... 111 3.2. BENEFITSOFLOCALIZATION ... 111
3.2.1. LOCALIZATION OF STRATEGIC DECISION MAKING ... 113
3.2.2. BUILDING AND EXPLOITING THE LOCAL KNOWLEDGE POOL ... 113
3.2.3. DEPLOYMENT OF LOCAL HUMAN RESOURCES ... 114
3.2.4. LOCALIZATION OF R&D ... 115
3.2.5. LOCALIZATION OF PRODUCTS ... 115
x
3.2.7. ADEPTATIONS IN MANUFACTURING PROCESS ... 116
3.2.8. LOCAL DEPLOYMENT OF SUBSIDIARY BENEFITS ... 117
3.2.9. LOCALIZATION OF CORPORATE IMAGE ... 117
3.3. DISADVANTAGESOFLOCALIZATION ... 118
3.4. LOCALIZATIONINRENEWABLEENERGY ... 119
3.5. LOCALIZATIONINRENEWABLEENERGYSECTORINTURKEY ... 123
CHAPTER 4METHODOLOGY AND RESEARCH ...126
4.1.DATACOLLECTIONSTRATEGY ... 131
4.2.PROCESSFORCONDUCTINGIN-DEPTHINTERVIEW ... 132
4.2.1. PLAN ... 132
4.2.2. DEVELOP INSTRUMENTS ... 136
4.2.3. IN-DEPTH INTERVIEW PROTOCOL ... 137
4.2.4. COLLECTING DATA ... 138
4.2.5. ANALYZING DATA ... 138
CHAPTER 5FINDINGS OF RESEARCH ...140
5.1.SCHOOLING/CAREERPATH ... 146
5.2.LEVELOFREPORTING ... 151
5.3.NATIONALITYOFTHEINTERVIEWEES ... 155
5.4.PLACEOFEMPLOYMENT... 159
5.5.RELATIVELEVELSOFTHEEXECUTIVES ... 161
5.6.MINDSETOFEXECUTIVES ... 163
5.7.FOCUSONTHERENEWABLEENERGY ... 164
CHAPTER 6CONCLUSION ...167
REFERENCES ...172
APPENDIX ...181
xi
LIST OF TABLES
Table 1 Academic Units 2016-2017 ... 26
Table 2 Number of Students ... 27
Table 3 International Comparisons of Hourly Compensation Costs in Manufacturing ... 30
Table 4 Condition of Turkey ... 35
Table 5 Electricity Production and Demand of Turkey ... 86
Table 6 Res Potential, Installed power and Target: Turkey ... 86
Table 7 Source Based Installed Power ... 87
Table 8 Global Installed Wind Power Capacity ... 93
Table 9 Renewable Energy Sources According to Domestic Manufacturing ... 125
Table 10 Research Philosophy ... 126
Table 11 Positivism vs Interpretivism ... 127
Table 12 Types of Interview ... 131
Table 13 Managers that reports to global positions ... 134
Table 14 Managers that reports to local positions ... 135
Table 15 Summary of Semi-structured in-depth interviews ... 141
Table 16 Summary of Semi-structured in-depth interviews ... 142
Table 17 Summary of Semi-structured in-depth interviews ... 143
xii
LIST OF FIGURES
Figure 1 Forms of Interview ... 8
Figure 2 Structures ... 9
Figure 3 Turkey's Industry Chart ... 16
Figure 4 GDP of Turkey ... 17
Figure 5 Potential GDP ... 18
Figure 6 FDI Inflow to Turkey ... 18
Figure 7 Number of Companies with International Capital ... 20
Figure 8 Population of Turkey ... 21
Figure 9 Yearly Population Growth Rate, Turkey ... 21
Figure 10 Age Group Pyramid ... 22
Figure 11 Medium Age of Countries ... 23
Figure 12 Population Avarage of EU ... 24
Figure 13 Labor Force of EU ... 24
Figure 14 Literacy ... 25
Figure 15 Availability of Skilled Labor 2016 ... 28
Figure 16 Qualified Engineers 2016 ... 29
Figure 17 Investment Area ... 33
Figure 18 Energy Statics 2017 ... 37
Figure 19 Societal Challenge for Shell ... 38
Figure 20 Shares of Total Power Generation ... 38
Figure 21 Population GDP and Energy Use ... 39
Figure 22 Oil Proved Reserves 2015 ... 41
Figure 23 Natural Gas Proved Reserves 2015 ... 41
Figure 24 Countries That Joined the Paris Climate Agreement ... 42
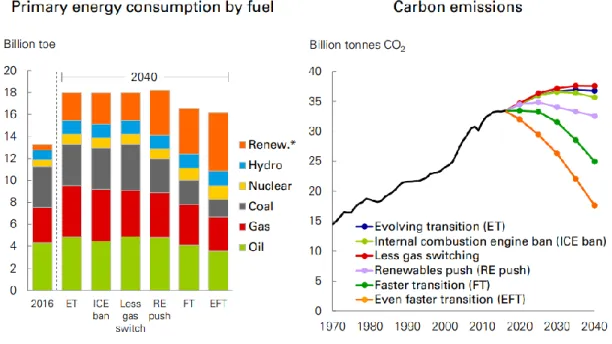
Figure 25 Energy Outlook Considers a range Scenarios ... 43
Figure 26 Primary Energy by Source in the Three Scenarios ... 43
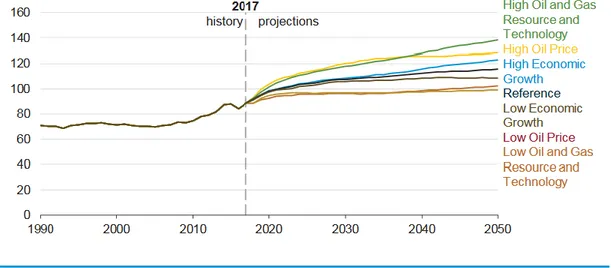
Figure 27 Projections of the Energy Production in 2050 and its Dependents ... 44
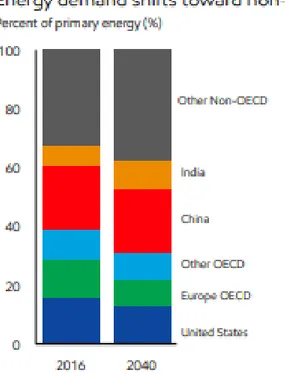
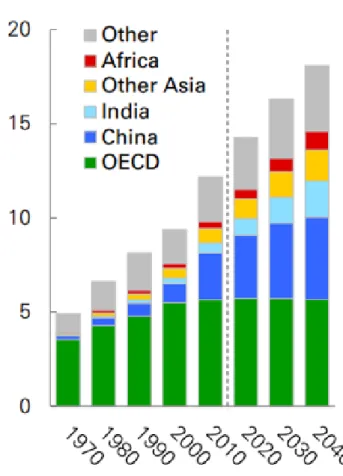
Figure 28 Region Based Energy Demand ... 45
Figure 29 Region Based Primary Energy Demand ... 46
xiii
Figure 31 Global Electricity Production in 2050 ... 48
Figure 32 Forecast World Primary Energy Supply by Sources ... 49
Figure 33 Region Based Energy Transition ... 50
Figure 34 Primary Energy Use by Geography and Energy Type ... 51
Figure 35 Primary Energy Demand by Energy Type and Region ... 52
Figure 36 Growth of Power Generation 2016-2040 ... 53
Figure 37 Projection of Power Generation ... 54
Figure 38 Growth in the Energy Type Projection ... 55
Figure 39 Regional Electricity Generation ... 56
Figure 40 Sector Based Primary Energy ... 57
Figure 41 Sector Based Energy Demand ... 58
Figure 42 Global Energy Demand Varies by Sector ... 58
Figure 43 The rise of the Innovation Cluster ... 59
Figure 44 The Global Perspective on the Energy Transition ... 60
Figure 45 Cooling down of CCS, Unconventionals: Nuclear and Coal... 61
Figure 46 Oil Majors Bet on Renewables ... 62
Figure 47 Total Power Generation Capacity in the EU ... 63
Figure 48 Net Power Generating Capacity Added in 2017 by Main Technology ... 64
Figure 49 Energy Demand and Electricity Generation ... 65
Figure 50 IEA member countries total public energy RD&D by technology ... 66
Figure 51 Renewable Energy R&D by Technology and Growth on 2016, $BN ... 67
Figure 52 Solar Cell Efficiencies ... 68
Figure 53 Wind Turbines 50 times more powerful than 26 years ago ... 69
Figure 54 LCOE ... 70
Figure 55 Global Renewable Energy Employment By Technology, 2012-17 ... 72
Figure 56 Country Based Renewable Energy Employment ... 73
Figure 57 Renewable Energy Country Attractiveness Index ... 74
Figure 58 Total Capacity or Generation as of End -2017 ... 75
Figure 59 Geothermal hot spots around the world ... 76
Figure 60 The Geothermal spots of the Europe ... 77
Figure 61 Top 10 Geothermal Countries ... 78
xiv
Figure 63 Technological Development of Wind Turbine ... 80
Figure 64 Solar Resource Map... 81
Figure 65 Share of Energy from Renewable Sources in the EU Member States ... 82
Figure 66 Global New Investment In Renewable Energy Developed Vs Developing Countries 83 Figure 67 Energy Supply of Turkey ... 85
Figure 68 Turkey Geothermal Development 1984-2018 ... 88
Figure 69 Clean Energy Investments in Europe 2017 ( €bn) ... 89
Figure 70 Share of new Installed Capacity of EU Total 28.316mW ... 90
Figure 71 Global Annual Installed Wind Capacity 2001-2017 ... 91
Figure 72 Global Cumulative Installed Wind Capacity 2001-2017 ... 91
Figure 73 Annual Installed Capacity By Region 2009-2017 ... 92
Figure 74 Energy Deal Values and Numbers between 2008 and 2017 ( USD Billion) ... 96
Figure 75 Applicable Prices Guaranteed by YEKDEM (Feed In Tariff) ... 99
Figure 76 Long Term Contract Prices (Feed In Tariff ) ... 100
Figure 77 Domestic Contribution in Renewable Energy ... 101
Figure 78 Number of Turbines and Their Average Power in Turkey (2018) ... 103
Figure 79 Number of Turbines installed in 2017 and their average power rating ... 104
Figure 80 External Environment Analysis ... 108
Figure 81 The Evolution of Wind Power –year 1987 ... 120
Figure 82 The Evolution of Wind Power –year 1995 ... 120
Figure 83 The Evolution of Wind Power –year 1997 ... 121
Figure 84 The Evolution of Wind Power –year 2010 ... 121
Figure 85 YEKA as an investment model ... 123
Figure 86 Research Onion ... 129
1
CHAPTER 1
INTRODUCTION
Since the beginning of the nineteenth century the industrialization has greatly expanded throughout the world, and consequently, demand for more and more energy every day upsurged sharply. Thus, the inevitability of building a civilization that runs on energy requires access to new energy resources, making the race for energy more vital every year. As a results of this frenetic economic development, providing the energy necessary for industry and reducing the cost of energy production has become crucial, providing a competitive advantage to those that can supply these conditions. Therefore this competitive advantage turns the market into a global competition.
Energy is defined as something essential that cannot be substituted. With the developing technology and its irreplaceable products which causes all of us to dependent on them, energy becomes more essential every day and has turned into a vital element that is impossible to survive in the absence of it. As it is for other countries, seeking alternatives in order to obtain new energy sources becomes imperative for Turkey.
Energy is also seen as the building block for the development of the countries with the increase in the production level. Parallel to this escalation in the production level, the energy consumption increases naturally. With the rapid change and the transformation of the technology, it becomes more conceivable to notice the increase in the clean energy production. However, with the rapid growth in the population and the change in the life standards, this increase in the clean energy does not meet the demands for energy. To fulfil the required demand, the usage of the fossil fuel and the nuclear energy becomes inevitable. Alongside the great benefit obtained from these energy sources, the damage given to the nature is ignored.
2
Scientists have been working on proving the damage done to the ecological balance of the world and warn the countries of possible results and repercussions thereof, supporting their findings with facts. The negative effect on the ecological balance, along with climate change, therefore become the trending topic due to the problems they have created so far and the potential danger for the near future.
Amidst various scientific studies done every year on the topic, awareness has been tried to be raised for the reduction of ecological problems. As it is determined, a reduction in the release of the harmful gasses is the most effective way for preventing the ecological problems humankind has been preoccupied with currently. This topic should be supported by the governments and the unions to provide sustainability, because energy production seems the most effective factorto prevent, or at least reduct the release of the harmful gasses.
The usage of renewable energy sources is an efficient method and it plays an active role for the solution of decreasing the usage of the fossil fuels to minimize the damage done to the nature. This is the reason governments all around the world are clamoring to include renewable energy as a probably source to their development plans when in concerns energy. With the increase in the production volume of the renewable energy, the total energy volume will help the governments financially as well. Most of the developing countries have trouble meeting energy need of their developing industries with their natural resources. This forces them to import the necessary energy from other countries, be it in the form of actual energy or the basis to produce the required energy. This, in turn, very wellmight create a burden for their financial conditions.
On the other hand, the increase in the volume of energy production enables the excess amount to be exported easily enough, as energy is such a highly demanded goods throughout the world. The excess amount of energy may also be used to encourage technological development, which also incidentally may help reduce the unemployment level. Therefore reduction to the cost of energy production would enhance the financial and the technological condition of the countries.
3
Reducing energy cost is associated with two concepts. These concepts are:
-An excess of energy sully -Low cost production of energy
Some of the countries are luckier in comparison with the rest of the world due to the fossil fuel reserves they have in their territories. Saudi Arabia, Kuwait, and Venezuela are but a few examples for the countries that are rich with the petroleum they have located in their lands. The existence of natural gas in some lands such as Russia and Iran is also a great opportunity to generate energy. On the other hand, the supply level in the highly industrialized countries such as USA, UK and France causes them to not be equally advantageous when it comes to meeting their energy needs . The demand for energy in all sectors, especially for their heavy industry affects the energy deficit issue they face.
The limited access to the fossil energy sources such as coal, petroleum and natural gas leads these industrialized countries to extend their political influence over the countries that have these fossil energy sources quite forcefully. Alternatively, it may force them to produce alternative energy sources.
Energy is seen as the building block of the social development of the countries as the necessary part for manufacturing and the inevitable need for the daily life. Therefore the authorities in the management and people who are in charge of the energy management of countries should consider diversifying the energy sources to provide clean and safe energy without power blackout (Pamir, 2005).
Today, governments encourage the investors to include their development plan to increasing the usage of renewable energy to reduce the carbon footprint and to decrease the risk of having nuclear accidents such as Chernobyl. As a result of the endless ambition to produce more, earn more and to go one step further in the global competition, the governments sometimes neglect the harm they are doing to nature, which is impossible to restore. Renewable energy is one of the most preferred alternative energy types to provide the sustainability of manufacturing without harming the nature compared to other energy
4
sources, sush as fossil fuels. With the sustainability and the accessibility of the renewable energies by the countries that don’t have the fossil fuel reserves they need to meet the energy demand they face, the number of the skirmishes between the countries will possibly have been reduced in the future.
With the many renewable energy options that exist such as hydro, biomass, wind, solar and geothermal, even the countries with no fossil fuel reserves may start to produce energy which is cleaner and safer than the fossil fuels. The selection of these options vary depending on the availability of the energy sources in that region. These renewable energy sources are not only vital for Turkey for the continuity of its industrial and societal development but also for other countries, including the ones that have great amount of fossil fuel supplies. (Demirbaş, 2001)
International Energy Agency defines the renewable energy as energy which is reproduced from the nature and natural processes. These processes are generally use direct sunlight, or the heat sources deep in Earth.
Solar and wind energy have become more popular in present time due to the advantages they have, such as being accessible in most every region, or that not requiringa great initial investment to install. Even an individual is able to start producing renewable energy for their own usage on the roof or garden of their home. This enables them to have energy even in rural areas anddecrease the energy cost of the household for a mid-term period. However, to spread the advantages in a macro level from micro level, the governments should create a viable strategy in accordance with the existing conditions and to account for the alternatives. Governments nowadays tend to make regulations, tax reduction, create incentives or guarantee of purchase to encourage the use and production of clean energy using this way not only for individuals but also to attract huge investors to the cause. That is one of the greatest tasks a country to undertaketo ensure their future.
5
European Union imports 82% of its petroleum need and 57% of its natural gas need. These values will undubitably increase in the future. This is a great danger for European Union politically, since the increased risk of being dependent on other countries to import such a crucial part of the economy. This is the reason European countries are trying to increase the number of the energy sources to diminish the risk.
All the facts that present the inevitable rise of the energy needs of the world inspire the institutions in charge to take action. According on the predictions, increasing population and the developing technology will lead the energy need of the world in 2030 to be 60% more than what is today and the energy need of Turkey will be 100% more comparing to present.
Turkey, also a developing country, is getting more and more industrialized every year just like its counterparts. Even though this industrialization makes Turkey more powerful in the manner of production and technology, it also makes it more dependent to the other countries due to the lack of raw material for energy manufacturing. The import dependency ratio of Turkey was 72% in 2012 according to the Ministry of Energy and Natural Resources. It is caused by the energy production with fossil fuels such natural gas being 100% imported.
Therefore, Turkey should consider European Union as an example to gain pace in the renewable energy production to reduce the risk of being dependent on other countries.
With the great interest on the renewable energies, the number of the articles on the topic hasincreased in recent years. These articles are generally focusing on the technological development. Thus they are very beneficial for the theoretical studies. On the other hand, world of business operates on a different wavelength. Even though the great benefits of the renewable energy such as low carbon footprint, less dependency to other countries, minimizing the risk with increasing the energy production option with adding riskless production units and so many other factors attract the governments; cost of the investment, the expensiveness of the technology and the difficulties of the storing the energy produced
6
by renewable sources make it harder to consider a very profitable choice for a lot of companies.
Therefore, the governments focuse on combating this investment cost barrier with different strategies. Attracting the investors by promising them incentives or guarantee of purchase are good ways to overcome the investment issue. As the actual development of the technology for renewable energy production, its maintenance cost is also quite prohibitive and requires a great amount of know-how. Hence, including the MNEs with great know-how about the entire process as a strategy to provide the system properly from the beginning to the end but also for the technology transfer., This is the reason localization strategy appears on top of the list of the strategies for different governments.
1.1. RESEARCH OBJECTIVES
As stated in the previous section of the study, inasmuch as the localization strategy is one of the most demanded strategies to be implemented in the renewable energy sector, the dynamics of the aforementioned approach will be examined throughly to enlighten the issue as an exploratory study for the upcoming localization experiences. It is also intended to become a guide for the future researches as it involves primary data.
One of the biggest MNEs will be explored as a guide. And the necessary information will be obtained by using the method of in-depth interviewing with some of the managers in leading positions as determinants to achieve the success of the adaptation of the localization in the renewable energy market in Turkey. In-depth interview is chosen to gather the critical opinions and the perspectives of the small number of respondents who play a critical role for the determination of the strategy of aforementioned MNE. This also will be beneficial to reflect the experience of the skilled managers to create more reliable and valid pathway for the company in its journey.
7
This dissertation seeks to explain the localization strategy in detail and display the advantages and the disadvantages in both MNEs’ and the governments’ points of view concerning the issue. The factors that lead the MNEs into the application of the benefits provided with the localization strategy, the risks that are taken into the consideration, the expectations, key to the success and the necessities are expounded upon from both sides of the equation.
1.2. RESEARCH QUESTIONS
• Can localization strategy be applied by the manufacturing companies in renewable energy sector for their success?
• What are the factors that encourage the MNEs to apply localization strategy? • Are there any special reasons to apply localization strategy in renewable energy
industry?
• What are the crucial points that should be considered by the MNEs to achieve successfor localization strategy?
• How do the governmental policies affect the localization process in renewable energy industry?
1.3. RESEARCH METHOD AND ANALYSIS
In order to clarify the path to the localization in renewable energy industry and to gain inductive approach, multi-method qualitative study will be conducted with the collection of primary and secondary data.
Significant knowledge about the localization process, and the dynamics of the localization and the feed in tariff policies for energy sector was obtained by collecting data from
8
various academic articles, reports and books as secondary sources. The literature review is comprised of this data collection.
Concerning the topic, the use of in-depth interview method is chosen, for it is described as a qualitative technique that brought a immense advantage to ascertain precious information from the limited number of interviewees. The interviewees are the decision makers of a selected MNE’s and managers who took part in the success of the localization process of the abovementioned company in the energy market of Turkey.
Figure 1 Forms of Interview
(Saunders, Lewis, & Thornhill, 2009)
In this study, non-standardized interview method is regarded as more useful to exact the detailed information from the managers. No predetermined list of questions will be used in order to not limit the information flow and to enable the free association that will yield more details regarding the issues at hand. Also the one to one type of the non-standardized interview is chosen to ensure sincerity from the interviewees. However, due to the constraints in distances, alongside the face to face interviews, interviews over telephone, internet and intranet-mediated ones will be used.
9 Figure 2 Structures
(Saunders, Lewis, & Thornhill, 2009)
With the secondary data collected from energy reports and annual reports of Republic of Turkey Ministry of Energy and Natural Resources, the mutual benefits of both the selected MNE that applied this strategy and became the first local producer of a product and the country allowing and encouraging this behavior in its borders will be examined.
Instead of numerical values, the non-standardized data will illustrate a considerable part in this study. The reasons to take part in this localization process, the difficulties in the application of the process and the advantages that are gained with the achievement of it will be examined in this thesis with the abovementioned primary and secondary data collection techniques (Saunders, Lewis, & Thornhill, 2009).
10
CHAPTER 2
LITERATURE REVIEW
The term globalization which is described by Osland as “the growing economic interdependence of countries worldwide through the increasing volume and variety of cross border transactions in goods and services and of international capital flows, and also through the more rapid and widespread diffusion of technology” (2003) seems as if it was invented quite recently. However it is an exceedingly older concept, the basics of globalization being felt throughout the world since first century AD. Merchants brought more than spices or other agricultural products from oversees to sell in Europe. Information and technology were also carried by these merchants between the greatest powers of that time period: The Roman Empire, The Parthian Empire and The Han Dynasty (Waugh & Lee, 2000). With this technology transfer; fireworks, the products erstwhile used for the entertainment purposes in China, became the instruments to destroy the great walls of Istanbul, which was the end of feudal era (Şerifsoy, 2012).
The effects of globalization are felt more than ever in this era. With the rapid change in information sharing techniques, we gained a faster, better and completely new accessibility to the whole world as never possible before. Alongside the pace of this information flow, the change in the technology became more apparent which brought reforms and industrial revolution.
Globalization gained even more importance after the Second World War with more freedom especially by getting rid of economic obstacles between international businesses. With open business practiced across borders instead of just within the home country of a company, it paved the way for the mulit-nationalism in the business world. The formation of multinational enterprises in 1970s, which sped up the cross-border business transactions exponentially, helped the spread of business interests into more attractive, newer markets rather than staying in already mature markets of home countries. This behavior was tied closely with the goal of sustainable growth that all MNEs display and work towards
11
achieving. With the help of easier international business and less economic obstacles between the countries let MNEs that aimed higher expand their potential markets and allowed them to have more profit by not only making business in their own country but also worldwide. According to Sachs Goldman (2003) and Vaclav (2012) emerging markets such as BRIC countries would become more attractive for the MNEs located in developed markets. With the “expanding consumer bases, rising income level and gradual opening to global trade” the MNEs provide a better potential and guarantee their future successes (Maha , Ignat, & Maha , 2010). However this profit provide brutal worldwide competition among MNEs. Accordingly, these MNEs form different strategies to have competitive advantage over each other. Penetrating into a global market is a monumental step for a company. Therefore this step should be taken wisely. Which countries should be entered, should there be a joint venture or not to enter the new market, how to handle the cultural differences, and also which pricing strategy that should be followed are all the important questions that cannot be answered without the determination of a global strategy (Kotler & Keller, 2012)
International strategy is the first one that should be determined for the guidance of the MNEs in different countries. The term international strategy has been more concerned with the article of “The Globalization of Markets” by Theodore Levitt. Thodore Levitt, who coined the term globalization (Feder, 2006), explains the importance of the global strategies that should be applied by the MNEs focusing on the permanent growth. “Which strategy is better is not a matter of opinion but of necessity” (Levitt, 1983). The selection of the strategy serves an illuminating purpose for MNEs. The decision should be taken wisely due to its effect on the further decisions of the company. No matter which strategy is selected, the adaptation of these MNEs to the strategy determined becomes their first task in any new venue. “Companies that do not adapt to the new global realities will become victims of those that do.” (Levitt, 1983). As it is expounded upon in many articles, fit is the main idea in the contingency theory (Lawrence & Lorsch, 1967) that advices “a given set of environmental characteristics demands a certain response from an organization in order for it to be effective” (Toulan, 2007), (Lin, 2014).
12
Localization is one of the key points of the global strategies of MNEs’. As it is elucidated by Liang-Hung Lin (2014) “Products and services are differentiated to meet national differences, and organizational policies are characterized to conform to governmental regulations and local business practices.” MNEs use this strategy especially to overcome the cultural adaptation problems and not to be effected by the governmental regulations they run into during business transactions. There are many other reasons to apply localization strategy such as availability of source of power, nearness to raw materials, nearness to the market and momentum of an early start (Economics Concept, 2017).
Energy industry is one of the acclaimedly first industries among the ones to apply the localization strategy. The reasons for this great jump can be explained in many ways. However the need for energy is undoubtedly the most important one among all. With the industrial revolution, the energy needs have changed completely. Natural sources were burned to heat up, animal muscles were used for the production and for the transportation and human muscle or wind were used to pump the water or provide grain (Union of Concerned Scientists, 2017). This long-held true scenario has changed with the invention and the usa of steam engines in the 17th century onwards. For the present time, the need of the energy is even more crucial than the last centuries. The energy is the dominant factor that affects the productivity, which in turn directly influences the development of the countries. This may affect the financial interdependence of the countries. Therefore the energy need becomesmore important every day. With the changing factors of the energy production, the renewable energy production became more popular. Renewable energy has a lot of advantage such as being clean, sustainable and more inclusive for financial independence. With the practice of renewable energy production, the countries become more independent by preventing the usage of fossil fuels as raw materials, which are not easy to obtain in a single location.
On the other hand, there are some disadvantages to renewable energy, the most substantial one being not being easy to afford in the investment stage. Instead of the regular financial difficulties, installation and the maintenance issues are not easy to overcome because of the developing technologies. There are some companies dedicated for renewable energy production and spend millions of dollars for the research and development purposes. With
13
these disadvantages, it is lamentably not easy to reach the full independence with the production of sustainable energy in a short term. Thus governments have started to regard the issue in detail and determine ways to attract the attention of the dedicated companies, which have the technological know-how and the investors that would provide the capital. Attracting these giants to apply localization strategy is one of the best way to overcome these disadvantages. Hence, governments starting to apply different tarrifs to make their countries attractive for investors. This is also a good start for the investors to be involved, because with the same amount of sources, the amortization period will be shorter. And a good start for the government in that created favorable conditions in the first place, since it would encourage for a faster start of the production.
Localization strategy is becoming more and more important, especially in the developing countries, due to the great benefits it provides such as increasing the skills and the capabilities of the locals (Oppong, 2016) and helps transforming the pre-developed technology without any necessity of the research and development spending by the local government and/or the local companies. These localization processes gained a great monemtum with the change in the strategies of multinational corporations and the attitudes of governments. According to Geoffrey Jones, localization strategy provides a great advantage to some multinational companies in some periods. Unilever is one of those examples which applied localization in developing countries such as Turkey and India and gained a great competitive advantage over its competitors (Jones, 2010). As it is indicated in the same article, “Unilever’s decentralized management structure permitted flexibility in adjusting to the different environments in these countries. In countries such as India and Turkey, the company made margarine from sunflower oil and toilet soap from palm oil”. Therefore, since 1950s, applying the localization strategy, Unilever has been able to transfer brands, transfer the technology it has, protect itself from the tariff walls and overcome the governmental obstacles.
14
2.1. INFORMATION ON TURKEY
With the great tendency towards globalization, the term foreign investment has been getting more importance day by day. MNEs are focusing on the suitable markets to penetrate which provides most benefit for them. With this change, the emerging markets are getting more and more important due to their great potential. Instead of making investment into already developed countries and compete with the other giants in the sameself market, the MNEs are considering about going into developing countries to dominate the market, which incidentally has more often than not a greater population than those of developed countries. Indubitably, this is not the only factor that comes into play for the selection of these countries by the MNEs, but the most important ones are expounded upon in the following sections
Turkey is one of the countries in demand for these MNEs for many reasons. The prominent points such as geopolitical position, financial conditions, demographic conditions, international relations and governmental attitude are highlighted in many different sources.
2.1.1. GEOPOLITICAL POSITION
Turkey has a great importance due to its geopolitical position. As it is seen in figure 3, Turkey is located in between Europe and Asia. This location is clarified in detail as “Turkey is centrally situated between Europe, where much of the world’s political and economic power is concentrated, and Asia, which has lately become a vital center of economic growth and rising political influence.” (Çakar, 1998)
According to Nezihi Çakar (1998) some factors that draw more attention to the geopolitical position of Turkey as seen below:
15
• The control of straits such as Bosphorus and Çanakkale (Dardanel) • Being the Southeastern branch of NATO
• Acting as an energy bridge in between the areas which are rich in natural resources and the developed Western world
• Being a natural cultural bridge in between the West and the East
• Being a positive sample to the Middle Eastern countries with its secular regime
With its geological position, Turkey is becoming more and more important every day by being in a center location between the developing countries and the developed ones. Turkey, which is two to three hours distance of flight to essentially all European countries, has been used as a central hub for the European companies to let them reach more crowded markets of the area.
2.1.2. FINANCIAL CONDITIONS
With the help of the geographical advantage, the economic and the diplomatic importance of Turkey is increasing day by day by becoming the commercial center of Southeastern Europe, Middle East and Eurasia (Deloitte, 2014).
16 Figure 3 Turkey's Industry Chart
(Focus Economics, 2017)
Turkey has become one of the most powerful economies in its region with its diversified business activities and the promising production with its young and educated population. The industrial production level which is shown in the below figure 3 displays the potential of Turkey:
In addition to these advantages, Turkey has earned valuable experiences to overcome economic crises, which makes Turkey less fragile to global crises that might potentially hit the region. The economy has been supported with high quantity of foreign direct investment, privatization and public private partnership ( PPP).
Turkey as one of the emerging markets, has the world’s 17th biggest economy based upon
the GDP level as seen in the Figure 4 which is taken from the reports of World Bank (2017).
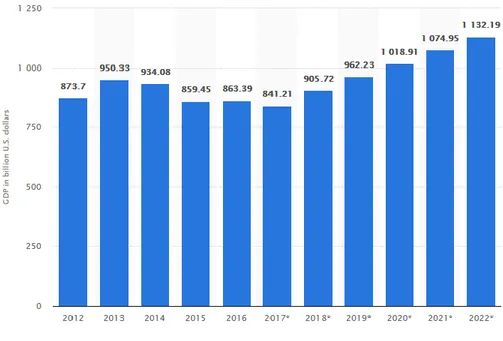
17 Figure 4 GDP of Turkey
(Worldbank, 2017)
In conjunction with the promising GDP levels of Turkey, the expectations are also impressive as it is shown in the Figure 5 which demonstrates the potential of a well positioned economy.
The promising GDP earns the trust of the foreign investors and triggers them to make investments in order to take advantage of a stable developing market.
18 Figure 5 Potential GDP
(Statista, 2017)
As it is shown in the Figure 6, the FDI of Turkey diplays the attitude of the foreigner investors in the market.
Figure 6 FDI Inflow to Turkey
19
According to Unctad (2017), half of the total FDI to Turkey comes from the manufacturing accounts, which show the diversified industrial structure and helps Turkey become the second largest host country of FDI in the west Asia area, just behind Israel. As stated by the survey of UNCTAD, Turkey has been selected as one of the most suitable sources of FDI for the years 2013-2015. Additionally, Turkey is determined to be the 51st of 189 countries in “ease of doing business” (Worldbank, 2017) with the help of the economic reforms that took place in 2003. These reforms also gave way to the PPP and privatization strategies of the Turkish Government. Even though the positive chart has been adversely affected by the coup attempt that took place in July 2016, the interest received from foreign inverstors is still promising. This tendency is seen from the number of the companies located in Turkey with international capital as seen in figure 8.
20 Figure 7 Number of Companies with International Capital
(Invest In Turkey, 2017)
2.1.3. DEMOGRAPHIC CONDITIONS
In additional to the developing economy and geographical advantages, the population and the properties of the aforementioned population attracts the attention of the MNEs. In this, both the quantity and the quality of the population matters.
First of all, quantity of a population is an important factor for the MNEs. The volume of the population shows the volume of the domestic market available for economic activities to take place and also shows the possibility to find suitable workforce for the localized branch.
Besides the economic and geographical advantages, with its population, Turkey becomes one of the most attractive countries for MNE. Turkey is ranked as the third most populated country in Europe after Russia and Germany with its over 79 million number of people.
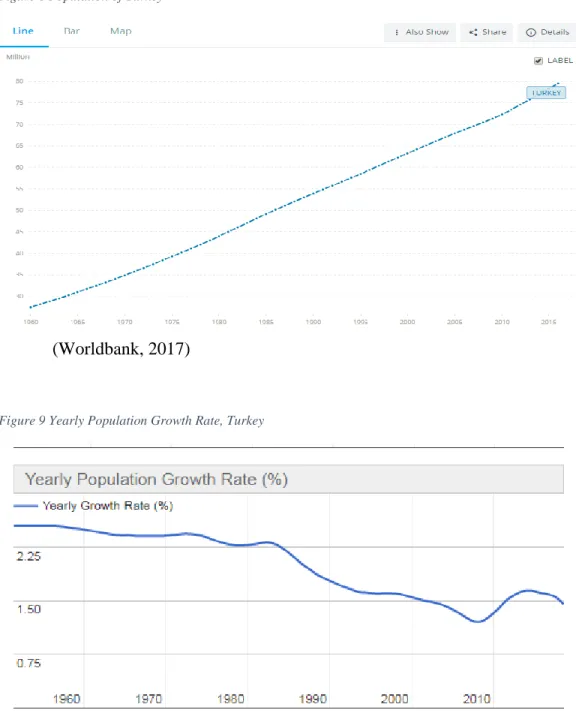
21
In absolute numbers, this is 9,5% of the entire Europe population. As it is presented in figure 8 and figure 9, Turkey has an increasing population with more than 1% yearly population growth rate.
Figure 8 Population of Turkey
(Worldbank, 2017)
Figure 9 Yearly Population Growth Rate, Turkey
22
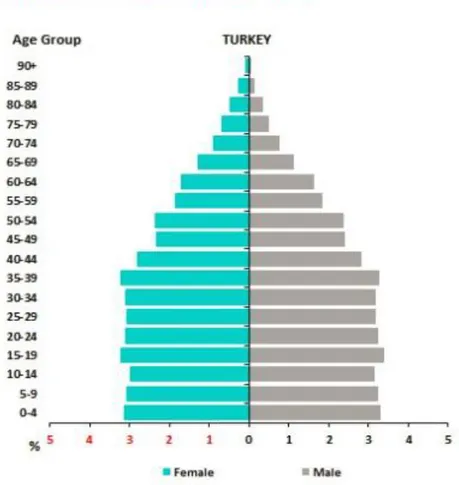
With the positive growth rate of the population, Turkey’s population becomes younger and younger. As it is seen in figure 10, half of the population in Turkey consists of under the age of 31. According to Invest in Turkey (2017) this is the largest young population in the overall area compared to the EU countries. Not just the great numbers in general, but also the youth population volume of the countries plays a great role, especially for the convenience of the workforce.
Furthermore, the quality of the population matters for MNEs not only for the market value but also to generate a suitable workforce. The increasing numbers of population is an important factor for the predictions of the country’s future and gives a general idea about the quantity of the population. In additionto this element, it is also a very important point of discussion for the quality of the population.
Figure 10 Age Group Pyramid
23
Productivity of a country is directly affected by the medium age of the country, because a younger population means a more active workforce. Majority of developed countries in Europe has been suffering this increment of the median age of the population, despite all the actions to counter it. Turkey has an advantage over Europe with lower population age average. As it is stated in figure 11 and figure 12, Turkey has a younger population comparing to Europe. Ireland and Iceland have the youngest population average in Europe, but still the differences between the average ages are significant. Iceland and Ireland have 36.3 as median age, whereas Turkey’s median is 30.5. Of course this six year difference affects the efforts to find more active and suitable workforce.
Figure 11 Medium Age of Countries
24 Figure 12 Population Avarage of EU
(Eurostat, 2017)
Turkey has gained a considerable momentum for the growth of the labor force, certainlyaided by the increasing young population. As the growth of the labor force is examined in figure 13, Turkey has the greatest value compared to the European countries which also showcases the potential of Turkey and its attractiveness to be invested in by MNEs.
Figure 13 Labor Force of EU
25
As for the quality issue, education is an important factor to create a suitable workforce for the localized branch for MNEs. With the latest regulations the Turkish Government has passed the literacy value has increased considerably. Using the date collectedfrom UNESCO and Central Intelligence Agency’s reports, figure 14 has been prepared to display the literacy levels around the world. Even though literacy level gives us a great idea about the education level of the country, this data is not enough to be a deciding factor for all the sectors of the MNEs on its own. Higher education level is also required for MNEs to provide full service from the host country’s workforce including R&D and related services if they are necessary.
Figure 14 Literacy
(Index Mundi, 2014)
According to the data provided from COHE (Counsil of Higher Education), the number of the universities and the number of the students that graduated from these higher education institutions have been increased radically. The detailed numbers are given in table 1 and table 2 to show the higher education levels of Turkey.
26 Table 1 Academic Units 2016-2017
27 Table 2Number of Students
28 Figure 15 Availability of Skilled Labor 2016
(Invest In Turkey, 2017)
With the increasing in the number of the universities, the number of the qualified workers has been increased correspondingly. However, this development brought a different problem into play for Turkey:, the rising numbers of unemployment for qualified workers. Even though it affects the Turkish qualified workers negatively, it provides a great benefit for the MNEs that are planning to build a local branch in Turkey. These benefits include the increase of the availability of the skilled workers and the decrease in the cost of employing them. As it is evidenced in figure 15 and figure 16, the availability of the skilled labor and the the qualified engineers in Turkey are displayed with the data obtained from “IMD World Competitiveness Executive Opinion Survey based on an index from 0 to 10”.
29 Figure 16 Qualified Engineers 2016
(Invest In Turkey, 2017)
In addition to the availability of the skilled workforce for the required position, the compensation for the appropriate workforce provides a great benefit to the localized branch of MNEs. As it is shown in table 3, Turkey is a very attractive country based on the hourly compensation costs in manufacturing. With the international and regional relations Turkey has been a party to, it becomes more popular among the European countries to invest in manufacturing sectors.
30 Table 3 International Comparisons of Hourly Compensation Costs in Manufacturing
(The Conference Board, 2016)
1997 (2) 2014 2015 1997 (2) 2014 2015 Switzerland 30.43 64.73 NA 132 175 NA Norway 25.88 62.88 49.67 112 170 132 Belgium 28.95 55.6 46.56 126 150 123 Denmark 23.72 52.45 44.44 103 142 118 Sweden 25.05 50.15 41.68 109 135 111 Germany 28.86 49.47 42.42 125 134 112 Australia 19.29 46.07 38.75 84 124 103 Austria 24.91 45.71 39.19 108 123 104 Finland 22.36 45.03 38.46 97 122 102 France 24.87 44.18 37.59 108 119 100 Ireland 17.42 43.38 36.02 76 117 96 Netherlands 22.71 42.21 36.53 99 114 97 Italy 19.77 37.37 31.48 86 101 83 United States 23.04 37.04 37.71 100 100 100 Canada 18.5 34.56 30.94 80 93 82 United Kingdom 19.3 33.01 31.44 84 89 83 Spain 13.96 28.19 23.65 61 76 63 Japan 22 26.94 23.6 96 73 63 New Zealand 12.04 26.93 23.28 52 73 62 Singapore 12.16 26.82 25.41 53 72 67 South Korea 9.24 23.77 22.68 40 64 60 Israel 11.62 23.04 21.69 50 62 58 Greece 11.61 19.21 15.48 50 52 41 Argentina 7.55 17.68 20.76 33 48 55 Slovakia 2.84 12.92 11.26 12 35 30 Portugal 6.44 12.68 11.08 28 34 29 Estonia NA 12.41 11.02 NA 34 29 Czech Republic 3.25 11.74 10.29 14 32 27 Brazil 7.03 10.54 7.97 31 28 21 Poland 3.29 9.83 8.53 14 27 23 Hungary 3.05 9.49 8.25 13 26 22 Taiwan 7.07 9.49 9.51 31 26 25 Mexico 3.47 6.76 5.9 15 18 16 Turkey NA 6.25 5.81 NA 17 15 Philippines 1.24 2.11 2.16 5 6 6
Hourly Compensation Costs(1)
31
2.1.4. INTERNATIONAL RELATIONS
International relations is one of the most important factors for MNEs to consider starting up and continuing their business. With the great change in the business world and how business is conducted, the competition of the companies engage in has changed shape. This globalized competition and digitalized economies lead the governments to be a part of the organizations and direct them to sign agreements with host countreis. Turkey has been giving a great importance for the international and regional relations, because Turkey is very eager to create a convenient space for foreign companies to conduct their investments in Turkey. As it is stated in the report of How to do Business in Turkey published by Deloitte (2014), Turkey has been taking place in many international organizations such as “United Nations, the North Atlantic Treaty Organization (NATO), Organization for Economic Cooperation and Development (OECD), World Trade Organization (WTO), Economic Cooperation Organization (ECO), Organization for the Islamic Conference (OIC), Black Sea Economic Cooperation (BSEC), International Bank of Reconstruction and Development (IBRD), International Monetary Fund (IMF), the Group of Twenty Finance Ministers and Central Bank Governors (G20 Developing Nations), and Asian Development Bank”. In addition to these organizations, Turkey became a member of EU Custom Union in 1996. Being a part of these organizations attractforeign companies and make them more confident to invest in a country, assuring them the country is going to hold up international business practices by the virtue of participating in and being a part of the international community..
In conjunction with this, Turkey is eager to attract the attention by being a part of investment treaties. According to the report of Unctad (2017), 2016 was an active year with many International Investment Agreements for Turkey (IIA). Turkey is the most active country by concluding seven treaties.
32
2.1.5. GOVERNMENTAL ATTITUDE
Governmental attitude for the foreign investment attraction is very important and one of the determinants of the condition of businesses in the recent years. Especially the developing countries introduce investment incentives and projects into the market in the hopes of attracting foreign interest. Turkey has been active with the introduction of these projects and incentives for the last few years.
To start off, with the active role in the incentives, Turkey has become a great choice for the foreign investments, largely dueto Turkish government being eager to reduce the dependency of the importing of the goods, which especially plays a considerable role in the strategic areas such as energy production. Additionally, these incentives are very beneficial for the encouraging the technology transfer. As it is stated in UNCTAD report (2017) “Turkey introduced an extensive support package for research and development (R&D) and innovation-related activities. Also, in 2017, the country introduced a regulation offering Turkish citizenship to foreign investors, subject to certain conditions.”
According to KPMG report (2017), the investments are classified as general investment in accordance with scale, prioritization, strategic importance and based on the regions, which is shown in figure 17 and based on the sectors depending on the area of the investment. Turkey plans to encourage and channel the investors, including foreign investors to start their enterprises in the requested areas. Additional to those, Turkey has introduced two new incentive packages as it is determined in the KPMG report (2017) which are “centre of attraction” and “super incentives”.
33 Figure 17 Investment Area
(KPMG, 2017)
The name “Super incentives” is given to a flexible and customized incentive system. As it is stated in the report “The qualification of an investment will be determined based on whether these investments meet the current or future requirements of Turkey in line with the targets set in the development plans and annual programs and/or whether they could ensure continued supply, reduce dependence on foreign sources, achieve technologic transition, be innovative, and add value as well as being R&D focused” (KPMG, 2017) it plays a critical role for the development of the technology. In this way, the incentives can be more and more attractive on a case by case basis due to the importance of the goods which is planned to be produced. Investment Incentive certificate should be obtained from the Ministry of Economy to have the advantage of the super incentives as follow:
• VAT and customs duty relief • VAT refund possibility
• Reduced tax rates or tax exemptions (corporate tax) • Social security employer premium support
• Income withholding tax support • Qualified personnel salary support
34
• Interest support or Government grants • Capital contributions
• Support on energy expenses • Government purchase guarantee
• Land allocation and free of charge transfer of the land • Infrastructure support
• Facilitation in bureaucratic process
(KPMG, 2017)
Furthermore, the “entre of Attraction” is introduced in November 2016. The main aim of the program is to spread the development in undeveloped areas and to provide a balance in the evolvement of the country.
To continue to the reasons for incentives regarding investment, Turkey, as one of the developing countries, has a great demand for energy. To fulfill this demand, Turkey is considering the energy sector as one of the most critical ones. Besides attracting the investors with the help of incentives, Turkey is also considering some projects especially in the renewable energy sector under the name of YEKA (Renewable Energy Resource Zone). As it is stated in the report of Republic of Turkey Prime Ministry Investment Support and Promotion Agency (2017) “in order to commission large-scale renewable energy projects through utilization of locally-manufactured components in the renewable power plants. Under the model, the largest-ever solar power auction in Turkey's history took place on March 20, 2017, while a similar tender for 1-GW wind power plants took place in August 2017 with local manufacturing and R&D requirements.”
35 Table 4 Condition of Turkey
(World Bank, 2017)
People 1990 2000 2010 2016
Income share held by lowest 20% 5.9 5.8 5.9 5.8 Life expectancy at birth, total (years) 64 70 74 75 Fertility rate, total (births per woman) 3.1 2.5 2.2 2.1 Adolescent fertility rate (births per 1,000 women ages 15-19) 65 48 35 27 Contraceptive prevalence, any methods (% of women ages 15-49) 63 64 73 74 Births attended by skilled health staff (% of total) 76 81 95 97 Mortality rate, under-5 (per 1,000 live births) 74 39 19 13 Prevalence of underweight, weight for age (% of children under 5) 8.7 7 1.7 1.9 Immunization, measles (% of children ages 12-23 months) 78 87 97 98 Primary completion rate, total (% of relevant age group) 93 .. 99 92 School enrollment, primary (% gross) 104.2 102.8 101.6 102.5 School enrollment, secondary (% gross) 50 73 84 102 School enrollment, primary and secondary (gross), gender parity index (GPI) 1 1 1 1
Environment 1990 2000 2010 2016
Forest area (sq. km) (thousands) 96.2 101.8 112 117.2 Terrestrial and marine protected areas (% of total territorial area) 0 0.2 .. 0.2 Annual freshwater withdrawals, total (% of internal resources) 13.9 18.5 18.5 18.5 Improved water source (% of population with access) 86 93 99 100 Improved sanitation facilities (% of population with access) 83 88 93 95 Urban population growth (annual %) 4 2.3 2.2 2.2 Energy use (kg of oil equivalent per capita) 978 1,201 1,475 1,657 CO2 emissions (metric tons per capita) 2.71 3.42 4.12 4.49 Electric power consumption (kWh per capita) 930 1,653 2,492 2,855
Economy 1990 2000 2010 2016
GDP (current US$) (billions) 150.68 272.98 771.88 857.75 GDP growth (annual %) 9.3 6.6 8.5 2.9 Inflation, GDP deflator (annual %) 58.2 49.3 7 7.7 Agriculture, value added (% of GDP) 18 11 10 7 Industry, value added (% of GDP) 32 30 28 32 Services, etc., value added (% of GDP) 50 59 62 61 Exports of goods and services (% of GDP) 13 19 20 22 Imports of goods and services (% of GDP) 18 23 25 25 Gross capital formation (% of GDP) 25 24 27 29 Revenue, excluding grants (% of GDP) 13.7 17.2 31.7 32.4 Net lending (+) / net borrowing (-) (% of GDP) -3 -5.7 -3 1.1
36
2.2. ENERGY SITUATION
International Energy Agency (IEA) defines energy as the ability to do work or to produce heat and energy manifests itself in many forms: heat, light, motive force, chemical transformation etc. (IEA 2013). Even though this is the direct definition of energy, it can be described in many other ways due to the great importance it presents in present times. A short description of energy is depicted by Anco Blazev in Global Energy Market Trends (2016) as “The concept of energy in this text encompasses anything, everything, anybody and everybody related to or involved in the production, distribution, and use of anything and everything energy.” It is also defined as the main engine of the global economy due to the role it plays in the production, distribution and utilization of goods and services.
Energy is vital for the production of course but it is also crucial to acquire for the continuation of modern daily life due to the dependency of the technological products developed in the last century. . As it is stated in detail in the existing literature, this makes energy a must have for the social prosperity, social development, improved quality of life and the sustainable development (Ozturk & Yuksel, 2016), (Toklu, 2012), (Çapik, Yılmaz, & Çavuşoğlu, 2012).
According to IEA reports, fossil fuels are still very much in demand as it is exhibited in figure 18. The produced energy in 2017 is given the 13.647 million tonnes of oil equivalent. And 81% of this value is produced by the fossil fuels. This portion will change in the future with the increase in the production of energy. This estimation is vital for energy giants and MNEs to create their strategies accordingly and plan the investment in an advantageous area for the company. Therefore many of these detailed reports that analyze the entire world’s energy exist and show the needs. Energy giants such as BP, Shell and Exxon Mobile take this issue seriously and provide these analyses annually.
37 Figure 18 Energy Statics 2017
(IEA, 2017)
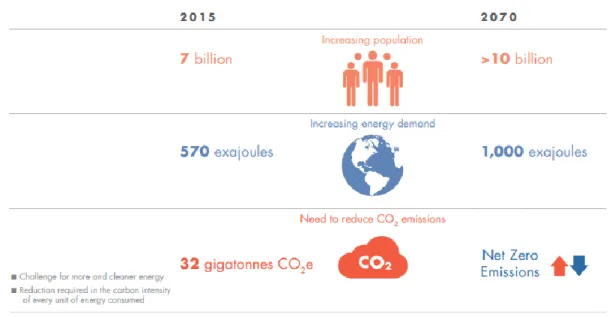
There are many similarities in between the reports of IEA (2018), BP (2018), Shell (2018) and Exxon Mobile (2018). They are all give immense importance to the energy need of the world, which will increase with the developing technology and the increasing population over the years. As it is determined in figure 19, the population will be one and a half times the current population level within 55 years, while the energy needs will be doubled from what it is today. This shows the expectations about the technological progress and the industrialized world. These predictions play a vital role for the vast companies and for investors to establish the future plans by presenting the trends. As it is established in figure 20, the proportion of some of the energy types are increasing in the pie year by year by stealing the popularity of other energy types.
38 Figure 19 Societal Challenge for Shell
(Shell, 2018)
Figure 20 Shares of Total Power Generation
39
Making predictions about the future needs of energy is a critical issue for the success of the global energy giants, but it is not easy to make these estimations due to the number of the influential factors. All those companies create different scenarios for their plans B, C and all the way to plan Z for sustainability of their companies.
Indubitably, there are a lot of parameters that affect the future energy systems such as the technological advancements, energy policies of influential governments, international relations and the international and regional agreements. This is the reason energy giants create different scenarios to be well prepared and set their strategies accordingly.
Figure 21 Population GDP and Energy Use
(DNV GL, 2017)
For the current situation, it is not possible to estimate how the technology will evolve. A new type of the energy source, or a renewable energy with better efficiency rates or more adaptable with the transmission systems could change the progress of energy production completely.
40
Energy policies of the governments is one of the most influential factors of the energy process. The strategies of governments, which will be explained in the later parts of the dissertation, can cause the MNEs to change their entire strategies. As the ROI is the determinant factor of investment, the investors can be easily directed in conjunction. Therefore, the level of the energy production or the type of the energy supply can transform with the energy policies of the governments.
International relations is also an important factor that is impossible to neglect. This is especially seen with the fossil fuels. Due to the limitations of the supply, some of the countries appear luckier than the others, as it is shown in figure 22 and figure 23. However, this unfair distribution of the fossil fuels makes the international relations one of the greatest factors that affects the future of the energy. This is the reason the countries that do not have the fossil fuel supply have started to search for an alternative way to break their dependency to the countries that do have the fossil fuel deposits.
41 Figure 22 Oil Proved Reserves 2015
(Ritchie & Roser, 2018)
42
(Ritchie & Roser, 2018)
Last but not least, the agreements between the countries are very significant for the future of the energy. Paris Climate Agreement is one of the well-known agreements that is regarded worldwide as it is indicated in figure 24. This agreement is critical not only for the future of the energy, but also for the future of our world to take control of the climate change. Net Zero Emission aim of the Paris Climate Agreement is a challenging goal and all the signatories started to take action accordingly without wasting time. Therefore, Paris Climate Agreement has made a great influence on the predictions of the future of the energy.
Figure 24 Countries That Joined the Paris Climate Agreement