THE REPUBLIC OF TURKEY
BAHCESEHIR UNIVERSITY
IR IMAGE EDGE DETECTION USING NEURAL
NETWORK AND CLUSTERING
Master’s Thesis
TALA MOHAMMADZADEH MEYMANDI
THE REPUBLIC OF TURKEY
BAHCESEHIR UNIVERSITY
GRADUATE SCHOOL OF NATURAL AND APPLIED
SCIENCES
COMPUTER ENGINEERING
IR IMAGE EDGE DETECTION USING NEURAL
NETWORK AND CLUSTERING
Master’s Thesis
TALA MOHAMMADZADEH MEYMANDI
Supervisor: ASSIST. PROF. TARKAN AYDIN
THE REPUBLIC OF TURKEY BAHCESEHIR UNIVERSITY
GRADUATE SCHOOL OF NATURAL AND APPLIED SCIENCES COMPUTER ENGINEERING
Name of the thesis: IR image edge detection using Neural Network and clustering Name/Last Name of the Student: Tala Mohammadzadeh Meymandi
Date of the Defense of Thesis: May.13.2018
The thesis has been approved by the Graduate School of Natural and Applied Sciences.
Assist. Prof. Yücel Batu SALMAN Graduate School Director
Signature
I certify that this thesis meets all the requirements as a thesis for the degree of Master of Science.
Assist. Prof. Tarkan AYDIN Program Coordinator
Signature
This is to certify that we have read this thesis and we find it fully adequate in scope, quality and content, as a thesis for the degree of Master of Science.
Examining Committee Members Signature _
Thesis Supervisor
Assist. Prof. Tarkan AYDIN --- Thesis Co-supervisor
Assist. Prof. Pınar SARISARAY BÖLUK ---
Member
iii
ACKNOWLEDGEMENTS
I wish to express my sincere gratitude to my Supervisor Asst. Prof. Dr. Tarkan Aydin for his advice, encouragement, guidance and continuous feedback throughout this thesis.
I would like to thank my family for their constant support throughout my life.
May, 2018 Tala Mohammadzadeh MEYMANDI
iv
ABSTRACT
IR IMAGE EDGE DETECTION USING NEURAL NETWORK AND CLUSTERING
Tala Mohammadzadeh Meymandi Computer Engineering
Thesis Supervisor: Assist. Prof. Tarkan Aydin
May 2018, 87 pages
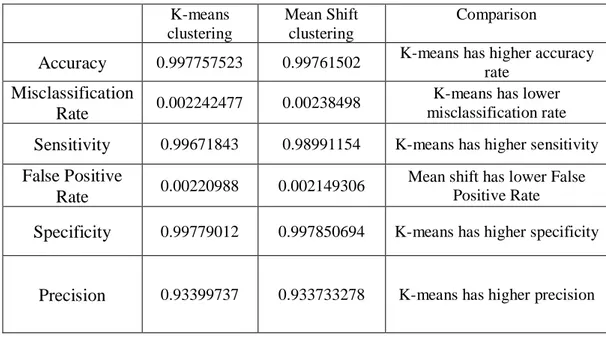
Nowadays image processing and feature extraction methods provide significantly important knowledge about images. The first step for identifying objects in an image is extracting the image properties. Edge detection is one the common features of image processing, because edges include useful information about an image. Although general public may not deal with Infrared images directly, this field is widely benefited in many sciences. Therefore, a proper infrared image edge detection method could result in thorough comprehension. In this study, infrared images are selected for edge detection due to their application in various technologies such as medical, military fields and surveillance purposes. According to the structure of these images, it is not possible to extract their edges using common methods. Therefore, a new method is proposed for edge detection of infrared images. In the proposed method, first the image is segmented by a clustering algorithm. Then, Neural Network algorithm is selected to extract the region of interest among the segmented clusters. In the last step, morphological operators are used to extract the edges from the Region of Interest. For segmentation, two K-means and Mean Shift clustering methods are applied separately, and their cluster features are used as the Neural Network inputs. Pursuant to the advantage of Mean Shift clustering algorithm in cluster number determination this method may be favorable in many cases. The evaluation results of the proposed method and comparison with other available methods indicate the method’s good performance for infrared image edge detection.
Keywords: Infrared images, K-means clustering, Mean Shift clustering, Neural Network,
v
ÖZET
KIZILÖTESİ GÖRÜNTÜDE SİNİR AĞI VE KÜMELEME İLE KENAR BELİRLEME
Tala Mohammadzadeh Meymandi
Bilgisayar Mühendisliği
Tez Danışmanı: Dr. Öğr. Üyesi Tarkan AYDIN
Mayıs 2018, 87 sayfa
Günümüzde görüntü işleme ve özellik çıkarma yöntemleri, görüntüler hakkında önemli bilgiler sağlamaktadır. Bir görüntüdeki nesneleri tanımlamak için ilk adım görüntü özelliklerini ayıklamaktır. Kenar belirleme, görüntü işlemenin ortak özelliklerinden biridir, çünkü kenarlar bir görüntü hakkında faydalı bilgiler içerir. Genel halk doğrudan Kızılötesi görüntülerle ilgilenmese de bu alan birçok bilimlerinde yaygın olarak kullanılmaktadır. Bu nedenle, uygun bir kenar belirleme metodu ile kızılötesi görüntüde, kapsamlı anlayış sonuçlanabilir. Bu çalışmada, kenar belirleme metodu kızılötesi görüntüler için seçilmiştir; çünkü bu görüntüler çeşitli teknolojilerde mesela medikal, askeri alanlar ve gözetim amaçları için uygulanmaktadır. Bu görüntülerin yapısına göre, kenarlarını ortak belirleme metotlarla mümkün değildir. Bu nedenle, kızılötesi görüntülerin kenar bulması için yeni bir yöntem önerilmiştir. Önerilen yöntemde, önce görüntü bir Kümeleme algoritması ile bölümlere ayrılır. Ardından, ayrılmış bölümler arasında ilgi bölgesi çıkarmak için Sinir Ağı algoritması seçilir. Son adımda, ilgi bölgesinde Morfolojik işletmeciler kenarları çıkarmak için kullanılır. K-Ortalamalar Kümeleme ve Ortalama Kaydırma yöntemleri ile görüntü bölünür ve kümelerin özellikleri Sinir Ağının girişleri olarak kullanılır. Küme sayısının belirlenmesi için Ortalama Kaydırma ile Kümeleme algoritmasının avantajına göre, bu yöntem birçok durumda uygun olabilir. Önerilen yöntemin değerlendirme sonuçlara göre ve diğer mevcut yöntemlerin karşılaştırmanın neticelere göre, yöntemin kızılötesi görüntü kenarı belirleme için iyi performansını göstermektedir.
Anahtar Kelimeler: Kızılötesi görüntüler, K-Ortalamalar Kümeleme, Ortalama
vi CONTENTS TABLES.......ix FIGURES.......x ABBREVIATIONS.......xii SYMBOLS...xiii 1. INTRODUCTION.......1 1.1 INTRODUCTION.......1 1.2 PROBLEM STATEMENT...2 1.3 THESIS OBJECTIVES....5
1.4 NEW ASPECTS AND RESEARCH INNOVATION.......5
1.5 THESIS STRUCTURE....5
2. LITERATURE REVIEW...7
2.1 INTRODUCTION...7
2.2 IMAGE PROCESSING...7
2.2.1 Image Processing Applications...8
2.2.2 Imaging...14
2.2.3 Pre-processing...14
2.2.4 Feature Extraction from Images.......16
2.3 THERMAL IMAGING...19
2.3.1 Thermal Imaging Components.....20
2.3.2 Different Generations of Thermal Cameras..............21
2.3.3 Effective Factors on Image Quality....22
2.3.4 Accuracy and Recognition Factors of Images...22
2.3.5 Main Effective Factors in Thermal Imaging...23
2.3.6 Selection of Wavelength Region for Thermal Cameras...24
2.3.7 Atmospheric Effects on Thermal Cameras’ Performance….24 2.4 IMAGE SEGMENTATION…....26
2.4.1 Clustering…....26
2.4.1.1 K-means clustering...27
2.4.1.2 Mean shift clustering.........27
vii
2.4.2 Classification.......29
2.4.2.1 Artificial neural network .......29
2.5 RESEARCH BACKGROUND...33
2.6 CONCLUSION.......34
3. DATA AND METHOD..........35
3.1 INTRODUCTION.......35
3.2 APPLIED TOOLS...35
3.3 OUTLINE OF THE THESIS.......36
3.4 PRE-PROCESSING...37
3.5 IMAGE SEGMENTATIONS...39
3.5.1 K-means Clustering...39
3.5.1.2 Optimal number of clusters.................42
3.5.2 Mean Shift Clustering.......43
3.6 ROI EXTRACTION...........47
3.6.1 Feature Extraction from The Image Regions.......47
3.6.2 Artificial Neural Network.......49
3.7 EDGE DETECTION...51
3.7.1 Post-Processing.............................53
3.7.2 Edge Detection Using Morphological Operators...55
3.8 CHAPTER SUMMARY.......56 4. FINDINGS...57 4.1 INTRODUCTION.......57 4.2 EVALUATION.......57 4.2.1 Dataset.......57 4.3 EVALUATION RESULT.......57 4.3.1 Evaluation Method.......58 4.3.1.2 Confusion matrix...69 4.3.1.3 Running time……...72 4.4 CONCLUSION..............73 5. DISCUSSION...74
5.1 COMPARING THE RESULTS WITH OTHER METHODS...74
viii
5.3 COMPARING BOTH CLUSTERING METHODS.....79
6. CONCLUSION.......86
6.1 INTRODUCTION.......86
6.2 THESIS RESULTS........86
6.3 PROPOSAL FOR FUTURE RESEARCH.......87
REFERENCES.......88
APPENDICES Appendix A.1 Running time.......94
ix
TABLES
Table 2.1: Pre-processing categories……….………..………....……….15
Table 2.2: Correspondence between ANN and BNN…………..………....………33
Table 3.1: Extracted Quantile …..………..………....……….45
Table 3.2: Extracted features for each region using K-means clustering…….………...48
Table 3.3: Extracted features for each region using Mean Shift clustering…..………....49
Table 3.4: Region labeling for training the NN (K-means clustering)……..……….….51
Table 3.5: Region labeling for training the NN (Mean Shift clustering)….…...…51
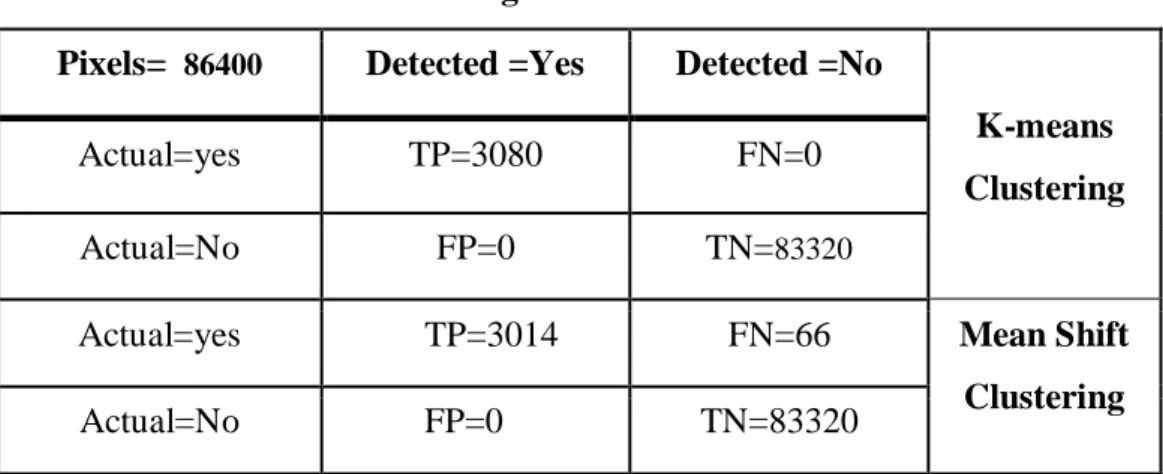
Table 4.1: Confusion matrix of Figure 4.1………..…………..………...70
Table 4.2: Confusion matrix of Figure 4.3………..………...70
Table 4.3: Total results of all 16 images…….……….….……….…………...70
x
FIGURES
Figure 1.1: Prewitt edge detection method...3
Figure 2.1: Motion tracking...9
Figure 2.2: Medical image Processing applications………....….………..…….…..9
Figure 2.3: Distinction of various tissues from each other………...…………..….10
Figure 2.4: Image processing application for ultrasound measurement………...……...10
Figure 2.5: Computer-assisted surgeries using image processing technique…..……....11
Figure 2.6: Intercept targets in military applications using image processing……....…12
Figure 2.7: Image processing in security systems……….………..…12
Figure 2.8: Image processing in geographic systems for identifying cover crops…..…13
Figure 2.9: Separation of the defective fruit surface by image processing….……...14
Figure 2.10: Feature extraction steps………….……….……….…………....16
Figure 2.11: Electromagnetic waves………..……….19
Figure 2.12: Object tracking for surveillance……….…….………28
Figure 2.13: Object tracking in a soccer game………..…..28
Figure 2.14: Structure of the humans’ brain………..…..30
Figure 2.15: Simple structure of the Neural Network………..…..…..…..…….32
Figure 3.1: General steps of the proposed method………...…..37
Figure 3.2: Median Filter………...………..………38
Figure 3.3: Applying Median filter…………...………….…...….……….39
Figure 3.4: Block diagram explaining the k-means clustering steps…………..……….40
Figure 3.5: Clusters extracted using k-means clustering ………....………..…..41
Figure 3.6: Elbow criterion………….……….………….…….……….………...43
Figure 3.7: Flat kernel………..……….……….…...44
Figure 3.8: Image density structure……….……….……….…..45
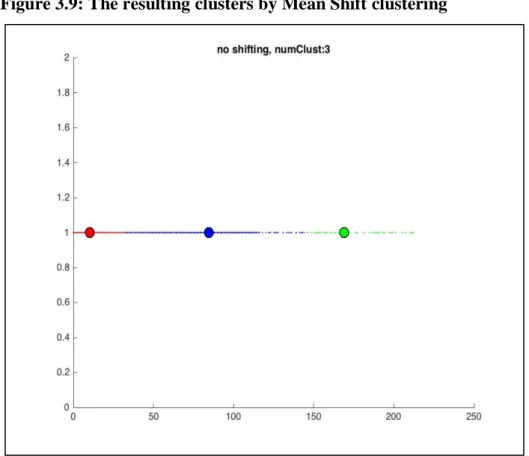
Figure 3.9: The resulting clusters by Mean Shift clustering…….………...…………...46
Figure 3.10: Clusters extracted using Mean Shift Clustering………...47
Figure 3.11: Expected object for edge detection in the IR image….…..…..…….…….48
Figure 3.12: Structure of Neural Network in this study …..………….……….….50
Figure 3.13: Pre-processing………...52
Figure 3.14: Clustering using both methods………..………..52
xi
Figure 3.16: Binary image after Erosion……….……….…...……...….54
Figure 3.17: Binary image after Dilation……….……….……….………..……...55
Figure 3.18: Detected edges.…… ………...……….……..……55
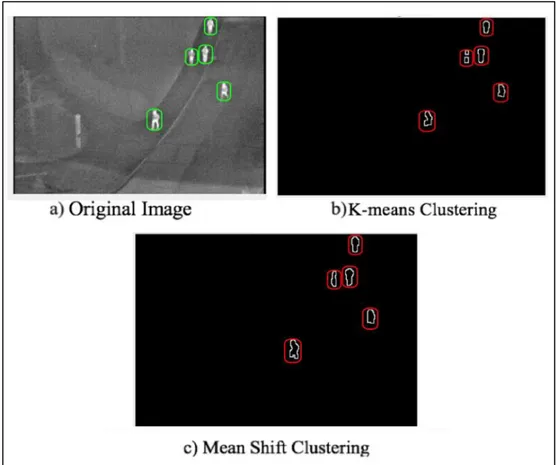
Figure 4.1: Detected edges (b,c) of image img_00003 (a) in folder 0002…….……...58
Figure 4.2: Detected edges (b,c) of image img_00014 (a) in the folder 0002…...….59
Figure 4.3: Detected edges (b,c) of image img_00028 (a) in the folder 0002….……....60
Figure 4.4: Detected edges (b,c) of image img_00001 (a) in the folder 0004...61
Figure 4.5: Detected edges (b,c) of image img_00009 (a) in the folder 0004...62
Figure 4.6: Detected edges (b,c) of image img_00018 (a) in the folder 0004………...63
Figure 4.7: Detected edges (b,c) of image img_00001 (a) in the folder 0006……….…63
Figure 4.8: Detected edges (b,c) of image img_00009 (a) in the folder 0006…..…...64
Figure 4.9: Detected edges (b,c) of image img_00018 (a) in the folder 0006……..…...65
Figure 4.10: Detected edges (b,c) of image img_00001 (a) in the folder 0007…...65
Figure 4.11: Detected edges (b,c) of image img_00011 (a) in the folder 0007…...66
Figure 4.12: Detected edges (b,c) of image img_00022 (a) in the folder 0007…...66
Figure 4.13: Detected edges (b,c) of image img_00001 (a) in the folder 0008……...67
Figure 4.14: Detected edges (b,c) of image img_00012 (a) in the folder 0008…..…...67
Figure 4.15: Detected edges (b,c) of image img_00024 (a) in the folder 0008…...68
Figure 4.16: Detected edges (b,c) of image img_00032(a) in the folder 0009……...….68
Figure 5.1: Comparison of proposed method with the common algorithms…….…...75
Figure 5.2: Comparison of proposed method with the common algorithms……...76
Figure 5.3: Comparison of proposed methods with CNN_DGA method…..…..…...…77
Figure 5.4: Comparison of proposed method with CNN_DGA method……...……...77
Figure 5.5: Comparison of the proposed method with Mix_model…………...….…..78
Figure 5.6: Comparison of the proposed method with Mix_model…………..…....…..79
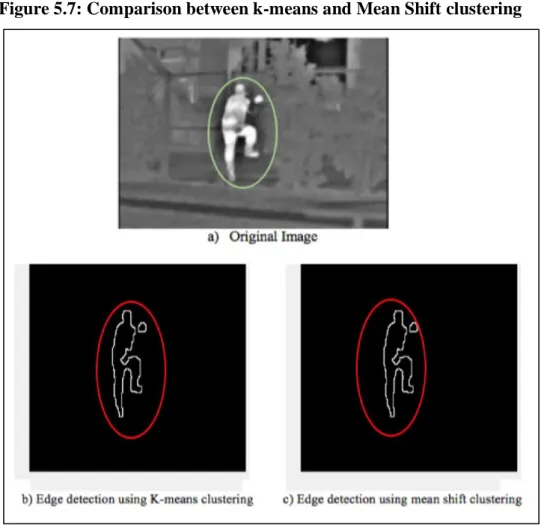
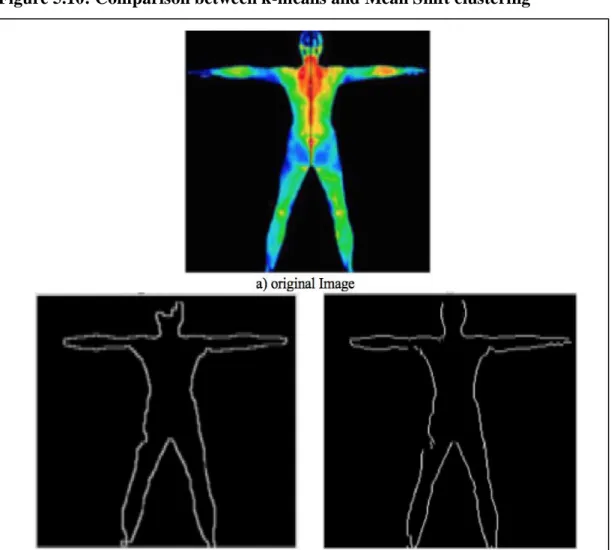
Figure 5.7: Comparison between k-means and Mean Shift clustering……...……...…..80
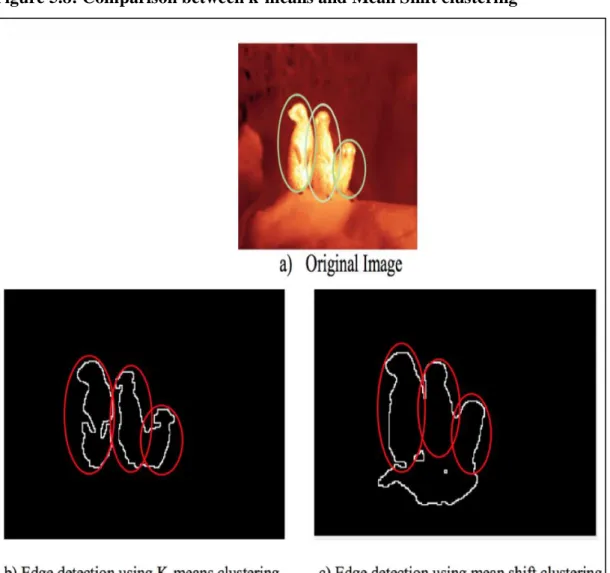
Figure 5.8: Comparison between k-means and Mean Shift clustering……...…...81
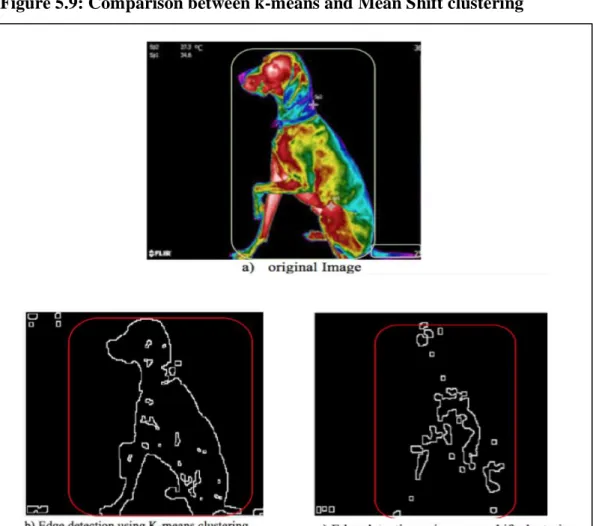
Figure 5.9: Comparison between k-means and Mean Shift clustering……..………..…82
Figure 5.10: Comparison between k-means and Mean Shift clustering………...83
Figure 5.11: Comparison between k-means and Mean Shift clustering………...…...84
Figure 5.12: Comparison between k-means and Mean Shift clustering………...…....85
xii
ABBREVIATIONS
ACO : Ant Colony Optimization ANN : Artificial Neural Network BNN : Biological Neural Network CCD : Charge-Coupled Device array CNN : Cellular Neural Networks DGA : Distributed Genetic Algorithms
FOV : Field of View
GPS : Global Positioning System
HgCdTe : Mercury Cadmium Telluride Detectors HSL : Hue Saturation Intensity
InSb : Indium Antimonite Semiconductors
IR : Infrared Radiation
KDE : Kernel Density Estimation MLP : Multilayer Perceptron
MRTD : Minimum Resolvable Temperature Difference NETD : Noise Equivalent Temperature Difference
NN : Neural Network
RGB : Red Green Blue
ROI : Region of Interest SSE : Standard Square Error USA : United States of America
xiii
SYMBOLS
Centigrade : C
Degree : °
Extracted Region from the image : 𝐼𝑛
micrometer : μm
millimeter : mm
1. INTRODUCTION
1.1 INTRODUCTION
The knowledge of image and photo is a great science. Nowadays, acquiring and analyzing images have a great impact on many different sciences. Because of this great influence various methods for image acquisition and processing methods are being developed. Each method has its own advantages and disadvantages and they’re being used in their own fields. It is important to consider that due to the variety of techniques available for image processing, in many cases applying a particular method is not enough. One of the basic utilization of image processing is edge detection. All image edges include useful information that could be very helpful for object detection. Infrared image is one of the most popular and vital image types in today's life. Infrared Radiation (IR) images are widely used in medical and military industries and also in surveillance applications. The temperature of human body is a great sign of humans’ well-being. Therefore, IR images could provide considerable information about health and therefore, Infrared imaging has a significant role in diagnosing many illnesses and disorders. Many warfare weapons and smart devices use this technology for capturing and identifying objects. Breast cancer, diabetes, kidney transplantation, dermatology, heart diseases, fever screening and brain imaging are some of the examples that indicate the success of using IR imaging. Accordingly, IR images are applied in many different technologies due to their characteristics and a lot of researchers are focused on this subject. In this study, a new method is proposed to study edge detection of infrared images which is one of the most important tasks about infrared images. For this purpose, image segmentation methods with machine learning tools are applied.
In the beginning of this chapter, problem statement and the initial definitions of the research tools are presented, then the research objectives are expressed. Finally, new aspects and research innovation are expressed.
2
1.2 PROBLEM STATEMENT
In recent years, (Wang et al. 2014; Lahiri et al. 2012) various methods have been proposed for image processing such as Cellular Neural Networks (CNN), genetic algorithms and wavelet transforms. One of the most important aspects of image processing is edge detection. Edge detection technology is used to extract edge features. Edge feature is one of the most basic features of the image and it could be used to display the image. Edge detection is a sensitive task for target tracking. Therefore, tracking objects in images and movies is one of the most significant tasks. There are various image types for processing and the type of image determines the operation that must be performed on them. In the next section, a brief explanation of the infrared images is given.
Infrared energy from all objects with a temperature above zero ° Kelvin (the absolute temperature or -273 ° Centigrade) is emitted. IR is a part of the electromagnetic spectrum with the frequency between the color spectrum and the radio waves. The IR wavelength in the electromagnetic spectrum is between 0.7 μm and 1000 μm (one millimeter). In this band the waves with the wavelengths between 0.7 micrometers and 20 μm are used for measuring the temperature. Cameras’ imaging sensors convert this energy to electrical signals which are displayed on monitor as a thermal monochromatic image. These images also show different values of heat (Duarte et al. 2014). Sir William Herschel (1800) discovered Infrared thermography. Sir But (1940s) invented the first infrared imaging system. Since 1960s Infrared imaging has been used in medical science. Over the past 20 years, there have been significant improvements in the quality of imaging equipment, the standardization of techniques and clinical imaging protocols (Duarte et al. 2014).
The following features could be noted as some of the IR features (Zhou et al. 2011) : a. Random changes of the external environment and thermal imaging systems’ flaws
could cause different infrared image noises such as thermal noise. The existence of these noises causes reduction of the signal quality.
b. The infrared image determines the temperature distribution in the image; this image is black and white (gray); it is not a color or three-dimensional image, so it has low resolution for the human eye.
3
c. Due to the structure of thermal images their imaging systems also have low recognizing ability of objects, hence its spatial precision is lower than the visible light in the Charge-Coupled Device array (CCD), which makes the infrared image resolution lower comparing with other image types.
Infrared image has many uses in medical sciences (Duarte et al. 2014) and military technologies (Abdulmunim et al. 2012, Sun 2003). Due to lower contrast and resolution of IR images comparing with color images, common image processing algorithms are not suitable. The most common edge detection algorithms are Prewitt, Canny, Sobel and Roberts edge detection algorithms which could not be applied (Wang et al. 2014). Because most of the common image edge detection methods work by extracting high frequency signals. As common operators are sensitive to noise it is difficult to distinguish between image noise and edges. Figure 1.1 shows the result of IR image edge detection using Prewitt edge detection method as a first order derivative filter.
Figure 1.1: Prewitt edge detection method
Therefore, other edge detection methods are required. One of these methods are based on machine learning algorithms and clustering methods. Clustering algorithms segments the images according to the images’ features. K-means and Mean Shift clustering are two popular clustering algorithms that are used in this study. In this approach each clustering method is applied separately with the machine learning algorithm due to their characteristics and their results are compared.
K-means algorithm is an unsupervised algorithm which clusters the pixels based on some similar features such as gray levels. In this method the number of clusters (k) is constant which should be defined initially by the user. Some random points are selected as centers of the clusters (centroids). This algorithm has a loop with two parts:
4
i. Assignment: Each point is assigned to the cluster with the closest centroid. ii. Computation: computing the centroids of all clusters in each loop.
The computation continues until convergence happens (Dhanachandra et al. 2015). For assigning and computing the clusters and their centroids many different distance measures are used. Mean Shift is a hierarchical non-parametric clustering algorithm, unlike k-means clustering method the algorithm itself figures out the number and the location of the clusters. The main concept of this algorithm is to find the densest region by computing the mean within a chosen bandwidth. In each iteration first, the points within the radius of the mean is calculated then the new mean is computed. These two steps are computed in a loop until convergence happens. In many cases this algorithm is preferable as it figures out the optimized number of clusters. Unlike k-means it doesn’t require to define the number of clusters. That is a great advantage, as in k-means with incorrect cluster number the algorithm doesn’t work properly (Cheng 1995).
After clustering the image, the Region of Interest (ROI) should be found and extracted using a proper method. for this purpose, proper machine learning algorithm could be implemented. In this study, ROI is extracted using Neural Network (NN) algorithm which is one of the common machine learning algorithms. The NN is inspired by the biological behavior of neural systems of the human’s brain. This network is a combination of a large number of connected processing elements (nerves). The NN is a combination of three layers (Gonzalez et al. 2008):
- Input layers -Hidden layers -Output layers
Some of the Neural Network’s advantages and disadvantages are listed as following (Gonzalez et al. 2008):
Advantages:
a. Widespread application in many different fields.
b. Very flexible because the user decides about its structure. c. Finds the complex relationship between inputs and outputs. Disadvantages:
a. It's hard to interpret, so it's difficult to explain it.
5
c. Need to be designed and preprocessed accurately with predictive variables.
In this study, in order to detect the edges both k-means and Mean Shift clustering algorithms are used for IR segmentation and Neural Network algorithm is used for ROI extraction.
1.3 THESIS OBJECTIVES
The main aim of this thesis is to provide a new method for the edge detection of IR images. In this thesis, the combinations of NN with two different clustering methods (k-means and Mean Shift clustering) are studied and a new method is provided that properly detects the edges of infrared images. The results of this research could be used in the medical industry, military, and in general wherever the infrared image is used.
1.4 NEW ASPECTS AND RESEARCH INNOVATION
Considering the earlier work, although extensive work was done on infrared image edge detection, there was no such proposed method for infrared image edge detection. On the other hand, given that both K-means and Mean Shift clustering methods have high results in image segmentation and Artificial Neural Networks (ANN) also functions as well, so the proposed method is expected to perform well.
1.5 THESIS STRUCTURE
The structure of this thesis is defined as following:
a.
In the first chapter, the generalities of the study, the expected objectives of the research and the aspects of innovation are discussed.b.
The second chapter explains a general overview of available methods in this field. It also explains the algorithms used in this thesis.c.
In the third chapter, the proposed method is described, and the tools used in this study are described in detail.d.
In the fourth chapter, the proposed method is evaluated.e.
In the fifth chapter, the proposed methods are compared with other methods, works and also with each other.6
7
2. LITERATURE REVIEW
2.1 INTRODUCTION
Digital images have a great role in today's life. Over recent decades, many industries and applications require special imaging techniques. Each of these special imaging techniques needs its own tools for processing while working with the tools requires understanding the concepts of image analysis. Infrared imaging is one of the imaging techniques that is not generally applicable, but its value is due to its application in many sensitive technologies. Unfortunately using the common visible and color imaging tools could not extract useful information by processing the infrared images. There are available methods for processing these images. One useful method is based on machine learning algorithm. Therefore, this study proposes a method to process infrared images which is based on machine learning algorithms.
In this chapter, first, concepts of infrared images with definitions of image processing techniques are presented. In the second part of this chapter, the image segmentation methods used for clustering part of this study are explained, then the classification algorithms necessary for extracting the ROI are described. Finally, part of the works done in this area is also introduced as the literature of this study.
2.2 IMAGE PROCESSING
There are two types of image processing: analog and digital image processing. Nowadays image processing is rather referred to digital image processing than analog part. In general, there are two types of images: analog images and digital images.
The digital image processing is a field of computer science working on digital images acquired by digital cameras or scanners. This field includes two branches: Image Enhancement and Computer Vision. A digital image is an input of the functions performed in digital image processing image and it’s usually a two-dimensional image. The output of the function depending on the purpose could be either an image or the extracted feature of the image. Image enhancement advantages the acquisition tools such as filters for eliminating the noises, better visualization and adjusted contrast within an image. On the other hand, computer vision includes the techniques for analyzing and manipulating an image for better perception of the structure and the content of an image.
8
The extracted characteristics could be benefited in different technologies such as Robotics (Gilbert et al. 2005; Gonzalez 2002).
There are three main tasks in the image processing: preprocessing, enhancement and displaying the image or the features of an image.
The main operations in digital image processing (Marques, 2011) : a. Geometric Transformations: such as resizing, rotation .
b. Arithmetic and Logic Operations: The arithmetic operations are used for different purposes such as extracting the differences between images or finding the mean of two images.
c. Color Enhancement: Brightness and contrast enhancement and adjustment of the color space.
d. Aliasing and Image Enhancement: The aim is to filter the signals with the frequencies above the sampling rate.
e. Compression: Compression techniques are used to decrease the size of an image. f. Image Segmentation: Segmenting the image into meaningful parts.
2.2.1 Image Processing Applications
Image processing methods have been applied in many different sciences such as industry, medical fields, security and surveillance monitoring. Some of the applications are mentioned in this section briefly (Iscan et al. 2009):
Pattern Recognition: The goal is to identify and extract a pattern with specified features
and categorize the data. Identification of letters or numbers of a text or a license plate are some of the common examples about utilization of pattern recognition (Bhanu, 2005).
Motion Tracking: There are various ways to track a moving object in a video sequence.
One of the common methods is the correlation function in two consecutive frames. In the first frame one or more points with a window around them are selected. While a search window in the second frame is determined. By selecting the windows’ correlation around each point and the correct determination of the search window in the next frame, the window’s correlation around each point in the next frame could be calculated and the location of the maximum correlation could be defined as the new pixel location.
9
Figure 2.1: Motion tracking
Medical Applications: Image processing knowledge is applied in many different
medical fields (Garge et al. 2009; Iscan et al. 2009). Some of the common medical applications are listed below:
a. Quality Enhancement of Thermal Images: Figure 2.2 indicates this process.
Figure 2.2: Medical image Processing applications
Source: Jambhorka, Sagar et al., 2012 p.310
b. Separating the distinctive tissues from each other: Due to distinct characteristics of different tissues such as permeability the distinction of different tissues is possible with image segmentation techniques. By the use of image processing technique, the
10
identification of cancerous tissues and locating the exact place of brain tumors are practical (Iscan et al. 2009).
Figure 2.3: Distinction of various tissues from each other
Source: Iscan Zafer et al 2009 p. 897
c. Measurements of Sonographic Images: Image Processing is used to calculate the distance and surface values of ultrasound Images.
Figure 2.4: Image processing application for ultrasound measurement
11
d. Computer-assisted Surgeries: By using computers as surgeons’ assistants two/three dimensional models of tissues or organs are obtained and surgeons could be guided throughout operations.
Figure 2.5: Computer-assisted surgeries using image processing technique
Source: http://www.futuretechnology500.com/index.php/future-medical-technology/ robotic-surgery-advantages-and-disadvantages/
Military Applications: Currently, many military systems are equipped with cameras and
image processing techniques. Some common utilizations of this knowledge are explained below (Wang et al. 2014; Dimitris et al. 2003):
Long range precision missiles apply image processing techniques with the use of GPS (Global Positioning System) data. Systems that lock on the target with predetermined specifications (aircraft, tanks, ...). Unmanned aerial vehicles driven by image processing techniques are used for missile shooting and launching purposes.
12
Figure 2.6: Intercept targets in military applications using image processing
Industrial Applications: Image processing knowledge is applied rapidly over the past
few years in this field:
a. Control and guidance of the manipulators b. Separation of chemicals with different colors c. Measurement of leather surfaces
d. Quality control of the factory products
Identification and security systems: Fingerprint recognition, face recognition and iris
recognition are some of the common image processing applications (Kambli et al.2010).
Figure 2.7: Image processing in security systems
13
Remote Sensing Systems: Image Processing methods are benefited to extract meaningful
information from satellite images. The separation of different graphical zones (sea, land, farms, mountains) are some of the related instances (Blaschke 2010).
Figure 2.8: Image processing in geographic systems for identifying cover crops
Source: Blaschke, T. p.8
Agricultural Image Processing Applications: The food industry is one of the important
industries that mainly use machine learning algorithms: a. Classification of the agricultural products b. Separation of the defective agricultural products c. Packaging the agricultural products
d. Identification of plant pests e. Calculating the agricultural crops
14
Figure 2.9: Separation of the defective fruit surface by image processing
Source: Dubey, et al. p.8
The main steps for defective surface detection of a fruit are: a) Imaging
b) Feature extraction (Image Processing)
c) The extracted features are applied in proper algorithms
2.2.2 Imaging
According to the variety of image processing applications, the proper imaging technique relevant to the utilized application is required:
Imaging Methods:
a) Imaging with conventional cameras (Morcol et al.2010) b) Satellite imaging (Blaschke 2010)
c) Imaging using sound waves (Iscan et al. 2009) d) Imaging using X-rays (Garge et al. 2009)
e) Imaging with infrared cameras (Wang et al. 2011)
2.2.3 Pre-processing
The raw images obtained from the imaging device have many problems. The imperfection of the imaging devices is the reason for the errors and low quality of the images. Pre-processing consists of four general methods. By the use of Pre-Pre-processing methods, the
15
visibility of the image is enhanced. Any pre-processing operation requires information about the image, camera and also the surrounding environment (Gonzalez et al. 2002). The Image preprocessing methods classified in different categories are described in the Table 2.1:
Table 2.1: Pre-processing categories
Type Description
Brightness The enhancement of the pixel brightness
Local Binary Considering small neighborhood around an image
Geometric The aim is to correct the geometric falsification due to various coordinates
Global Binary Using overall information of the whole image
a. Brightness: This amendment includes the grayscale and the pixel intensity. b. Geometric Transformation: In general, there are two types of Geometric
transformation: One is relevant to the system such as camera angle, while the others are related to random noises and could be related to the sensors.
c. Local/Global pre-processing: Local pre-processing is due to the processes done on each pixel with its neighborhood pixels. But Global pre-processing requires data of the entire image.
There are other pre-processing categories for image pre-processing. One category includes two types of Geometric and Radiometric transformations. The radiometric transformation refers to the type of transformation in which the main target is the elimination of atmospheric and sensor noises. Image Enhancement is also considered as one type of the image pre-processing methods. In general, there are two types of Image Enhancement: Spatial and Spectral. Spatial Enhancement is Filtering, and Spectral Enhancement is Stretching. Noise removal itself is also a separate category.
Preprocessing procedures:
a. Data Cleaning: The purpose of this section is to eliminate the existing noise and removing the existing conflicts between the data.
b. Data Reduction: Because of the use of different databases, additional and sometimes duplicate information may be created among the data. By using correlation and clustering algorithms this redundancy could be removed.
16
c. Data Transformation: The range of the attributes may not be the same. For example, the value of one attribute may be between one to ten while the other one could be between one to one thousand. Therefore, the normalization is required.
2.2.4 Feature Extraction from Images
The most important image processing task is the extraction of the proper features for each application. The steps of working on the image are as follows:
Figure 2.10: Feature extraction steps
Source: Seema, et al, p.50
After imaging step, the image is sent to the preprocessor to remove unwanted data and noise from the images. The purpose of extracting attributes is to reduce image data by using certain properties such as color, texture, or shape. Some of the shape properties include coexistence matrix, fast Fourier transform, and rapid wavelet transformation for fruit recognition. Some of the color properties includes mean, variance, skewness and elongation. Textural features are entropy, energy, contrast, and correlation (Mohammad et al. 2016). These Features are introduced briefly:
a. Edge-based features: In this method, the map and plot of the image edges
determine the objects’ features. The advantage of using edges is the steadiness. Using the edges as features has advantages over other features. The edges have steady features
17
and they are resistant to light conditions, color changes of objects and outer texture of objects. Their changes do not affect the edges as well. Edges also define the boundaries well. Therefore, feature extraction is done with a great precision especially in crowded backgrounds with many objects. Among numerous edge detection algorithms Canny, Sobel, Roberts are the popular algorithms (Seena et al. 2015).
b. Morphological features: Morphological features play a great role in
classification purposes. The analysis of the morphological features starts with fruit range detection. there are a lot of morphological features for extraction. Fruit border as a morphological feature is connected to the fruit dimensions (Seema et. al 2015). The features are categorized into two main groups. The first groups’ components are round fruits such as orange and apples, while the other one consists of banana and carrot. Area is one of the morphological features. the area is calculated by the following formula:
𝐴𝑟𝑒𝑎 = ∑ ∑𝑘 𝑓(𝑖, 𝑗) 𝑗=1 𝑚
𝑖=1 (2.1) k is the number of columns, m is the number of rows and the f function is calculated by this formula (Mercol et al. 2008):
𝑓(𝑖, 𝑗) = { 1 𝑖𝑓 (𝑖, 𝑗) ∈ 𝐼𝑛
0 𝑜. 𝑤 (2.2)
c. Morphological Image Processing (Morphology): The aim of applying
morphology is to reduce the flaws of an image by the use of shape features (Seema et. al 2015). These algorithms process the binary images. There is a structural element moved across all the image pixels. Generally, there are two types of operations that will affect the resulting image:
i. Erosion: The erosion function is described by simple formula if the structural element could fit the image or pixels, the output value is 1 otherwise it’s zero.
𝑔(𝑥) = { 1 𝑖𝑓 𝑠𝑡𝑟𝑢𝑐𝑡𝑢𝑟𝑎𝑙 𝑒𝑙𝑒𝑚𝑒𝑛𝑡 𝑓𝑖𝑡𝑠 𝑡ℎ𝑒 𝑖𝑚𝑎𝑔𝑒
0 𝑒𝑙𝑠𝑒 (2.3)
ii. Dilation: The dilation function is described by simple formula if the structural element could hit the image or pixels, the output value is 1 otherwise it’s zero.
18
𝑔(𝑥) = { 1 𝑖𝑓 𝑠𝑡𝑟𝑢𝑐𝑡𝑢𝑟𝑎𝑙 𝑒𝑙𝑒𝑚𝑒𝑛𝑡 ℎ𝑖𝑡𝑠 𝑡ℎ𝑒 𝑖𝑚𝑎𝑔𝑒
0 𝑒𝑙𝑠𝑒 (2.4)
d. Color-based features: color is one of the basic features that human eye uses to
distinguish the objects from each other. Morphological features may cause misinterpretation according to the similarity between the fruits in the same group. The similarity between banana and carrot is an instance. Therefore, color models such as Hue Saturation Intensity (HSL), Red Green Blue (RGB) could be used to separate these objects (Seema et. al 2015).
e. Textural features: These features are extracted according to statistical concepts.
The main applied matrices are gray level and co-occurrence matrix. In this method the neighboring points with the equal gray level are compared throughout the image. (Mercol et al. 2008)
Statistical concepts:
i. Contrast: The contrast of an image (often known as variance) calculates the contrast level between any point (pixel) and its neighbors. The occurrence matrix is used for calculation.
ii. Correlation: It calculates the relation between a pixel and its neighbors.
iii. Energy: often known as "uniformity", "energy uniformity" or "second order torque", which is the sum of the squared related components in co-occurrence matrix. iv. Homogeneity: This value indicates the closeness level of matrix components to the
original diameter.
v. Skewness: It measures the asymmetry level around the mean and it’s standardized according to third torque. The zero value expresses symmetry (non-skidding), the positive value shows that the skewness is to the right and if the value is negative, the skewness is to the left.
vi. Kurtosis: It measures the distance of the data from the normal distribution, and its value equals to the fourth-order central torque of a distribution. The value of normal distribution is equal to three. If the Kurtosis is greater than three, it means that the distribution is smooth and if it’s less than three, the distribution is inverse.
19
2.3 THERMAL IMAGING
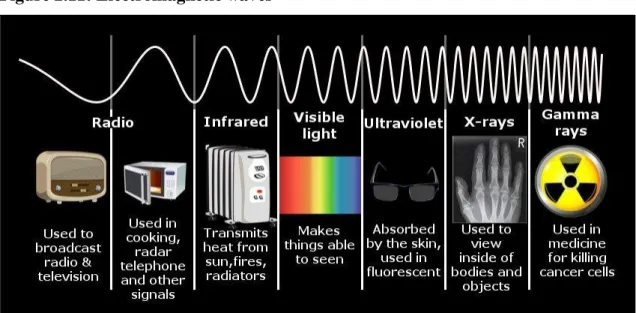
The temperature of the human body is a great source of a persons’ health. Because first of all the human body has a specific temperature different than its surrounding environment. There are two temperatures related to the body: the inner body (core) temperature and the outer body temperature. The alteration of the body temperature (33-42 °C) is an obvious sign of an abnormality. Thermal systems are applied for the purpose of creating and improving the operational capabilities of military forces in night combat. It is also applied for detecting and tracking goals that are visually hidden and camouflage. Thermal imaging systems are part of the passive systems that operate in the mid-infrared region of the electromagnetic spectrum. All objects emit electromagnetic wave which is directly related to their temperature (Pasagic et al. 2008). Infrared wave is an electromagnetic wave with the wavelength between 700 nm and 1mm. This radiation is between microwave and visible light. According to the Plank law any object with the temperature above absolute zero (-273 °C) emits energy that could be recorded by thermal cameras as a black and white image (Pasagic et al. 2008).
Figure 2.11: Electromagnetic waves
Source: https://www.scienceabc.com/pure-sciences/why-are-infrared-waves-associated-with-heat.html
Thermal imaging systems are divided into two kinds of cooled and uncooled cameras. Cooled thermal cameras have higher temperature resolution and higher temperature sensitivity so the images have better quality than non-cooler cameras and they have higher prices. The uncooled camera sensors are working at the room temperature while the
20
temperature of the cooled thermal camera sensors is decreased to cryogenic temperature (-32 degrees F) (Pasagic et al. 2008). The reason for high resolution is because of this low temperature of the working unit. Working at low degree in small dimensions need high quality. In general, thermal cameras require some time to adjust the sensors’ temperature. The amount of required time depends on the environment temperature. The thermal images could be obtained during the day and night. As the earth’s temperature is stabilized throughout a night, the distinction between the object are better at earliest dawn. Spain and United States of America (USA) are the first countries that used these systems at World War two.
2.3.1 Thermal Imaging Components
a. Composite thermal system: This unit is responsible for collecting thermal radiation of the object, focusing it at a point, and creating a thermal image. Thermal cameras, like the night vision cameras, consist of several lenses and mirrors, but their structures are different. In these cameras, materials transparent to infrared radiation (such as germanium and silicon) are used (Pasagic et al. 2008).
b. Detectors: Detector is an element that absorbs infrared radiation collected by a set of objects that changes one of its electrical properties (electrical conductivity, resistivity or volte formation) by absorbing this radiation, and this alteration causes the creation of an electrical signal. After transforming the infrared photon into electrical signals, these signals are amplified and processed by the camera's electronic component, then by the means of devices such as light emitting diodes, liquid crystal diodes or micro-monitors the signals are converted into photons with the visible light wavelength. Each detector element can only transform one point of the object into a visible image. Therefore, in order to obtain a two-dimensional high-quality image, the dimensions of these numerous elements and the distances between them must be very small. Because of these tiny element structures, it is very difficult to construct detectors and they’re often produced as linear arrays instead of two-dimensional arrays. A linear array can only represent a line of the target thus a scanner is used to have a two-dimensional image. Detectors are divided into two groups of thermal and photonic or quantic detectors according to the electrical signal production method. So far, most military thermal imaging systems have used Mercury Cadmium Telluride Detectors (HgCdTe) (8-12 mm) for hot and dry area detection and Indium Antimonite
21
Semiconductors (InSb) (3.0-3.5 mm) for the detection of moist regions such as beaches and seas. Although cooled thermal cameras have great efficiency, due to their high price, size and weight these technologies are preferably replaced by uncooled cameras with the same function (Pasagic et al. 2008).
c. Scanners: In some thermal imaging systems, there is a scanner whose task is to transfer the target plate information to the detector. In fact, the scanner transfers different points of data in time and line-by-line to the detector.
d. Electrical circuits: The circuits include power supplies, biases, amplifiers, processors and displays.
e. Opto-mechanical (eyepiece) system: The eyepiece system enables the observer to see the image.
2.3.2 Different Generations of Thermal Cameras
Generation zero (Woolfson, 2012): A thermal camera built with a single-element detector or a linear array with a small number of elements, is called the zero generation. In this system, two horizontal and one vertical scanners are required.
First generation: If a thermoset camera is built with a very long linear array, it's called the first generation (Woolfson, 2012): In this system, only a horizontal scanner is needed, that is the reason for manufacturing most of the black and white cameras using this technology.
Second generation (Woolfson, 2012): It includes cameras with a long-term, multi-linear array. In this system, only a horizontal scanner is required. The image of these cameras is not significantly different from generation one.
Third generation (Woolfson, 2012): It refers to a camera with a two-dimensional array of detectors with a high number of elements. This system no longer needs a scanner. This generation is the latest generation of thermal cameras that are fully developed in military systems and used in large industrial countries. The distinctive image of this generation of cameras and the ability of separating the element colors from each other have distinguished them from their previous generations.
22
2.3.3 Effective Factors on Image Quality
Factors such as noise (system noise, background, etc.), atmospheric environments, system technical specifications, distance, dimensions, etc., cause restrictions on the operation of the camera and therefore selection and design are more complicated (Woolfson, 2012). In general, some of the main factors that affect the quality of the image can be
summarized as follows (Woolfson, 2012):
a. Monitor: The factors that affect the monitor are related to the radiation, contrast and distance from observer.
b. Page Elements: factors such as target specifications, background specifications, movements and reflections.
c. Specifications of the thermal image system: factors such as the resolution, sensitivity, noise and output of the camera.
d. Atmosphere Transmission Factor: factors such as haze, rain and dust.
e. It should be noted that in the discussion of picture quality, much of the research is done on two issues of spatial resolution and temperature sensitivity.
2.3.4 Accuracy and Recognition Factors of Images
The level of utilization of images depends on the image quality and the ability to obtain information from it. For the image and its information, four precision or diagnostic steps are defined, which are (Pasagic et al. 2008):
a. Detection: Sensation or detection of an object that may be a target. (Usually observing the object as a spot)
b. Orientation: Detects the overall dimensions of the system. (Latitude and Width Detection)
c. Recognition: The diagnosis of the target category and the ability to determine the group of objects. For example, showing that the object is an airplane or a helicopter. d. Identification: Identification and distinguishing the target among the objects
belonging to its group. (the type of the object’s aircraft).
In fact, from the first to the fourth step, the number of pixels increases, and the image quality will improve.
23
2.3.5 Main Effective Factors in Thermal Imaging
As mentioned, thermal imaging systems have different generations, and each generation has its own features that are used in the design of cameras. Some characteristics are also common in system performance and the result is important for the user.
The most important features of thermal cameras are (Woolfson, 2012):
a. MRTD (Minimum Resolvable Temperature Difference): The thermal imaging
system response depends on the sensitivity and spatial resolution. In order to assess the image quality in terms of sensitivity, resolution, dependency and interaction between them, a feature called MRTD is defined. That is the lowest target black body temperature difference from the background which could be measured by the system. The MRTD is limited to the sensitivity of the system, which means when the temperature difference is less than a minimum value, the object cannot be detected. In plain language, the MRTD is a camera feature that determines at least which sensitivity (or temperature difference) is required at any frequency (Rayleigh Criterion).
b. Resolution: In many cases, spatial resolution is considered to be the only
determining factor of the image quality. In fact, spatial resolution is the system’s smallest receivable part. The resolution is sometimes expressed by the instantaneous eyesight. The interpretation of resolution power depends on the type of application. On the other hand, spatial resolution includes the effects of the system's target and noise contrast. By the way, there is a clear difference between spatial resolution (ability to see detail) and the ability to see anything (detect).
c. Sensitivity: Sensitivity is the smallest signal that can be detected by the system, or
in other words, a signal that produces a signal-to-noise ratio at the output of the system. The sensitivity depends on the ability to capture the optics and detectors’ ability of noise detection, and it’s independent of resolution.
d. Field of View (FOV): The maximum angular field (horizontally and vertically) in
any functional position visible on the display is called the field of view. The choice of field of view usually depends on the type of application, technology, detector and scanner properties.
e. Instantaneous FOV: This property is the angular component that let the systems
24
results in better receiving, as long as it could provide enough energy for detection. The larger field of view causes the larger Instantaneous field of view, and this decreases the resolution of the system.
f. Noise Equivalent Temperature Difference) NETD): This feature indicates the
temperature sensitivity of the system and it’s the least variation between body temperature and background, which produces noise in the output signal. This attribute depends on the detector's specification, the optical-atmospheric transmittance, and the noise of the system.
g. F-Number: The focal number is the ratio of the focal length to the diameter of the
lens in an image forming system. In fact, the focal number expresses how much light is collected by the speed of a lens.
h. T-number: A T-number expresses the speed of a lens, assuming that the lens
transmits all the light emitted from the subject. In fact, various lenses have different T-numbers. Lenses with the same focal numbers may actually have different speeds. For two lenses with the same T-number, the resulting images are the same with equal brightness.
2.3.6 Selection of Wavelength Region for Thermal Cameras
According to the level of object’s emitted radiation at normal temperatures and atmospheric constraints, only two regions (3-5 μm) and (8-12 μm) can be used for passive photography. If targets are hotter than the intended environment (such as the exhaust of the missile), since the maximum wavelengths of these targets are shorter and the radiation power in that area is high, it is better to use a camera with a wavelength of three to five Micrometer. In general, without taking into account the specific application, one cannot make a region superior to another. Of course, the wavelength range of eight to twelve microns is a fine range (Woolfson, 2012).
2.3.7 Atmospheric Effects on Thermal Cameras’ Performance
To see objects on the surface of the earth, the electromagnetic waves emitted from the surface of the object pass through the air and reach the camera. Since air is a mixture of different gases, water vapor and particulates, it absorbs and also spreads some of these waves depending on the wavelength. Considering different conditions, such as the amount of gas, wind, temperature and other atmospheric conditions during the emission
25
pathway, the assessment of these effects is complicated. The amount of contrast (sharpness) of the object or background is the factor that affects the visibility of objects. The atmospheric conditions reduce the contrast according to the distance from the viewing point. The atmosphere imposes important constraints on the performance of electro-optical systems. In fact, the environment could be considered as one of the most important components of an optical system. Today, due to the fact that the quality and capabilities of detection systems and radiation sources (such as lasers) have enhanced significantly, the most important limitation on system performance is usually the atmospheric environment (Woolfson, 2012).
Most of the atmospheric disturbances that affect the radiation transmission and performance of the thermal imaging system are:
a. Slippage of radiation (absorption, dispersion) that has the greatest effect and limits the range of systems.
b. Radiation of the environment and the infrared region c. The deviation of the actual target location
d. Radiating Modulation
The atmospheric passage rate is not the same for all wavelengths, and the objects at ambient temperature with only a perceptible spontaneous radiation in two regions (3-5 and 8-12 microns), are not absorbed by atmospheric influences and are suitable for thermal imaging. As infrared radiation is less absorbed than visible light in the presence of mist and smoke of the Earth's atmosphere, therefore these cameras can be used in adverse weather conditions.
Thermal cameras have different applications in industrial, military and nonmilitary cases, the most important applications of which are:
a. Observations and operations at night b. Guided missiles
c. Intelligent and identification operations d. Helping the planes for landing and taking off
e. Photography during Nighttime and adverse weather conditions f. Photographing of camouflage and hidden objects
26
It should be noted that all unmanned aerial reconnaissance aircraft flyable at night-time and any type of weather conditions are equipped with thermal cameras for identification purposes. This system is critical for identifying enemy forces in the battlefield during operations such as displacement, expansion, division, camouflage, hiding and so on. Advantages of thermal cameras instead of night vision cameras
a. Ability to create a picture at night and day
b. Online image transformation to the receiving data stations. (The image is visible both by eye and the image simultaneously is sent to an external monitor).
c. Failure to reveal by night vision systems: Some night vision cameras require a source of help for the purpose of seeing the target (Active System), which can be seen by night vision systems. But the thermal camera does not need an external source and it observes objects’ own radiation.
d. Thermal cameras do not require light for their functions, therefore even placement of a 18,000-watt projector in front of the desirable object doesn’t alter the output image(Pasagic et al. 2008).
2.4 IMAGE SEGMENTATION
Image segmentation has a great value in image processing field. Because Segmenting an image into some meaningful components help interpretation. The segmentation methods that are applied in this study are as follows:
a. Clustering b. Classification
2.4.1 Clustering
Clustering algorithms are unsupervised learning system in which data is not labeled. In this type of clustering algorithms data is clustered in a way that objects in each group are similar together while they are different from the objects of other groups. The similarity between the clusters’ objects is obtained according to the extracted features. There are many different clustering algorithms but according to this study two applied clustering methods are briefly explained here:
27
2.4.1.1 K-means clustering
In this clustering method data objects are gathered according to k which is the predefined number of clusters and also the selected initial centroids. The algorithm consists of two iterations and it continues until convergence happens. Data objects are clustered according to the initial centroids. The new centroid is then calculated for each cluster this loop continues unit convergence happens which means the centroid doesn’t move. The most important problem of this algorithm is the number of clusters which should be defined in advance that has a great impact on the performance of the algorithm and it could highly affect the results. The other disadvantage of this algorithm is due to the impact of centroid selection which also could affect the algorithm because sparse centroids could cause unwanted results (Mohammad et al 2016).
2.4.1.2 Mean shift clustering
Mean Shift is a hierarchical non-parametric clustering algorithm, unlike k-means
clustering method the algorithm itself figures out the number and the location of the clusters. The important factor of algorithm that should be determined is the radius around the data point and sometimes also referred as bandwidth. Radius is defined around each data point determining the bandwidth in which the points of that cluster is located. In the second step the mean of these data points is calculated as new cluster center and with this new point a new cluster is considered. The process continues until the mean doesn’t change, which means the mean is optimized and converged. In Mean Shift clustering although all points were started as one clusters by continuing the algorithm the mean of the cluster shifts that means the cluster center moves to the point of convergence (Comaniciuet al. 2002).
2.4.1.2.1 Mean shift applications
Mean Shift algorithm is highly applied in discontinuity preserving smoothing segmentation and object tracking, this is very useful in different fields such as military, industry, sports and surveillance cameras. For example, the object could be tracked as moving in by the missiles.
28
Figure 2.12: Object tracking for surveillance
Source: Comaniciu, D., et. al. 2003. p. 578
The other application is tracking the players in the sport field. In the Figure 2.13 the green and blue rectangle indicate the movement of the player in different directions. The Mean Shift is done for all the frames and the centroid is computed (Comaniciu et al. 2003).
Figure 2.13: Object tracking in a soccer game
29
2.4.2 Classification
Classifications are supervised learning algorithms in which data is labeled. Once the
proper image features are extracted, the gathered features should be classified in a proper order, so that any instance of the problem space could be placed in the correct group. This step involves methods for matching each of the patterns derived from the feature extraction stage with one of the problem space classes. Number of attributes must be minimized according to relativeness between each input feature vector to one of the reference vectors. The reference vectors are the training dataset variables which are extracted previously from some training samples. Neural Network is one of the most common classification algorithms. The point is that these structures are not necessarily separable and sometimes are used as a combined concept (Sinngh 2011). ANN algorithm is explained below:
2.4.2.1 Artificial neural network
In general, ANN solve complex problems by using the human brain function method. Common computational methods use the same algorithm. They follow a set of preset commands to solve problems. The processing ability of conventional computers are restricted to define and solve problems, but neural networks are able to find patterns in information that no one ever knew about their existence (Sinngh 2011).
Neural networks have opened up a new and distinct answer to the problems instead of common methods. Common computational methods follow an algorithm. The algorithms are a set of preset commands used to solve problems except in special cases where the computer needs a series of information, and this limits the processing ability of ordinary computers to the solved problems. These algorithms are beneficial for processing the large number of instances and they increase the analyzing rate. The ANN is used to analyze the problem and find the best possible solution for any unsolved situation. Neural networks and common computational methods are not in competition, but they complete each other. There are tasks that are more suitable for algorithmic methods and there are tasks that are more suitable for neural networks. Furthermore, there are issues requiring a system that is obtained by combining both methods with high precision (Sinngh 2011).
30
Artificial Neural Networks provide a different method for processing and analyzing information. But it should not be inferred that neural networks can be used to solve all computational problems. Common computational methods continue to be the best option for solving specific groups of issues such as accounting, warehousing, and so on. Neural Networks are moving in the direction that the tools have the ability to learn and plan. Neural Network structures are capable of solving problems without the help of an expert and external planning. In fact, the Neural Network is able to find patterns in the information that no one ever knew about it.
Since ANNs are developed based on the human brain, their structure which is a bio-network is explained:
Neuron: Neuron is the humans’ brain cell which is defined as the main structural element of the brain. In Figure 2.14, a simplified representation of the structure of a neuron is shown. A bio-neuron, after receiving the input signals (in the form of an electrical pulse) from other cells, combines these signals together and, after performing another operation on a hybrid signal, the output appears (Sinngh 2011).
Figure 2.14: Structure of the humans’ brain
Source: https://online.science.psu.edu/bisc004_activewd001/node/1907
As shown in Figure 2.14, the neurons are made up of four main parts: Dendrites, Soma (Cell Body), Axon and Synapse (Nerve Ending). Dendrites are the same components that are scattered around longitudinal fibers from the center of the cell. Dendrites play the role of communication channels for transmitting electrical signals to the cell center. At the end of the dendrites, there is a special biological structure called synapse, which plays the role of connecting gateways for communication channels. In fact, various signals are