STOCK MARKET TECHNICAL INDICATOR OPTIMIZATION BY GENETIC ALGORITHMS
Ahmet Murat Ozbayoglu Umur Erkut
[email protected] [email protected]
TOBB University of Economics and TOBB University of Economics and
Technology Technology
Department of Computer Engineering Department of Computer Engineering
Ankara, Turkey Ankara, Turkey
Abstract
Technical indicators are widely used in stock market forecasting, mostly to trigger the buy/sell rules in the technical analysis. Through some statistical analysis some key values for several indicator parameters are obtained. These values are generally adjusted to provide simple, round numbers, so they become part of easy-to-remember rules, such as 70-30 RSI rule, Crossover 50MA, etc. However, since these selections of indicator values are used as rule-of-thumb buy-sell triggers, it is not clear how changing market conditions affect them. For example, one indicator might provide good results for a particular stock in an uptrend market, but might fail miserably during downtrend. In this study, the performances of several different Exchange Traded Funds (ETFs) are analyzed using different technical indicators between the years 1993-2008. The indicator parameters are optimized against portfolio performance using genetic algorithms. Different analyses are implemented in different market conditions (uptrend or downtrend), using a basket of ETFs and different technical indicators. The trained indicators were tested between the years 2008-2010. The results indicate that even though the test performance is not as high as the training performance, the results are generally acceptable. Also, surprisingly, for several ETFs, the widely-used indicators, a lot of times, perform poorly indicating even though they are well-known and widely-implemented strategies; they should not be used blindly for any ETF or stock.
1. Introduction
Stock market forecasting estimates the future value of a company’s stock with the analysis of stock’s historical data. Buying/selling the stock in right time and buying/selling the right stock are two main problems that the forecasters have. Due to the complexity of the forecasting process, a decision support system (which is the technical analysis) has been widely used by investors and traders.
Technical analysis is a method of forecasting the future direction of prices by analyzing statistics generated by market activity, such as past prices and volume [1]. For technical analysts, the future performance of a stock is predictable by the statistical analysis of historical performance of a stock or a market. This approach uses charts and technical tools such as technical indicators or oscillators to describe the future activity of a market. Technical analysis uses the open, close, high, low and volume values of stocks within the day/week/month/year. Those values are analyzed by the analysts with the technical indicators, which are widely used in stock market forecasting, to identify the trend movement of a stock or trigger the buy/sell rules.
Technical indicators are basically mathematical and statistical calculations based on the statistical data such as close price, volume and trend of stocks and ETFs. Technical indicators are divided in two types which are leading indicators and lagging indicators [2]. Leading indicators show the ratio of buyers and sellers in the market and gives the signals when a stock in oversold or overbought condition [3]. On the other hand, lagging indicators show the trend direction and strength of the market. Most well known leading
indicators are oscillators such as Relative Strength Index (RSI) and the majority of lagging indicators are moving averages such as Simple Moving Average (SMA).
There are plenty of indicators used in technical analysis. Each indicator has its own parameters. The forecaster who is not a specialist may not have any idea which technical indicator must be used with which trigger values and time period. In financial world, some well-known key values are obtained to make technical indicators more useable to all investors. These values are usually formed as easy-to-remember values such as basic and round numbers. For example the most well known RSI rule is 70-30 RSI rule in RSI period of 14 days. This rule means, when RSI value in 14 days period approaches 70, the stock is considered to be overbought and it is a signal for selling (or not buying). Likewise, when RSI value in 14 days period approaches 30, the stock may be oversold and it is a signal for buying (or not selling). However, blindly using the 70-30 RSI rule every time for every stock can result in losses.
Exchange Traded Funds (ETFs) are one of the fastest growing fund types in the financial market. ETFs represent a basket of stocks that reflect an index, however, are not mutual funds; they trade just like any other company on a stock exchange [4]. Their stability is higher than stocks because of being more durable to speculations. Thereby, ETFs gives more consistent results than stocks to analysts who work with technical analysis that uses statistical data or methods like Neural Networks and Genetic Algorithms. The ETFs that are used in this study are given in the Table 1.
In this study, the performances of several ETFs are analyzed by genetic algorithms according to portfolio performance using different technical indicators to show how selecting a technical indicator changes the portfolio performance and how different market conditions affect the technical indicators.
Fund Name Ticker
Volume (Intraday) Volume (3 month average) 52-week high 52-week low SPDR S&P 500 SPY 500,909,335 227,107,000 122.12 87.00 Financial Select Sector SPDR XLF 208,559,573 118,574,000 17.12 10.83 PowerShares QQQ QQQQ 190,631,100 94,496,500 50.65 33.18 iShares MSCI Emerging Markets Index EEM 169,454,525 81,832,800 40.66 30.12 iShares Russell 2000 Index IWM 139,644,444 73,170,700 74.66 47.27 iShares MSCI Brazil Index EWZ 44,539,203 22,139,800 80.93 48.03 Energy Select Sector SPDR XLE 40,155,951 21,942,600 62.3 43.66 iShares MSCI Taiwan Index EWT 16,461,474 14,304,200 13.46 9.51 iShares MSCI Hong Kong Index EWH 11,351,198 6,693,360 16.89 12.79 SPDR S&P MidCap 400 MDY 6,917,864 3,773,000 154.8 97.90 Table 1 – ETF list used in experiments (The data is taken from Yahoo Finance on 05/22/2010) 2. Market Trend Analysis
The market trend means the general direction of the market or price of the stock. Identifying the market trend is major operation for technical analysis because it leads to ability of trading with trends which can be highly profitable. The prediction operation to find the trend direction is called trend analysis. It is performed to find an uptrend (bull market) or a downtrend (bear market), so investors can act accordingly.
Moving averages, ADX and AROON are among the most well known indicators to find the trend. In this study, Simple Moving Average (SMA) is used for finding the trend direction as follows: When the 50 days SMA value of an ETF moves above the 200 days SMA value, it means a signal for a new uptrend is starting. Likewise, when the 50 days SMA value of an ETF moves below the 200 days SMA value means a signal for a current
uptrend is finished and a new downtrend is starting. The described SMA (50) – SMA (200) rule is implemented in this study to improve the performance of portfolios.
3. Technical Indicators
Every technical indicator that used in this research is analyzed one by one by genetic algorithms for getting the optimum indicator parameters such as indicator period or buy/sell value. The technical indicators used in this analysis are RSI, MFI and Williams %R.
RSI is the most well known and widely used technical indicator in technical analysis area. The objective of this indicator is determining the overbought and oversold conditions of asset. The most well known RSI rule is 70-30 RSI that suggests to buy when RSI value of an asset is below 30 and sell (or not buy) when RSI value of an asset is above the 70.
The Money Flow Index (MFI) is similar to RSI, but the main difference is MFI also considers the volume of an asset, whereas RSI only uses stock close values. This indicator can be used in a similar way with RSI. The most well known MFI rule is 80-20 MFI that gives buy signal when the MFI values of an asset moves below the 20 and gives sell signal (or not buy) when the MFI value of an asset moves above the 80 [5].
Williams %R indicator calculates overbought and oversold levels of an asset like other technical analysis oscillators. It shows the relation between closing price of an asset and high/low price of certain n period of time. MFI and RSI result values have a range between 0 and 100, whereas the Williams %R indicator produces values from -100 to 0. The most common rule of Williams %R is (-20)(-80) Williams %R that suggests to investor to buy when Williams %R value of an asset is moves below -80 and suggests to sell when Williams %R value of an asset moves above -20. The most widely used period of time value is 14 for this indicator [6].
4. Genetic Algorithms in Stock Market Forecasting
Stock market forecasting is very popular approach for investors due to its high expected profit. Hence, different methodologies and researches have been done to build up decision support systems that forecast stock market. Most of the studies only consider statistical agents like technical indicators. On the other hand, artificial intelligence methods became popular in the recent years.
The artificial intelligence techniques such as Neural Networks and Genetic Algorithms are commonly applied to stock market forecasting area. Some researches use Neural Networks in their studies [7], [8], some of them prefers genetic algorithms to generate trading rules [9], [10] and some studies combines Genetic Algorithms and Neural Networks [11], [12].
The purpose of this study is optimizing the technical indicators to find more reliable rules rather than the most well known rules such as RSI 70-30 rule and show how selecting a technical indicator changes the portfolio performance and how different market conditions affect the technical indicators. Optimizing technical indicators and finding the optimum rule that gives maximum profit tasks are complex computations and need considerable processing time. As a result, genetic algorithms are chosen to be the optimization tool in this research due to its rapid solution finding capabilities.
Genetic algorithms are generally used for solving complex calculations such as searching, optimizing and classification. These algorithms are probabilistic search algorithms that find the optimum solution of a problem which has multiple solutions.
In genetic algorithms each potential solution of the problem is represented as a chromosome. A genetic algorithm starts with a population of randomly generated
chromosomes and they are combined to form better solutions in each evaluation. These combinations are done by genetic operations which are crossover and random mutation.
During each evolution, natural selection is applied to decide which solutions will be selected to the next evolution. The selection criterion of natural selection is called the fitness value. Solutions with better fitness values (the highest fitness value in this study) are more likely to exist for the next evolution. After all evolutions finish, the genetic algorithm gives the best solution which having the best fitness value.
5. Model
In this study, genetic algorithms based technical indicator optimizing methodology is proposed for getting the highest portfolio profit performance on different ETFs. The data in this model is provided from the daily open, close, high, low and volume values of 10 ETFs in NYSE. The ETF data that begins from the date when the ETF is first shown in NYSE (e.g. SPY begins on January 1993) and ends at 12/31/2007 is used for training data to generating optimum indicator rules and the ETF data that begins from 01/01/2008 and ends at 04/01/2010 is used for testing the generated rules.
The model presented in this paper can be divided into two steps. First step is finding the trend of the ETF and second step is generating an optimum trading rule that gains the maximum profit from the ETF in that trend found in the first step.
The trend finding step is realized by applying “SMA (50) – SMA (200) method” explained in Section 2. As result, it finds the days in up and down trends. The days in the up trends and down trends are used to generate uptrend or downtrend rules in step two.
The second step of the model includes genetic algorithm analysis to generate optimum uptrend and down trend trading rules to optimize technical indicators.
Figure 1 - A Chromosome of Technical Indicator RSI
In the genetic algorithm step, the evolution number is set to 50 and population size of an evolution is set to 1000 and each technical indicator rule is represented by a chromosome and each parameter of technical indicator is represented by a gene. The natural selection selects the chromosomes (trading rules) that make the highest profit during evolution. An initial capital of 100,000$ is provided to each chromosome and fitness value of a chromosome is calculated using this money.
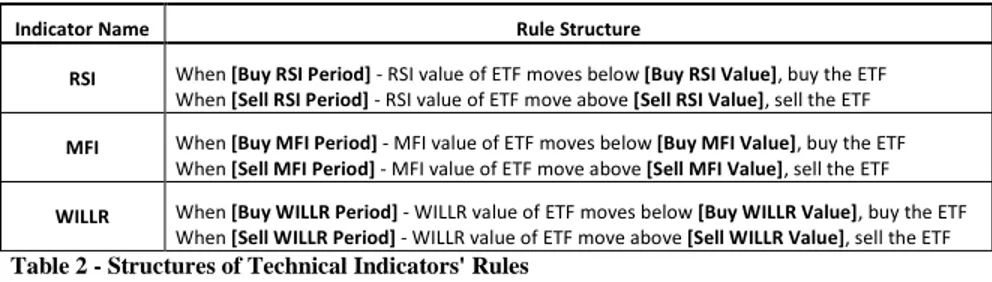
The chromosomes reflect the trading rules in the genetic algorithm model. These rules can differ due to technical indicator’s structure. Table 2 shows the rule structures used in this study. For example, a chromosome which represents a trading rule of technical indicator RSI is shown in Figure 1. This chromosome indicates that an investor should buy the stock when 5 days period RSI value moves below 34 and should sell the stock when 10 days period RSI value of stock moves above 81.
In genetic algorithms, during the natural selection in evolution, crossover and mutation operations are applied on chromosomes. In crossover operations two different chromosomes exchange their genes that have same indexes and in mutation operation a single chromosome’s any gene may change with another value. Following these operations new rules are generated in natural selection and good chromosomes (rules which make better profits) are chosen to next evolution. The demonstration of mutation and crossover operators are shown in Figure 2.
Indicator Name Rule Structure
RSI When [Buy RSI Period] - RSI value of ETF moves below [Buy RSI Value], buy the ETF When [Sell RSI Period] - RSI value of ETF move above [Sell RSI Value], sell the ETF
MFI When [Buy MFI Period] - MFI value of ETF moves below [Buy MFI Value], buy the ETF
When [Sell MFI Period] - MFI value of ETF move above [Sell MFI Value], sell the ETF
WILLR When [Buy WILLR Period] - WILLR value of ETF moves below [Buy WILLR Value], buy the ETF When [Sell WILLR Period] - WILLR value of ETF move above [Sell WILLR Value], sell the ETF Table 2 - Structures of Technical Indicators' Rules
In Figure 2, chromosome 1 and chromosome 2 enter the crossover operation and chromosome 1 gives the RSI Buy Value gene and RSI Buy period gene to chromosome 2, on the other hand it takes RSI Sell Value and RSI Sell Period from chromosome 2. Also chromosome 1 enters mutation and RSI Buy Value gene and RSI Sell Period gene is changed randomly during mutation. Thus new chromosomes (rules) are generated and variety of chromosomes is increased.
Figure 2 - The Demonstration of Mutation and Crossover Operators
Buy and sell signals occur when the result rule is applied to ETF. Each buy or sell value points to different days. The most important fact during buying and selling the ETF is that buy and sell signals must be in same trend. Otherwise the stock is sold at the end of the signal’s trend. For example a buy signal of a stock in a trend must be sold in that trend otherwise it is sold at the first day of the trend change. Also during the calculation of the profit (fitness value), 0.1% commission is applied to each buy and sell transaction.
The model presented here, finds the ETF’s up trends and down trends at first, then it starts using genetic algorithms to generate the uptrend and downtrend rules which make the highest profit on the training data of ETF.
The generated uptrend and downtrend rules are used in the test data in such a way that the generated up trend rules are tested on uptrend test days, the generated downtrend rules are tested on downtrend test days. The overall test period was from 01/01/2008 to 04/01/2010. Uptrend days were defined as days when SMA(50) > SMA(200) is satisfied, downtrend days were defined as days when SMA(50) < SMA(200) is satisfied, so they do not overlap. In the first analysis, 2 separate performance results (uptrend performance and downtrend performance) are obtained as such only uptrend days are considered for uptrend data, and only downtrend days are considered for downtrend data. In the second analysis, the generated uptrend and downtrend rules are used together at the same time in the test data providing a single performance result. During this task, the decision support system controls the test data and when meets with an uptrend it applies the uptrend rule and when meets with a downtrend it applies the downtrend rule. The third analysis is the same as the first analysis but this time the basket of ETFs are used to generate rules
instead of using a single ETF. The model checks all ETFs in the basket to see if any of them triggers a buy signal, if it does then that particular ETF is bought and the sell signal is waited for that ETF. Even if multiple ETFs might trigger buy signals, only the ETF which had the best past performance is bought, so even though the ETFs can be chosen from a basket, still only one ETF is bought and sold in each transaction during the process. The motivation behind this approach is to increase the number of transactions resulting in overall profit improvement assuming average transaction profits are similar. In the final analysis, the generated uptrend and down trend rules are used at the same time like second analysis but also in this analysis, the basket of ETFs are used to analyze the technical indicators instead of using a single ETF. The results of these analyses are shown in Section 6.
6. Experimental Results
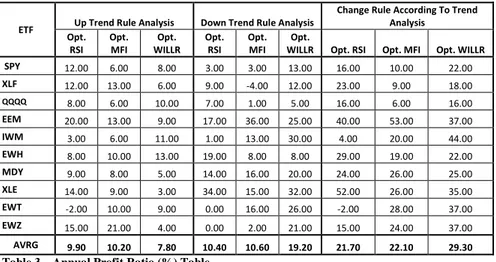
During the study; for each analysis the optimum rules for each indicator are generated by genetic algorithms using the training data that starts with the first day of the start of ETF and ends on 12/31/2007. In first three analyses each rule is generated due to a single ETF but in last three analyses, rules are generated according to a basket of ETFs. For each ETF, an uptrend rule and a downtrend rule is generated from the data that is in uptrend or downtrend. Tables 3 and 4 provide annual profit ratio and transaction success rate results of uptrend, downtrend and combined analysis for each ETF. Table 5 compares these results with some well-known technical analysis rules. Table 6 summarizes uptrend, downtrend and combined analysis performance when a basket of ETFs is used instead of a single ETF. Even though it is not shown in these tables, the number of transactions increased when a basket of ETFs are used instead of a single ETF. However the success ratio did not get compromised significantly as a result of the increase in the number of transactions, resulting in an increase in annual profit ratio. Due to space limitations, the optimum rule parameters are not shown in this paper.
In the following tables (Tables 3-6), the word “Optimum” is written as “Opt.”. Also S(%), P(%), R and AVRG symbols represent success percentage, annual profit ratio, number of occurrences of the rule triggers and average, respectively.
ETF Up Trend Rule Analysis Down Trend Rule Analysis
Change Rule According To Trend Analysis
Opt.
RSI Opt. MFI WILLR Opt. Opt. RSI Opt. MFI WILLR Opt. Opt. RSI Opt. MFI Opt. WILLR
SPY 12.00 6.00 8.00 3.00 3.00 13.00 16.00 10.00 22.00 XLF 12.00 13.00 6.00 9.00 -4.00 12.00 23.00 9.00 18.00 QQQQ 8.00 6.00 10.00 7.00 1.00 5.00 16.00 6.00 16.00 EEM 20.00 13.00 9.00 17.00 36.00 25.00 40.00 53.00 37.00 IWM 3.00 6.00 11.00 1.00 13.00 30.00 4.00 20.00 44.00 EWH 8.00 10.00 13.00 19.00 8.00 8.00 29.00 19.00 22.00 MDY 9.00 8.00 5.00 14.00 16.00 20.00 24.00 26.00 25.00 XLE 14.00 9.00 3.00 34.00 15.00 32.00 52.00 26.00 35.00 EWT -2.00 10.00 9.00 0.00 16.00 26.00 -2.00 28.00 37.00 EWZ 15.00 21.00 4.00 0.00 2.00 21.00 15.00 24.00 37.00 AVRG 9.90 10.20 7.80 10.40 10.60 19.20 21.70 22.10 29.30
ETF Up Trend Rule Analysis Down Trend Rule Analysis
Change Rule According To Trend Analysis
Opt.
RSI Opt. MFI WILLR Opt. Opt. RSI Opt. MFI WILLR Opt. Opt. RSI Opt. MFI Opt. WILLR
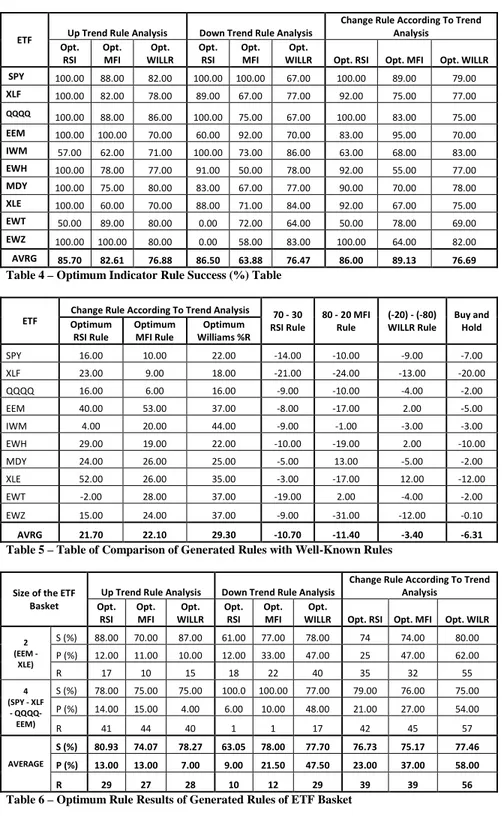
SPY 100.00 88.00 82.00 100.00 100.00 67.00 100.00 89.00 79.00 XLF 100.00 82.00 78.00 89.00 67.00 77.00 92.00 75.00 77.00 QQQQ 100.00 88.00 86.00 100.00 75.00 67.00 100.00 83.00 75.00 EEM 100.00 100.00 70.00 60.00 92.00 70.00 83.00 95.00 70.00 IWM 57.00 62.00 71.00 100.00 73.00 86.00 63.00 68.00 83.00 EWH 100.00 78.00 77.00 91.00 50.00 78.00 92.00 55.00 77.00 MDY 100.00 75.00 80.00 83.00 67.00 77.00 90.00 70.00 78.00 XLE 100.00 60.00 70.00 88.00 71.00 84.00 92.00 67.00 75.00 EWT 50.00 89.00 80.00 0.00 72.00 64.00 50.00 78.00 69.00 EWZ 100.00 100.00 80.00 0.00 58.00 83.00 100.00 64.00 82.00 AVRG 85.70 82.61 76.88 86.50 63.88 76.47 86.00 89.13 76.69
Table 4 – Optimum Indicator Rule Success (%) Table
ETF Optimum Change Rule According To Trend Analysis RSI Rule 70 - 30 80 - 20 MFI Rule (-20) - (-80) WILLR Rule Buy and Hold RSI Rule Optimum MFI Rule Williams %R Optimum
SPY 16.00 10.00 22.00 -14.00 -10.00 -9.00 -7.00 XLF 23.00 9.00 18.00 -21.00 -24.00 -13.00 -20.00 QQQQ 16.00 6.00 16.00 -9.00 -10.00 -4.00 -2.00 EEM 40.00 53.00 37.00 -8.00 -17.00 2.00 -5.00 IWM 4.00 20.00 44.00 -9.00 -1.00 -3.00 -3.00 EWH 29.00 19.00 22.00 -10.00 -19.00 2.00 -10.00 MDY 24.00 26.00 25.00 -5.00 13.00 -5.00 -2.00 XLE 52.00 26.00 35.00 -3.00 -17.00 12.00 -12.00 EWT -2.00 28.00 37.00 -19.00 2.00 -4.00 -2.00 EWZ 15.00 24.00 37.00 -9.00 -31.00 -12.00 -0.10 AVRG 21.70 22.10 29.30 -10.70 -11.40 -3.40 -6.31
Table 5 – Table of Comparison of Generated Rules with Well-Known Rules
Size of the ETF Basket
Up Trend Rule Analysis Down Trend Rule Analysis Change Rule According To Trend Analysis Opt.
RSI Opt. MFI WILLR Opt. Opt. RSI Opt. MFI WILLR Opt. Opt. RSI Opt. MFI Opt. WILR
2 (EEM - XLE) S (%) 88.00 70.00 87.00 61.00 77.00 78.00 74 74.00 80.00 P (%) 12.00 11.00 10.00 12.00 33.00 47.00 25 47.00 62.00 R 17 10 15 18 22 40 35 32 55 4 (SPY - XLF - QQQQ- EEM) S (%) 78.00 75.00 75.00 100.0 100.00 77.00 79.00 76.00 75.00 P (%) 14.00 15.00 4.00 6.00 10.00 48.00 21.00 27.00 54.00 R 41 44 40 1 1 17 42 45 57 AVERAGE S (%) 80.93 74.07 78.27 63.05 78.00 77.70 76.73 75.17 77.46 P (%) 13.00 13.00 7.00 9.00 21.50 47.50 23.00 37.00 58.00 R 29 27 28 10 12 29 39 39 56
7. Conclusion
In this study widely used technical indicators are analyzed with their performances on various different ETFs. Several different analyses are performed; single ETF, basket of ETFs, uptrend, downtrend performances, etc. In each analysis, genetic algorithms are used as the choice in technical indicator optimization. The results indicate that by optimizing (or tuning) the technical indicator parameters, not only good profit results can be obtained, but also the widely used technical indicator values can be outperformed by the optimized values. It is observed that using the trend information increases the performance considerably; the values in uptrend and downtrend are significantly different. Also using a basket of ETFs result in more rule triggers; hence increases the performance. Furthermore, the analysis indicate that the chosen indicator values have very reliable and stable returns in the test period, having an average of over 80% success rate (correct results 80% of time) and an average annual profit of %24 at the time where all indices, buy and hold strategy and all well-known technical indicators provided sub-par returns. This is sub-part of an ongoing study; the future work consists of using more indicators and mixing the indicators within the same chromosome for better performance.
8. References
[1] Kirkpatrick; Dahlquist; "Technical Analysis: The Complete Resource for Financial Market Technicians", (Financial Times Press, 2006), page 3.
[2] Langager, C.; Murphy, C.; "Exploring Oscillators and Indicators", 2007, Investopedia.com.
[3] Ozbayoglu, A. M.; Bahadir, I; Comparison of Bayesian Estimation And Neural Network Model in Stock Market Trading", Intelligent Engineering Systems through Artificial Neural Networks, Volume 18, pages 581-586, 2008.
[4] Connors, L.; Alvarez, C.; "High Probability ETF Trading", Connors Research, 2009.
[5] Liu, N. K.; Lee, K. K.; “An Intelligent Business Advisor System for Stock Investment”, Expert Systems, Volume 14, No 3, pages 129 - 139, 1997. [6] Ni, H.; Yin, H.; “Exchange Rate Prediction Using Hybrid Neural Networks and
Trading Indicators”, Neurocomputing 72, pages 2815 – 2823, 2009.
[7] Yu, M. and Enke, D.; "Stock Trading Based on Neural Network Modeling and Fuzzy-Technical Indicators", Intelligent Engineering Systems through Artificial Neural Networks, Volume 17, pages 255-260, 2007.
[8] Ozbayoglu A. M.;"Neural Based Technical Analysis in Stock Market Forecasting", Intelligent Engineering Systems through Artifical Neural Networks, Volume 17, pages 261-266, 2007.
[9] Allen, F.; Karjalainen R.; "Using Genetic Algorithms to Find Technical Trading Rules", 1995.
[10] Fernández-Rodríguez F.; González-Martel C.; Sosvilla-Rivero, S.; "Optimization of Technical Rules by Genetic Algorithms: Evidence from the Madrid Stock Market", Applied Financial Economics, pages 773 - 775, 2005. [11] Kuoa, R.J.; Chen, C.H.; Hwang Y.C.; "An Intelligent Stock Trading Decision
Support System through Integration of Genetic Algorithm Based Fuzzy Neural Network and Artificial Neural Network", Fuzzy Sets and Systems 118, pages 21-45, 2001.
[12] Kai, F.; Wenhua, X.; "Training Neural Networks with Genetic Algorithms for Forecasting the Stock Price Index", IEEE International Conference on Intelligent Processing Systems, pages 401-403, 1997.