1 This volume contains papers presented at THE
INTERNATIONAL CONGRESS on ENERGY and POLITICS ,EPOL 2012. Their inclusion in this
publication does not necessarily constitute endorsements by editor or the publisher.
Copyright and Reprint Permission
Copying without a fee is permitted provided that the copies are not made or distributed for direct commercial advantage, and credit to source is given. Please contact the publisher for other copying, reprint, or republication permission.
Copyright © 2013 Istanbul Kultur University Press 184 ISBN : 978-605-4233-98-4
2
PROCEEDINGS OF
THE INTERNATIONAL CONGRESS on ENERGY and POLITICS ,EPOL 2012
Editor
Nazan CAGLAR
Organizing Committee
Assist. Prof. Dr. Hikmet CAGLAR TC Istanbul
Kultur University
Assist. Prof. Dr. Nazan CAGLAR TC Istanbul Kultur University
Prof. Dr. Durmus DUNDAR TC Istanbul Kultur University
Prof. Dr. Muge ISERI TC Istanbul Kultur University
Lecturer Ahmet Necdet PAMIR TC Istanbul Kultur University
Advisory Committee
Melih AKALIN Former General Director of Environment Protection, Ministry of Environment
Bulent ALIRIZA Director and Senior Associate, Turkey Project Center for Strategic & International
3
Studies - CSIS
Turan G. BALI Baruch College, CUNY; USA
Sumon BHAUMIK Aston Business School, UK Josef BRADA Arizona State University, USA
Edward C. CHOW Senior Fellow, Energy and National Security Program Center for Strategic & International Studies - CSIS
Cengiz GOLTAS Chairman, the Chamber
of Electrical Engineers, The Union of the Chamber of Turkish Engineers and Architects – UCTEA
Shawkat HAMMOUDEH Drexel University, USA
Prof. Dr. Tamer KOCEL TC Istanbul Kultur University
Evzen KOCENDA CERGE-EI, Charles University, Czech Republic
Prof. Dr. Ali M. KUTAN Southern Illinois University Edwardswille
Gulnur MURADOGLU Sir Cass Business School, UK
Sumru NOYAN Secretary General, the
Organization of the Black Sea Economic Cooperation
4
for economic affairs of the Republic of Turkey
Istvan P. SZEKELY European Commission, Belgium
Melih TURKER CEO of Petrol Ofisi
Oguz TURKYILMAZ Chairman of the Energy Working Group, Chamber of Mechanical Engineers, The Union of the Chamber of Turkish Engineers and Architects - UCTEA
Hikmet ULUGBAY Former Minister of State
for the Economy of the Republic of Turkey Scientific Committee
Assoc. Prof. Dr. Mensur AKGUN TC Istanbul Kultur University
Nihal BAYRAKTAR Pennsylvania State
University – Harrisburg, USA
Sumon BHAUMIK Aston Business
School, UK
Janusz BRZESZCZYNSKI Heriot-Watt University, UK
Assist. Prof. Dr. Hikmet CAGLAR TC Istanbul
Kultur University
Assist. Prof. Dr. Nazan CAGLAR TC Istanbul Kultur University
Prof. Dr. Ulku DEMIRDOGEN TC Istanbul Kultur University
5
University of Science and Technology
Prof. Dr. Durmus DUNDAR TC Istanbul Kultur University
Selim ELEKDAG IMF
Hubert GABRISCH Halle Institute for Economic Research, Germany
Rajeev K. GOEL Illinois State
University, USA
Prof. Dr. Tevfik GUYAGULER Department of mining engineering, Middle East Technical University
Shawkat HAMMOUDEH Drexel University, USA
Prof. Dr. Ji-Huan HE Soochow University
Deniz O. IGAN IMF
Prof. Dr. Muge ISERI TC Istanbul Kultur University
Richard JONES Deputy director,
International Energy Agency
Prof. Dr. Hikmet KARAKOC Anadolu University
Prof. Dr. Filiz KARAOSMANOGLU Vice Rector,
Yalova University
Prof. Dr. Ali M. KUTAN Southern Illinois University
Mehmet OGUTCU Chairman, Global
Resources Corporation London
Assist. Prof. Dr. Binhan OGUZ TC Istanbul Kultur University
Prof. Dr. Gulhan OZBAYOGLU Dean, Engineering Faculty, Atilim University
6 Dr.Gul Berna OZCAN University of London, UK
Prof.Dr. Nilgun OZER San Francisco State University
Lect. Ahmet Necdet PAMIR TC Istanbul Kultur
University
Erick W. RENGIFO Fordham University, USA
Prof. Dr. Hasan SAYGIN Vice Rector, Istanbul Aydın University
Prof. Dr. Mete SEN Istanbul Technical University
Prof. Dr. Celal SENGOR Department of geological engineering, Istanbul Technical University
Prof. Dr. Tanay Sıdkı UYAR Vice President,
Eurosolar & Manager
Jian YANG University of Colorado Denver, USA
Prof. Dr. Tolga YARMAN Okan University
Haigang ZHOU Cleveland State
7
Keynote Speakers Kutsal ATIL, CEO D Energy
Prof. Dr. Josef BRADA , Arizona State University, USA Editor, EasternEuropeanEconomies; Co-Editor, ComparativeEconomicStudies
Mehmet OGUTCU , Chairman, Global Resources
Corporation London
Mine YÜCEL , Vice President and Senior Economist
8
LEAST-COST POLICY STRATEGIES FOR CO2 -REDUCTION IN PASSENGER CAR TRANSPORT: LESSONS FROM EUROPE FOR EMERGING COUNTRIES
Amela AJANOVIC and Reinhard HAAS
Vienna University of Technology, Energy Economics Group,
E-mail: [email protected]
ABSTRACT
Emerging countries currently have the highest growth rates in transport energy consumption and straightforward greenhouse gas emissions. In recent years many policy approaches in EU countries have been implemented to cope with problems in transport sector. The core objective of this paper is to derive lessons learned from different EU policies for road passenger transport which can also be implemented in emerging countries. Of high relevance in this context are especially the costs of measures to reduce GHG emissions from road passenger transport and how to derive a corresponding least-cost-portfolio of measures.
The major conclusions and recommendation for emerging countries based on analysis of European policies for road passenger transport are: (i) Improving energy efficiency is a very important measure but implemented alone it does not necessarily lead to an equivalent energy and CO2 saving effect because rebound effect - people purchase larger cars and drive more; (ii)
9 The major recommendation is that standards have to be accompanied with fuel taxes to reduce km driven as well as with size-dependent registration taxes to limit the size of cars.
Keywords: road transport, emerging countries, policies, Europe, least-cost approach
1. INTRODUCTION
In most countries the transport sector is the major barrier for heading towards sustainable economies. In virtually all OECD and emerging countries greenhouse gas (GHG) emissions from transport have the highest growth rates among all sectors [1]. It is the only sector where world-wide energy consumption has doubled as well as GHG emissions [1]. Due to the IEA the largest share of this growth did take place in the non-OECD regions mainly in the emerging countries. Of specific relevance is this context is road transport which causes more than 90% of transport emissions in all countries.
Aside from GHG emissions other road transport related problems are energy supply security, air pollution, accidents and congestions. Some of these problems are especially expressed in urban areas.
The dynamics of these problems is actually much more pressing in emerging countries with rapidly growing economies, urbanization and corresponding rising need for transport. Currently, the situation with respect to motorization in these countries is quite different in comparison to Europe. With respect to emerging countries it is especially important to consider that a large
10 part of individual transport especially in Asian countries is also provided by two-wheelers, see Fig.11.
As Fig.1 depicts countries like Malaysia, Brazil, Mexico and Turkey are “leading” in this category with about 200 cars/capita (total: 300-500 road vehicles/capita) while the largest emerging economies China and India show only 20 cars/capita (total: about 80 - 100 road vehicles/capita). In the light of the looming increases to catch up with the Western “levels” it is extremely important for these countries to avoid the mistakes made in the OECD countries and to learn the lessons from implemented policies. 0 100 200 300 400 500 600 700 USA Japan Germany Turkey Mexiko Brazil Malaysia China India
Cars Other 4-wheelers 2-wheelers
Fig. 1: Motorization in different OECD- and emerging countries (Road vehicles per capita) in 2007 (figures for India and Turkey estimated based on values from 2005) (Sources: [2-4])
1
Two-wheelers have been discussed by Ajanovic/Dahl/Schipper [5], IEA [6] and Schipper et al. [7] and they are not focus of this paper. However, policies also have to take into account this aspect.
11 To cope with the problems mentioned above in almost all of these countries policy measures are implemented or at least thought about. Yet, so far the most comprehensive portfolios of policies have been implemented in Western European countries and to some extent in the USA and Canada. The most widely known categories of policies are standards (like the CAFE standards in the USA), promotion of biofuels (as in the USA, Brazil and Europe) and electric and fuel cell vehicles (as currently discussed in the USA, Europe and many other countries), fuel taxes (which were implemented already in the 1970s in Western Europe and by mid of the 1980s in Canada) and registration taxes (mainly in Denmark).
The core objective of this paper is to derive lessons learned from different EU policies for road passenger transport which can also be implemented in emerging countries. Of high relevance in this context are especially the costs of measures to reduce GHG emissions from road passenger transport and how to derive a corresponding least-cost-portfolio of measures2. In this context it is also very important to consider the conceivable backlashes of policies e.g. the rebound-effect due to more efficient cars and resulting lower service prices.
2 METHOD OF APPROACH TO REDUCE CO2 EMISSIONS
To get a reliable appraisal of the effect of different policy
2 This work is based on the outcomes of the EU-funded project
ALTER-MOTIVE, see Ajanovic et al. [8], and www.alter-motive.org.
12 measures on the CO2 reduction it is very important to recognise what are the major factors that influence CO2 emissions. Fig. 2 shows how CO2 emissions in passenger car transport come about and how they can be reduced.
On-road power-specific fuel efficiency Test-cycle fuel intensity CO2emissions CO2emissions coefficient = x Energy Total vkm driven Driving coefficient behaviour = x = x lower coefficient for biofuels or electricity to be improved by automobile manufacture to be reduced by eco-driving to be influenced by fuel taxes or fuel intensity improvements x x Power (capacity) of car to be reduced e.g. by kW-specific registration tax
Standards Education Fuel tax Registration tax Subsidies, quotas
Policy instruments On-road power-specific fuel efficiency Test-cycle fuel intensity CO2emissions CO2emissions coefficient = x Energy Total vkm driven Driving coefficient behaviour = x = x lower coefficient for biofuels or electricity to be improved by automobile manufacture to be reduced by eco-driving to be influenced by fuel taxes or fuel intensity improvements x x Power (capacity) of car to be reduced e.g. by kW-specific registration tax On-road power-specific fuel efficiency Test-cycle fuel intensity CO2emissions CO2emissions coefficient = x Energy Total vkm driven Driving coefficient behaviour = x = x lower coefficient for biofuels or electricity to be improved by automobile manufacture to be reduced by eco-driving to be influenced by fuel taxes or fuel intensity improvements x x Power (capacity) of car to be reduced e.g. by kW-specific registration tax
Standards Education Fuel tax Registration tax Subsidies, quotas
Policy instruments
Figure 2. Impact factors on CO2 emissions in the car passenger transport sector (Source: [8])
As discussed in Ajanovic et al. [8], CO2 emissions from passenger car transport depend in principle on energy used for transport and the average specific CO2 emissions coefficient of different fuels used. The coefficient fCO2 can be improved, e.g. better quality of fossil fuels, better ecological performance of biofuels, more electricity from renewable energy sources.
13 2 2 CO CO
vkm
FI
f
EM
=
⋅
⋅
(1) With vkm is vehicle km driven, F is fuel intensity in litre per 100 km and fCO2 are specific CO2 emissions per litre fuel.)
,
(
P
Y
f
vkm
=
S (2) With PS is service price and Y is income.FI
P
P
S=
F(3) With PF is fuel price.
Total energy consumption can be reduced by increasing on-road fuel efficiency (lower energy consumption per km driven and per kW), lower travel activity (less vkm driven) and smaller cars (less kW).
On-road power specific fuel efficiency is influenced by (theoretical) test-cycle fuel efficiency and the individual driving behaviour.
Note that different policies can have multiple and even contradicting impacts. Total vkm driven can be reduced by fuel taxes or increased by fuel intensity improvements due to the rebound as shown in Chapter 5.
Finally, the method of approach is based on calculation of total costs for society and resulting CO2 reductions: For taxes these costs are the welfare losses for society; For the technologies we consider the additional investment costs of the technology and the energy cost reduction respectively the increased producer surplus if
14 the technology is produced in the region3;
For alternative fuels we have to consider the additional production costs minus the increased producer surplus if the technology is produced in the region.
For the last two categories it is also important to consider technological learning effects.
3 A SURVEY ON POLICY MEASURES
Policy measures implemented in transport sector could be put in three main categories:
Switch from fossil fuels to alternative fuels, in the first
line to biofuels;
Improve efficiency of cars including switch to
alternative and more efficient powertrains;
Reduce energy consumption with taxes and standards. Switch
Currently most important alternative fuels are 1st generation biodiesel (BD-1) and bioethanol (BE-1). Although low, share of biofuels in total transport fuels demand is increasing all over the world mostly due to biofuels targets and different government incentive programs. Reason for this policy is the fact that biofuels have potential to contribute to replacing fossil fuels and reduce CO2 emissions in transport sector. However, over the past decade, biofuels have been more expensive than fossil fuels and reduction of CO2 emissions was moderate. Since the preferred feedstocks for current
3
It is assumed that 75% of the value chain of new technologies is produced within the EU countries and hence these additional costs are converted into producer surplus.
15 biofuels are corn, wheat, sugarcane, rapeseed, soybean and sunflowers, the very important issue is relation between biofuels production and increasing food prices see also [9].
Improve
To reduce energy consumption and at the same time CO2 emissions, it is important to improve efficiency of conventional diesel and gasoline vehicles as well as to increase the number of alternative and more efficient powertrain systems (such as battery electric vehicles (BEV) and fuel cell vehicles (FCV)) in the total vehicle stock.
Hybrid internal combustion engine vehicles are an alternative with slightly higher costs but clearly better environmental performances than conventional vehicles. BEV and FCV have much better CO2 balances than conventional cars if electricity and hydrogen are produced from renewable energy sources. However, these technologies are very expensive and not competitive on the market.
Reduce
Fiscal policies currently applied for conventional vehicles need to be distinguished between one time measures such as vehicle purchase tax (also called registration tax) and annually levied road taxes. Vehicle purchase taxes have proven to be influential on the magnitude of car sales and the consumer’s choice for a certain model. Annual taxation schemes based on vehicle’s CO2 emissions (and the car footprint, not weight) are seen as a more direct way of influencing
16 consumer decisions. In this case, the limit needs to be defined for maximum allowed emissions level together with penalties that are imposed if the limit is exceeded. Favourable company car depreciation schemes do currently weaken the impact of purchase taxation schemes, therefore more personalized schemes targeting the behaviour of the individual motorist (e.g. incentivising reduction of kilometres driven per car through fuel taxation) are seen as the next step.
4 EU POLICIES
In this chapter we give a short introduction why it is relevant to learn from EU-countries.
In recent years in EU ambitious policies have been implemented in transport sector with the goal to move toward more sustainable transport system. Most important policies are:
Taxes related to fuels and vehicles Standards
Subsidies and other support policies for alternative fuels and alternative automotive technologies.
17 140 gCO2/km
140 gCO2/km
Figure 3. Evolution of CO2 emissions from new passenger cars by association (adjusted for changes in the test cycle procedure) [11]
Tax
Fuel taxes in EU are the highest in the world. They are slightly different across EU countries. Tax on gasoline in EU countries is ranging from about 42% to 63% of the total gasoline price. The share of tax on diesel is ranging from 36% to 58% [10].
In most of EU countries a registration tax for vehicles is applied as well. This tax is paid once, by each vehicle owner, for each vehicle purchased and entered into service. The most of criterions for this tax are based on fuel consumption, on cylinder capacity, CO2 emissions and price [10]. This tax is currently by far highest in Denmark.
Additionally there are also taxes on ownership. These taxes are paid annually, regardless of how often the vehicle is used. They are usually based on power (kW), cylinder capacity, CO2 emissions, fuel consumption and weight.
18
Standards
The European Commission has designed a comprehensive strategy for reduction of average CO2 emissions from new cars. The reduction of CO2 emissions from new passenger cars is based on the voluntary commitments with the European, Japanese and Korean car manufacturer associations. The target for average CO2 emissions from new car is 130 gCO2 per km in period 2012-2015. Target for 2020 is 95 gCO2 per km, see Fig. 3. The reduction of average CO2 emissions from new cars can be achieved by means of improvements in vehicle motor technology (e.g. air-conditioning systems, pressure monitoring systems, etc.) as well as with the increased use of biofuels or electric vehicles powered by renewables.
Support policies for alternative fuels
For the currently in Europe not competitive biofuels tax exemptions are implemented and there is a binding target for Member States to achieve a 10% share of renewable energy in the transport sector by 2020 [12].
5 THE PROBLEMS OF STANDARDS
In spite of different implemented measures for the reduction of energy consumption in passenger car transport, energy consumption has been increasing, especially between 1990 and 2000. Fig. 4 depicts the development of vehicle km driven (109 vkm), energy
19 consumption (PJ) and the fuel intensity (litre/100 km)4 of the stock of vehicles in EU-15 from 1990 to 2010. It can clearly be seen that fuel intensity has decreased continuously. However, this effect did not lead to significant energy conservation. Due to the fact that service demand, vkm, has increased almost continuously the over-all energy consumption just stagnated in last years. 0 0.2 0.4 0.6 0.8 1 1.2 1.4 1.6 1990 1992 1994 1996 1998 2000 2002 2004 2006 2008 2010 E n e rg y c o n s u m p ti o n , v k m , fu e l in te n s it y ( 1 9 9 0 = 1 ) vkm E FI-Stock 1990=1
Figure 4. Normalised development (1990=1) of vehicle km driven (vkm), energy consumption (E) and fuel intensity (FI) of stock of vehicles in EU-15 from 1990 to 2010 [13]
However, in Fig. 4 fuel intensity (FI) does not reflect the real efficiency improvement because it is distorted by the switch to larger cars. To correct this we define a
4 Note, that litre refers to litre gasoline equivalent throughout the
20 specific fuel intensity (FIP), see also [13-14]:
kW
FI
FIP =
(l/(km kW)) (1) kW….vehicle power.It can clearly be seen from Fig. 5 that the decrease in FIP from 1990 to 2010 was virtually twice as high as the decrease of FI. 0 0.2 0.4 0.6 0.8 1 1.2 1.4 1.6 1990 1992 1994 1996 1998 2000 2002 2004 2006 2008 2010 F u e l in te n s ity , p o w e r-s p e c if ic F I, p o w e r- (1 9 9 0 = 1 )
FIP_New Power_New FI_New
1990=1
Figure 5. Normalised development (1990=1) of fuel intensity (FI), power-specific fuel intensity (FIP) and power of new vehicles in EU-15 from 1990 to 2010 [13] A major problem recognised in EU countries is that despite better fuel efficiency energy consumption, as well
21 as CO2 emissions, are in the best case stabilised. The fact is that better energy efficiency leads to higher service demand (e.g. more vkm, larger vehicles) whereby achieved energy savings due to better fuel efficiency are lower than theoretically it can be expected.
6 THE EFFECTS OF TAXES
There is often the argument that car drivers are not sensitive to fuel prices and hence taxes do not have an impact on fuel consumption and do not lead to fuel savings. There are at least two arguments against this statement:
Fuel demand in Europe is significantly lower than in the USA (where fuels are virtually not taxed);
Analyses by several authors in the literature show that price elasticity is in a range of
-0.3 to -0.6 leads to energy savings of 30% to 60% due to the introduction of a tax.
We think that these two arguments are sufficient to justify the introduction of a higher tax.
Yet, to provide sound evidence for the impact of price, income and fuel intensities (as a proxy for efficiency) in Europe we conducted econometric time series analyses, see [15].
We extracted a long-term price elasticity of about -0.42 for the service vehicle km driven. This result has the following implications:
If we improve the fuel intensity e.g. due to technical standards, the result is that the service price for vkm driven decreases and driving gets cheaper. Straightforward the price elasticity of -0.42 implies a
so-22 called rebound effect of 42%. That is to say, if efficiency is improved by 1% the number of km driven is enhanced by 0.42% and the remaining energy conservation effect is only 0.58% (see ∆Eη in Fig. 6)5.
This effect can be compensated more or less, by the simultaneous introduction of a fuel tax, as shown in Fig. 6. In this case the additional tax – increasing the price Ps1 to Ps2 for the service km driven – would fully compensate the rebound and for the owner of a new car the service price would remain the same (Ps2 = Ps0).
Ps η0 …old efficiency E Tax effect E0 E1 E2 η1 …new efficiency ∆Eη Ps0 =Ps2 Efficiency effect ∆Etax Ps1 Ps η0 …old efficiency E Tax effect E0 E1 E2 η1 …new efficiency ∆Eη Ps0 =Ps2 Efficiency effect ∆Etax Ps1
5 Example: Assume FI of old car was 60 kWh/100 km. If it is
improved by 10 % and we have initially 10000 km driven we calculate theoretical savings of 60/100 * 0.1 * 10000 = 600 kWh. Yet, due to the rebound – now we drive 420 km (=10000 * 0.42 * 0.1) more, this is 10420 km – we now save only 348 kWh (=58% of 600 kWh).
23 Figure 6. How taxes and standards interact and how they can be implemented in a combined optimal way for society
7 WHICH MEASURES CONTRIBUTES TO CO2 REDUCTION AND TO WHICH COSTS?
The portfolio of policy measures which can be implemented to reduce CO2 emissions is very wide. However, the cost of implemented measures could be very different. For all countries but especially for emerging countries, it is important to identify least-cost policies.
The most important policy measures for the reduction of CO2 emissions in passenger road transport are fuel taxes, standards, biofuels, registration tax and E-mobility. For the example of EU-15 with an appropriate mix of these measures in an ambitious policy scenario we can reduce CO2 emissions in 2020 by about 100 million tons CO2eq/year comparing to business as usual scenario, see also [16].
However, the crucial question is which price citizens have to pay for achieving these goals.
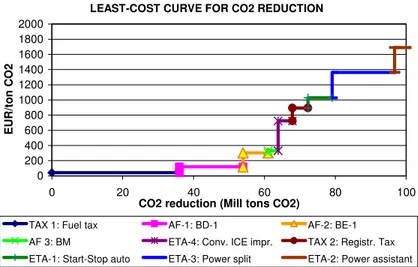
In the following we give a survey on the costs of various measures to head towards the least-cost approach. Fig. 7 shows the basic principle of the least-cost approach. The different measures are put in the least-cost order for achieving finally 100 million tons CO2 reduction up to 2020 (about 20% compared to 2008).
The major result of this analysis is that the costs of taxes up to 36 million tons CO2 reduction at a price of about 40
24 EUR/ton CO2 are cheapest for society. Therefore reducing the vkm driven and valuing the corresponding welfare loss has the first priority. Next cheapest option is switch to biofuels first generation – biodiesel, bioethanol and biogas (BM). This implies that by 2020 biofuels save at least 70% CO2 compared to fossil fuels. Based on this pre-condition the biofuels in our scenario save 28 million tons CO2 at costs between 180 and 350 EUR/ton CO2. Measures of technical efficiency improvements – starting with start/stop automatics, over electric power assistants (mild hybrids) to power splits (full hybrids) and efficiency improvements of the classical gasoline and diesel engine – are ranging from about 1000 to 1500 EUR/ton CO2. The most expensive measures are to promote fuel cell cars and battery electric vehicles with saving costs above 2000 EUR/ton CO2. This is the reason why neither BEV nor FCV show up in this figure for least-cost reduction of 100 million tons CO2. Also BF 2nd generation are not among the least-cost solutions up to 2020 and do, hence, not show up in Fig. 76.
6
25
LEAST-COST CURVE FOR CO2 REDUCTION
0 200 400 600 800 1000 1200 1400 1600 1800 2000 0 20 40 60 80 100
CO2 reduction (Mill tons CO2)
E U R /t o n C O 2
TAX 1: Fuel tax AF-1: BD-1 AF-2: BE-1
AF 3: BM ETA-4: Conv. ICE impr. TAX 2: Registr. Tax
ETA-1: Start-Stop auto ETA-3: Power split ETA-2: Power assistant
Figure 7. Least-cost curve for CO2 reduction in passenger car transport in the EU-15 in 2010
8 CONCLUSIONS
The major conclusions from this analysis and the major recommendations for emerging countries regarding passenger car transport policies are:
Regarding electric vehicles and fuel cell cars in the next decade no CO2 savings at reasonable costs for society will be achieved. If these vehicles might reach in a very optimistic scenario 1% market share by 2020 they will straightforward only contribute at the maximum in the same range to CO2 reduction. This aspect applies in principle to all countries world-wide. Some reasonable niches where these new technologies can be applied are e.g. taxis in large cities;
country-26 specific circumstances and potentials and no general conclusions can be drawn. However, it is very important that biofuels production process is very effective and sustainable as well as that competition with food production is avoided;
Improving energy efficiency is a very important measure but implemented alone does not necessarily lead to an equivalent energy and CO2 saving effect. We have seen this problem in recent years in passenger car transport from two major features: (i) Europeans purchased larger cars which reduced savings that were expected due to efficiency improvements by about half; (ii) Car owners increased vehicle km driven – to some extent due to lower service prices due to lower fuel intensity (as well as increase in income);
Therefore it is very important that standards are accompanied by taxes. It should be an additional focus on energy conservation by introducing fuel taxes to reduce km driven and by introducing size-dependent registration taxes to limit the size of cars;
There are also other important measures which were not part of this investigation such as changes in the modal split, switch to public and non-motorized transport and implement proper measures of spatial and urban planning.
Currently, standards and taxes are relatively cheap and in short-term effective measures for the reduction of CO2 emissions. A simple but very important message is that if targets are set they have to be pursued very strictly and that continuous pressure is put on the involved stakeholders: international and national policy makers, car manufacturers and also the citizens regarding their
27 driving and car purchase behaviour.
Of course, in the long-term in every country only a very broad portfolio of policy instruments (taxes, standards, quotas, emissions free-zones…), new technologies (electric and fuel cell vehicles…) and alternative fuels (biofuels, hydrogen…) can reduce energy consumption and straightforward specific CO2 emissions per km driven significantly.
References
[1] IEA, Key world energy statistics, Paris 2011.
[2] Nakicenovic N. et al, Global Energy Assessment, Laxenburg 2012 (mimeo)
[3] MoRTH, Road Transport Year Book, 2006–2007. Ministry of Road Transport and Highways (MoRTH), India, 2009
[4] Nationmaster: International Statistics in transport, http://www.nationmaster.com
[5] Ajanovic A., Dahl C. Schipper L.: "Modeling Transport (Energy) Demand and Policies – an introduction” Energy Policy, 41, iii-xiv, 2012.
[6] IEA, International Energy Agency. World Energy Outlook 2009. Paris, OECD/IEA.
[7] Schipper, L., I. Banerjee, W.S. Ng, Carbon Dioxide Emissions from Land Transport in India: Scenarios of the Uncertain, World transit research, 2009
[8] Ajanovic et al., Action Plan of the project ALTER-MOTIVE, Vienna 2011.
[9] Ajanovic A., Biofuels versus food production: Does biofuels production increase food prices?, Energy 2010 [10] Ajanovic A., Country review report, Vienna 2009 [11] European Commission, Progress report on
28 implementation of the Community’s integrated approach to reduce CO2 emissions from light-duty vehicles, 2010, (COM 2010, 656)
[12] European Commission, DIRECTIVE 2009/28/EC OF THE EUROPEAN PARLIAMENT AND OF THE COUNCIL of 23 April 2009 on the promotion of the use of energy from renewable sources and amending and subsequently repealing Directives 2001/77/EC and 2003/30/EC, 2009
[13] Ajanovic A., L. Schipper, R. Haas, The impact of more efficient but larger new passenger cars on energy consumption in EU-15 countries, Energy, forthcoming [14] Ajanovic A., R. Haas, On the effectiveness of standards vs. taxes for reducing CO2 emissions in passenger car transport Europe. Risø International Energy Conference 2011
[15] Ajanovic A., R. Haas, The role of efficiency improvements vs. price effects for modelling passenger car transport demand and energy demand—Lessons from European countries, Energy Policy, 2011
[16] Ajanovic A., et al, ALTER-MOTIVE. Final Report, 2011, www.alter-motive.org
29
KIZILLI SOLID WASTE SANITARY LANDFILL
SITE WILL BE TRANSFORMED INTO
ENVIRONMENTALLY SUSTAINABLE
IMPLEMENTATION
İmdat DEMİR, Eylem SAYIN ve Tahir BATI
Directorate of Waste Management and Enterprise /Antalya Metropolitan Municipality
CAMCI
ABSTRACT
Antalya Metropolitan Municipality will build an integrated waste facility. In addition to actual units in Kızıllı Solid Waste Sanitary Landfill Site, waste parsing and recycling, compost, recycle, power plant facilities, solid waste sanitary landfill site, healthcare waste sterilization facility, waste batteries storage cell and gaseous of storage collector and recycling system will take place in the scope of “Integrated Waste Utilization, Recycling and Aside Facilities with Construction and Management of Sanitary Landfill”. After the facility is settled down in the 30 decares of 100 hectares land, organic wastes will be recycled in the compost, power plant and gaseous of storage collector and recycling system facilities. And also, recoverable wastes will be recycled in the waste parsing, recover and recycling facilities. After these processes, recoverable wastes will be used as packaging material again and will gain economic energy consumption and conservation of
30 naturel resources. And also, especially, recycling of vitreous and metalic wastes will prevent mining wastes for many packages that are not remanufactured. On the other hand, emission of CO2 and other negative gases will decrease. Thus, it will reduce global warming and will effect positively on the environment.
Keywords: Waste, Recycling, Energy Conservation, Global Warming.
1- INTRODUCTION
Discarded by the manufacturer of the requested materials and waste must be disposed of in an orderly manner. With the Metropolitan Municipality Law, Municipality Law No. 5393 No. 5216 collection and transport of these substances according to district municipalities, the disposal is made by the metropolitan municipalities. Due to the increasing urban population; amount of waste is increasing. Therefore, wastes must be disposed with technical methods. The main components of municipal solid waste are paper, glass, plastic, metal and decay substances (organic waste), and inert substances. This is the amount of the basic components and vary from country to country, city to city, local conditions, seasons, depending on consumption patterns. In this study, Kızıllı Field Integrated Waste Landfill Solid Waste Facility obtained by the environmental and economic gains will be examined.
31
2 - EXISTING SOLID WASTE MANAGEMENT SYSTEM
2-1 - Antalya City
Antalya is 2171.26 km2 between the coordinates 39-52 N, 32-42 E. According to official data of 2011 the population of Antalya is 1,088,004 annual population growth is 3.2%. In the borders of Antalya Metropolitan Municipality; Aksu, Döşemealtı, Kepez, Lara and Muratpaşa districts are located and the waste from the settlements close to five counties are disposed in Kızıllı solid waste disposal site. Kızıllı Solid Waste Landfill Site is located 27 km from the city center, operated by the method of procurement services under the Public Procurement Law No. 4734.
2-2 - Waste Amount and Composition 2-2-1 - Waste Generation
Amount of solid waste coming to Solid Waste Landfill Ground Kızıllı for the last years is 3 481 613 tons per year. Kızıllı Solid Waste Landfill Site has been operated since 2003, 3,380,636 tonnes of domestic solid waste has been disposed.
32 ANNUAL WASTE AMOUNTS
269.707 326.041376.119366.939386.306 418.762 493.036533.042 210.684 0 100.000 200.000 300.000 400.000 500.000 600.000 2004 2005 2006 2007 2008 2009 2010 2011 2012 YEARS W A S T E A M O U N T S (T O N ) 2-2-2 - Waste Composition
62.58% of waste from landfill site is organic, 28.97% percent is recyclable, and 8.45%' i is the waste can not be evaluated. 8.75% recyclable wastes is paper and cardboard, 5:42% percent glass, 0.70%' s metal, 0.36% is electronics 13.74% percent is composed of plastic waste.
33
2-3 - Waste Management
34 With the Metropolitan Municipality Law, Municipality Law No. 5393 No. 5216 collection and transport of these substances according to district municipalities, the disposal is made by the metropolitan municipalities.
2-3-2 - Final Disposal (Treatment)
Disposal is the responsibility of the metropolitan municipality, service procurement method is operated under the Public Procurement Law No. 4734. The method of final disposal is landfill. Since 2003 under the first stage of the work, landfill has been completed in 4 lots. If the landfill continued to be done until the year 2029, a total of 6 stages would be completed and 671 581 m2 area would be used
.
2-3-3 - Financial Status
For the waste disposal brought and collected by Antalya Metropolitan Municipality and municipalities in the district no fee is charged. According to parliamentary resolution No. 530 dated 28.11.2011, the areas outside the borders of metropolitan municipality, TL 32.70 is charged per tonne for domestic waste. Outside the boundaries of metropolitan municipalities, 54713.5 tons of domestic waste were brought in 2009, , 97398.45 tons in 2010 and in 2011 121,558.35 tons were brought for disposal. 91223.433 tons were the last three year's average.
35 The final destination of integrated waste management model is the evaluation of waste to maximum extent and to minimize the amount of waste sent to landfill. After the acceptance of waste site model of integrated waste management will be directed to the facility or storage area according to the content. Wastes subjected to sorting will be separated as recyclable waste, organic waste and residues by their type. Organic waste will be directed to composting facility, recoverable waste will be directed to companies about recycling. After sterilization of medical waste, it is directed to the storage area regularly. Temporary storage will be created for the waste batteries and this waste will be directed to the relevant authorities. The investment cost of the facility by ITC is approximately TL 45 million, and Antalya Metropolitan Municipality will take 1% of annual turnover and rent of TL 160 000 TL for the first year. The rent will be updated each year by CPI.
Plant Plant Capacity
Fermentation System 400 tons / day Waste Separation and Recycling
Plant
2000 tons/day Medical Waste Sterilization Plant 4-6 tons/day Electric Power Generation Plant 8.0 MW
36
3-1 - Integrated Waste Management Flow Chart
Integrated Waste Management System 3-2 - Separation and Recycling Plant
Planned to establish an area of approximately 5000 m2 which will consist of two lines, the facility will be approximately 2000 tons / day capacity. Mixed household waste will be accepted to the facility, as a result of the parsing process; organic wastes and recyclable wastes will be obtained. Organic materials will be sent to fermentation plant, recyclable materials
37 can be used in recycling industry. Recyclable waste will be separated as recycled paper, metal, plastic, glass and so on in the plant.
3-3 - Medical Waste
With licensed medical waste collection vehicleand staff appointed for medical waste collection medical waste will be collected on a regular basis. In the facility to be built in accordance with provisions of the Medical Waste Control Regulation and the European norms EN 866-3 and / or TS EN ISO 11138-2/3 "Biological systems for testing the sterilization process units" standards, will be used whether infected waste, subjected to sterilizing, is harmless or not; using chemical and biological indicators. During and after the sterilization process in air and water; precautions will be taken in a way that there isn’t any contamination and toxicity. It is planned to sterilize medical waste approximately 4-6 tons / day in the facility.
3-4 - Energy Production, Efficiency and Environmental Benefits
Gas, resulting from organic waste gained from waste stored in the area and new arrivals since 2003, will be used in electricity production.Approximately 8 MW / day electrical energy is planned to obtain in the facility. In addition, the use of recyclable packaging back for recycling waste, energy and natural resources will be saved, they will be used for reproduction, re-production
38 of glass and metal waste will be revealed, especially the formation of mineral waste will be prevented, Reducing emissions of CO2 and other gases will contribute to slow down global warming.
The annual average 481,613 tons of household waste is 139523.3 tons of recoverable, approximate distribution is as follows: Paper&Cardboard : 41.857 tons Glass : 26.509,4 tons Metal : 2.790,5 tons Electronic : 1.395,2 tons Plastic : 66.971,2 tons
41 857 tonnes from an area for disposal of paper / cardboard waste recycling; annual:
• 519 026 800 m3 of CO2 greenhouse gas disposal • more 519 026 800 m3 of formation of O2
• 16,073,088 m3 of water saving • 219 749 250 liters of fuel-oil savings • 100,456.8 m3 of storage space savings
• 171 613 700 kw / h of electricity savings will be provided.
In addition, glass waste has 100% recyclable characteristics. In a ton of glass recycling 100 liters of petroleum product is prevented. Also, because of the melting of soda ash and limestone for glass production, the decomposition of the CO2 is revealed. The recycling of glass prevents this and greenhouse gas emissions, also for 1 ton of glass, 1.2 tonnes of primary raw materials
39 saving is provided.
26509.4 tonnes recycling of glass waste for disposal in the area,
• 2.65094 million liters of fuel savings
• 31811.28 tonnes of primary raw materials saving • 80% reduction in mining waste
• a 20% reduction of air pollution, , 50% reduction of water pollution will be provided.
In a ton of plastic recycling, 1.8 tons of oil products are prevented, and 14,000 kW of energy savings is provided. 66971.2 tons of plastic waste for disposal from the recycling area,
• 120,548.16 tons of fuel savings
• 937 596 800 kw of energy saving will be provided. In one ton of metal waste recycling, 1.3 tons of bauxite, 15,000 liters of cooling and with 860 liters process water saving and 1083 m3 of CO2 and 0.616 m3 of SO2 emissions are reduced.
2790.5 tons of metal waste for disposal from the recycling area,
• 3627.65 save tons of bauxite
• 41,857,500 liters cooling, and 2.39983 million of process water savings
• reduction of 3022111.5 m3 of CO2 and 1718.948 m3 of SO2 emission will be provided.
40 positive contribution to the economy will be provided. With all these processes, less evaluated waste and residue can be disposed and storage life of sanitary landfill site will be increased. The land which is a scarce resource, will be used effectively.
Resources
ITC Solid Waste Management Implementation Report 2012
Kızıllı Solid Waste Landfill Site Implementation Project 2007
Landfill of Waste Regulation on the Ministry of Environment and Forestry, 2010
Municipality Law No. 5393
Metropolitan Municipality Law No. 5216 Public Procurement Law No. 4734
EN 866-3 and EN ISO 11138-2/3 "Biological systems for testing the sterilization process units" standards
Antalya Metropolitan Municipality Waste Quantity and Composition Data
41
RESULT ORIENTED PRODUCT SERVICE
SYSTEM BASED ENERGY PROVISION Ferhat KARACA1, 2, Fatih CAMCI1
1
IVHM Centre, Cranfield University, Bedford, UK
2
Fatih University, Engineering Faculty, 34500, Buyukcekmece, Istanbul, Turkey
ABSTRACT
Utility service provision is one of the most important aspects of modern life. Households are served with many different utilities such as water and energy (e.g., gas, electricity). All these utility provision is billed to the customer based on product (material, quantity or volume) count. In other words, people buy the products in various amounts. Today`s market moves from product sale to service sale in many areas. Selling the service is popular, since the users are interested in the service provided by the product rather than the product itself. This is often a win-win situation for both companies and the customers. Companies may increase their profit by increasing the efficiency of their products, whereas the customers do not deal with the operational hassles such as maintenance or repair of the assets. Thus, the shift from product-based utility provision to service based one has potential to create greater impact on reaching sustainable and eco-friendly solutions. This paper suggests and discusses a new idea of result oriented service based utility provision
42 with its opportunities and challenges. This suggested approach offers a radical shift for the responsibility of implementing relevant energy efficiency measures (e.g. insulation) of assets from end-users to the providers. In such a business model, for example; a service provider sells the indoor temperature of a house rather than cubic meter of gas or kW of electricity. This requires evaluation of energy efficiency of each building (e.g. houses, schools, campuses, companies, business centers, apartments, residential sites, etc.) for billing.
Keywords: Product Service System; carbon footprint;
mitigation strategies; energy efficiency; future technologies.
1 INTRODUCTION
Utility service provision is one of the most important aspects of modern life. Households are served with many different utilities such as water, energy (e.g., gas, electricity), and communication. Creating more comfort using fewer resources has been a great pressure on humanity in recent decades. Energy provision as service and its utilization involves interactions of many actors such as; end users (i.e., customers), energy provision companies (i.e., providers), construction companies of buildings, manufacturers of devices that consume energy and companies that maintain/repair these devices [1, 2]. Each actor in this network has its own objective to achieve, which does not necessarily lead to overall best. Delivering better, more widely available energy sources and services is the main goal of the providers. However,
43 the reduction of energy consumption is not their main objective, in contrary more energy demand means more profit for the providers [3]. On the hand, customers (e.g., residents, companies, or institutions) do not specifically demand energy utility products (e.g. electricity, gas, coal, etc.), but rather they need the services provided (e.g. heating, cooling, and cooking, etc.). Contrary to energy providers, energy consumers desire to decrease their energy consumption to pay fewer bills with sacrificing less on their comfort.
In this study a novel product service system (PSS) based idea on utility service provision was suggested and discussed. This new PSS design has a potential to remove or change the fundamental assumptions regarding the roles and objective of the actors in the energy service provision network by a new business model ‘selling service rather than material/power supplied’. This business model has potential to contribute to fulfil the future energy requirements and to increase the possibility of reaching the overall best for the network. Even though utility service provision can be discussed in general, the main focus of this paper is energy provision, which will be in the rest of the paper.
The structure of this paper is as follows: Definition of PSS business models are given in Section 2. Some tools and methodologies for the evaluation and development of a new PSS design are highlighted in Section 3. Literature review about the existing PSS designs and suggestions in energy provision sector are given in Section 4. In Section 5, the suggested PSS business model for energy service provision with its opportunities and challenges is discussed. Section 6 concludes the paper.
44
2 PRODUCT SERVICE SYSTEM (PSS)
In literature there are several definition of PSS and its types [4 and reference herein]. Tukker and Tischner (2006) identified four main components in all available PSS definitions: i) a product service, ii) actors network and governance structure, iii) eco-efficiency manner, and iv) sustainability. Recently, one of the best definitions of PSS is given by Yang et al. [5] as “a focus shift from
selling just products to selling functions through a mix of products and services while fulfilling the same consumer
demands with less environmental impact”. Product
Service System (PSS) is basically the concept of selling the service that the customer needs rather than the product itself. It is recent business trend to deliver a complete PSS in many different areas such as office furniture sales [6], aerospace and defence industry [7], point-of-care biomedical devices [8], bring-in waste glass collection [9], the adoption of micro-factory retailing in the automotive industry [10], and the design of a telecentre [11]. In a PSS model, customers directly satisfy their needs by the service provided without dealing with management issues of the product such as repair/failure of the car. On the other hand, PSS offers more profit for the providers by expending their businesses. When the providers take the responsibilities (e.g. maintenance and repair) they will be more powerful and efficient in the business than customers in dealing with such issues and they may better increase the efficiency of the product in use by introducing effective
45 operational support.
Three types of PSS are available as business models; product-oriented, use-oriented, and result-oriented [4, 5]. Product-oriented services are dominantly turned on sales of products and not focussed on the services, but some extra services can be provided. Selling household appliances and providing routine, maintenance and repairmen services (if any needed) for them can be a typical example of this business model. This model also implies that the provider can offer to make a maintenance contract, a financial scheme, the supply of consumable, and an end-of-life take back agreement. In use-oriented services, the product is owned by the provider, and the service provided by the product is paid by the user, and sometimes shared by a number of users. For example, the provider can provide shared photocopy machines and the user only pay for the number of printouts. The provider is also responsible to provide all consumables (papers, cartridges, etc.) and related services (repairs, maintenance, replacements, etc.). This model can be subcategorised into four different model; product lease, product renting or sharing, product pooling, and pay per service unit [4]. In the last one, the result-oriented services, the provider and customer agree on a result, they do not predetermine on any product involved. The provider guaranties the quality of service and provides it by any means of any products and services. Activity management or outsourcing, and functional results are the specific types of the result-oriented services.
Result oriented PSS design can be a good strategy in achieving social, economic and environmental sustainability in energy sector. The concept of the PSS
46 model in utility provision sector also suggests a systematically shift from selling the household utility products to selling functions through a mix of products and services. This requires a change of focus from traditional ‘pay as you consume’ oriented approach, which concentrate on intensive use of energy, to ‘pay as you satisfy your needs’ which have a potential to save energy and provide better service.
3 EXISTING PSS DESIGNS AND SUGGESTIONS IN ENERGY PROVISION SECTOR
There exist studies and applications in the literature suggesting PSS designs and ideas for energy utility provision systems and product-service mix business solutions [5, 12-17].
A real life example of the MEPSS has been realised by the French electricity provider Electricité de France (EDF) to develop a new, integrated product service offer [13]. In this case study, EDF offered an individual diagnostic tool that enables each home to get a detailed view of its electricity consumption, and suggests a range of possible solutions to optimise electricity consumption. However, they only focused on electricity usage and consumption, and they did not offer a complete solution for all type of household energy utilisation, e.g. gas and electricity.
Another case study of MEPSS methodology was studied by Parkersell [14]. They developed a product service integrated lighting system solution, a typical energy utilisation application providing more efficient in life cycle costing and environmental improvement for
47 Sainsbury. Similar to previously example of MEPSS they had particular target providing “cradle-to-rebirth” lighting solutions, including design, installation, maintenance and recycling.
Eastern Energy is one of the energy service providers in the UK. Recently they decided to offer services to their business customers to help in monitoring and saving energy, e.g. sub-metering, energy management data through load consumption and profiling, process monitoring, training in utility awareness, and post training facilitation as well [17].
Yang et al. suggested a typical scenario for realizing product-oriented PSS for the life cycle assessment of the household appliances (e.g. fridge/freezer) [5]. Electrolux initiated a similar PSS business model and offered households on the Swedish island of Gotland free washing machines with functional sales. Their offer aimed not to sell a washer, but consumers pay according to how much they use it, and it covers the cost of installation [12]. This was a pilot project called Pay-per-Wash. They stated that this idea was feasible, since the Gotland Island in Sweden was the only place in the world at that time with intelligent electrical meters installed in 7000 households, which allows for remote reading. In a recent study, Steinberger et al. suggested a performance-based energy economy (PBEE). They explored the implications for energy suppliers and consumers as well as the conditions for PBEE diffusion and consequences for technological changes [16]. They suggest an application of the performance economy (such as PSSs or performance contracting) for energy-using equipment manufacturers to improve their
48 competitiveness.
Vercalsteren and Geerken reviewed possible and existing PSS designs in the sector of households. Their key emphases on the requirements of PSS in the household sector are mostly related to the social structure of the population (e.g. the tendency of having smaller houses as a result of the falling share of large families, and increasing in the age of the population, more seniors in the society) [15]. They classified household PSS applications into four main groups; after sales services, shared distribution networks, hiring/leasing, and contracting people. In their study they addressed household management systems that can be potential PSSs which cover advisory /consultancy service to advise households on possible energy savings and installation of meter in households, according to the principle ‘to measure is to know’. However, there is not a complete solution addressed for the household energy utilisation problem in their study.
The literature review revealed that there is no available PSS business model which offers a complete solution for energy utilization for customers (e.g. houses, schools, factories, business centres, and any commercial buildings). In our suggested model the household utility products, electricity, gas, etc., are substituted by services, e.g. adequate level of comfort, continues (no wall socket option) or batch energy supplies for appliances, devices and work equipment, which can be owned or bought, run and maintained by the energy service provider. The physical products are not identified or billed. This PSS concept can be classified as a result-oriented (functional result) PSS [4]. Here the provider agrees with the
49 customer to deliver the results; ‘space heating and cooling’, ‘running cost of household /work appliances and devices’, and ‘providing energy for any other activities including leisure time activities’. The provider in principle is fully free to choose the utility products and services, as well as the appliances and energy transformation systems to deliver the customer’s needs. There is a significant difference between this PSS model and the above mentioned applications. This model is not only focus or deliver one particular utility product (e.g. electricity), but also include energy transformation systems and devices, several tangible and intangible services (e.g. education, insulation) and functional results (e.g. pay-per-service unit for laundry). It offers a wide range of availabilities to use any proper energy sources, devices and functional results to cover the customer’s needs in a building which maybe houses, schools, factories, business centres, and any commercial buildings.
4 SUGGESTED PSS IN ENERGY PROVISION SECTOR
This design has some aspects of the PSS which includes a new organizational structure and new actors. It also addresses the changes in the customer and provider perspectives. Related aspects of the suggested PSS model are discussed in the following sections. Firstly, we identified new actor network and discussed the possible role changes and their effects on the energy market. Second, the assets of this new design were identified and discussed. Customer requirements (CRs) are of the
50 important aspects of a business model. The PSS planning approach can improve product competitiveness for the providers to better satisfy customer requirements (CRs) through providing both higher quality products and services. Consequently we discussed this component in the third order. As well as these management oriented aspects, a reliable technological infrastructure should be provided to setup up this business model. Thus, the need of a smart and reliable communication and data transfer/acquisition system is discussed in forth order. Recently PSS designs have been taking great attention due to their potential to offer sustainable and eco-friendly business solutions by compensating the ‘blind side’ of the energy market. In the last order, these two aspects are focused under the subtitles ‘Life Cycle Assessment of the devices’ and ‘implementing energy efficiency measures’ focusing on the sustainably and eco-friendly solutions.
4.1 Identifying the new actor network
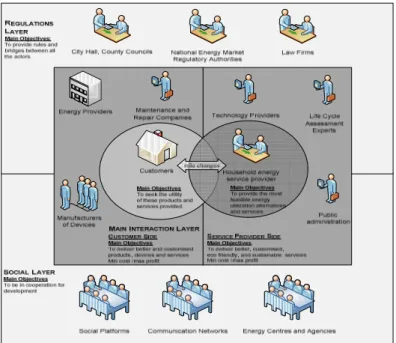
The actors of the current household energy provision network are summarized in three layers (main, regulations, and social) which are located outer peripheries according to their relations to customers, as illustrated in Figure 1. In the existing business model, customers are located at the centre of all the interactions. This logic characterizes a centric actor model [2]. The main interaction layer, the first outer one, involves four actors: customers (energy consumers), energy providers (represents energy production, energy distribution, or contracted sellers), manufacturers of devices that use energy at buildings, companies specializing on
51 maintenance and repair of devices or assets. Customer has a direct relationship with all the actors in this layer by buying products or services. The regulatory layer is the second layer. The objectives of the actors in this layer are to establish a financially viable, stable and transparent energy market. This energy market functions in accordance with “the provisions of private law and within a competitive environment to ensure the independent regulation and supervision of the market in order to provide sufficient ” energy utility products (electricity, natural gas, petroleum and LPG) in a good quality to consumers, at low cost, in a reliable and environment friendly manner. The last interaction layer is the social layer. The actors in this layer have similar objective as the regulatory layer, but they have no law power, but social power on the market and all the actors.
52
Figure 1. Actors of the current household energy
provision business and their key objectives
Suggested PSS design involves several partners, each of them has its own motivation (e.g. goals, expected results and problem-solving criteria) [11]. Shifting from product sale to service sale requires re-designing the actor network. The actors network in the sub-processes in this PSS design is combination of household utility product producers/companies, technology providers, device or equipment providers and suppliers, building industry, local software providers, system providers, client organizations, local and regional authorities,
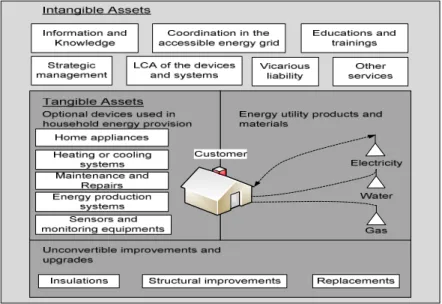
53 communication networks, social platforms, energy centres and agencies, local energy suppliers, etc. As a result of role changing possibilities of two main actors (customer and service supplier), the centre of the model would be shifted from customer to service provider in this new PSS design. The roles of other partners involved in the sub- process in this business model, e.g. boiler or a house appliance providers, are addressed. A schematic presentation of identified new actor network and the key objectives of the each layer are given in Figure 2.
Figure 2. Actors of the suggested PSS business model
for household energy provision service
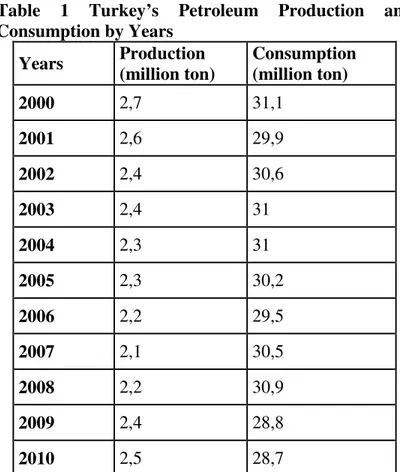
54 In this business model, service provider will be responsible to provide abstract/intangible (technology, database, blueprints, reputation, networks, etc.) and concrete/tangible (financial and physical) PSS assets that are required for service provision, e.g. utility products, materials, devices, and services for household energy provision. These assets include some activities and devices to maintain ambient temperature (heating and cooling) on a comfort level, to provide indoor air quality comfort (air filtration, ventilation, and dehumidification), to provide energy for working household appliances (for food preparation, daily activities, leisure time activities, work devices, machineries and equipment can also be included into system under specific agreements, etc), and to provide adequate level of water for all type of consumptions.
Assets of the PSS model were classified into two sub-groups; tangible and intangible assets (Figure 3). Figure 3 summarizes all the assets classified based on their characteristics. Intangible assets covers and they are related to the tangible assets. Intangible assets include 7 main components from ‘information and knowledge’ to ‘vicarious liability’. Information and knowledge are explicitly represented among intangible assets. SP can provide all these services or buy from other actors. In the case of second alternative, any other actor, hired by the SP, will not bill to the customer but to the SP. This is one of the key ideas in our PSS deign. Coordination in the accessible energy grid is also of the important intangible assets in this PSS. Recent improvements in the energy sector showed that, future energy grids will not only
![Fig. 1: Motorization in different OECD- and emerging countries (Road vehicles per capita) in 2007 (figures for India and Turkey estimated based on values from 2005) (Sources: [2-4])](https://thumb-eu.123doks.com/thumbv2/9libnet/4417538.75479/11.630.114.527.371.602/motorization-different-emerging-countries-vehicles-figures-estimated-sources.webp)
![Figure 2. Impact factors on CO 2 emissions in the car passenger transport sector (Source: [8])](https://thumb-eu.123doks.com/thumbv2/9libnet/4417538.75479/13.630.99.565.135.486/figure-impact-factors-emissions-passenger-transport-sector-source.webp)
![Figure 3. Evolution of CO 2 emissions from new passenger cars by association (adjusted for changes in the test cycle procedure) [11]](https://thumb-eu.123doks.com/thumbv2/9libnet/4417538.75479/18.630.112.524.115.392/figure-evolution-emissions-passenger-association-adjusted-changes-procedure.webp)
![Figure 4. Normalised development (1990=1) of vehicle km driven (vkm), energy consumption (E) and fuel intensity (FI) of stock of vehicles in EU-15 from 1990 to 2010 [13]](https://thumb-eu.123doks.com/thumbv2/9libnet/4417538.75479/20.630.116.526.193.517/figure-normalised-development-vehicle-energy-consumption-intensity-vehicles.webp)
![Figure 5. Normalised development (1990=1) of fuel intensity (FI), power-specific fuel intensity (FIP) and power of new vehicles in EU-15 from 1990 to 2010 [13] A major problem recognised in EU countries is that despite better fuel e](https://thumb-eu.123doks.com/thumbv2/9libnet/4417538.75479/21.630.122.539.369.629/normalised-development-intensity-specific-intensity-vehicles-recognised-countries.webp)