RESEARCH
The effects of activator and co-dopant concentrations
on the photoluminescence properties of (Ba,Ca)
2
SiO
4
compound
Erkul Karacaoglu1&Mert Gul2
Received: 24 January 2017 / Accepted: 25 May 2017 / Published online: 8 June 2017 # Australian Ceramic Society 2017
Abstract A series of M2SiO4-based phosphors (M:
alkaline-earth metal), (Ba,Ca)2SiO4:xEu, yMn, and zDy were
synthe-sized by the solid-state reaction method. The XRD results showed all diffraction peaks of samples comply well with the T-phase (Ba,Ca)2SiO4, JCPDS#36-1449. Moreover, there were
no obvious shifting of peaks or other impurity phases detected except that only higher levels of activator Eu-ion doping or Dy3+co-doping among the current doping levels. The excita-tion spectrum of all samples shows a broad band and implies that these phosphors can be excited by the range UV region to 500 nm and may be recommended for white LEDs. The strong emission peaks observed in the red region, excited by 360 or 421 nm, corresponding to the4T-6A forbidden transition of Mn2+ions and weak peak of the blue to green broad emission bands observed at 466 nm is due to f-d transitions of Eu2+ions. Also, it was proved that Dy3+co-doping in different concentra-tions enhances the photoluminescence intensities.
Keywords (Ba,Ca)2SiO4. Inorganic phosphor .
Photoluminescence . Rare earths . T-phase
Introduction
Mn2+ions can effectively absorb UV light and then emit dif-ferent colors from green to deep red depending on the
surrounding crystal field strength. In studies conducted so far, red or white phosphors have been successfully obtained by adjusting the concentration ratios of Mn2+/Dy3+or Eu2+/ Dy3+. Therefore, it was concluded that the Mn2+ions may effectively cause the red emission of (Ba,Ca)2SiO4lattice as
a red-emitting center with suitable doping concentration [1]. In this study, a spectroscopic study of the different amounts of Eu2+-activated and Mn2+ co-doped luminescence in (Ba,Ca)2SiO4 lattice is investigated. The emitting color of
Eu2+and Mn2+strongly depends on the host because of the sensitivity of the Eu2+ d–f and Mn2+d–d transitions to the crystal field. So, the possible nature of the Eu2+−Mn2+ions used in the lattice of (Ba,Ca)2SiO4is also mentioned, as well
as the possible mechanisms for the Eu2+ → Mn2+ energy transfer process. The investigation of this system is important to find more effective luminescence materials, which may be used in very efficient white LEDs. In fact, an efficient sensi-tization of the luminescence of Mn2+ by the Eu2+ ion is achieved by the excitation of the strong UV Eu2+f→ d tran-sition. In addition, it was clearly known that the Dy3+ions often form highly dense trapping levels with the most suitable depth to achieve intense and long phosphorescence in the Eu2+-doped and Dy3+co-doped systems [2,3]. Dy3+ions used as co-doping agent in this system to efficiently enhance lumi-nescence intensity.
Methods and procedures
According to the systems being determined, a series of (Ba,Ca)SiO4: xEu, yMn and (Ba,Ca)SiO4: xEu, yMn, and
zDy phosphors were prepared from a stoichiometric mixture of CaCO3(A.R., 99.9%), MnO2(A.R., 99%), BaCO3(A.R.,
99.9%), SiO2(A.R., 99.7%), Dy2O3 (A.R., 99.99%), and
Eu2O3(A.R., 99.99%) were thoroughly mixed, ground in a
* Erkul Karacaoglu [email protected]
1
Department of Metallurgy and Materials Engineering, Karamanoglu Mehmetbey University, Karaman, Turkey
2 Department of Materials Science and Engineering, Afyon Kocatepe
planetary mill with propanol-2, dried and transferred to high purity alumina boats, and sintered under a reducing atmo-sphere (5% H2/95% N2) at 1000–1400 °C for 1–5 h to reduce
from the Eu3+-ionic state to Eu2+and then cooled slowly to room temperature in the furnace and ground again into pow-der form. Only the first synthesized (Ba,Ca)2SiO4:Eu, Mn
phosphor was sintered in open atmosphere so the europium had the 3+-ionic state.
Following the weighing and milling, the differential ther-mal analysis (DTA) and thermogravimetric (TG) analyzes at a heating rate of 10 °C/min in an inert argon atmosphere from room temperature to 1200 °C were performed to determine the decomposition and the oxidation process of the starting mate-rials. The pre-sintering process was applied based on thermal analysis. The X-ray diffraction (XRD) analysis of samples were achieved using Rigaku Rint 2000 X-ray diffractometer using Cu Ka radiation at a scanning rate of 2°min−1in 2θ range from 10° to 70° to determine the phases after sintering. The photoluminescence analyses (excitation and emission spectra) of the synthesized phosphors were obtained by a spectrofluorometer (Photon Technology International (PTI), QuantaMasterTM30).
Results and discussion
Thermal analysis (TG/DTA)
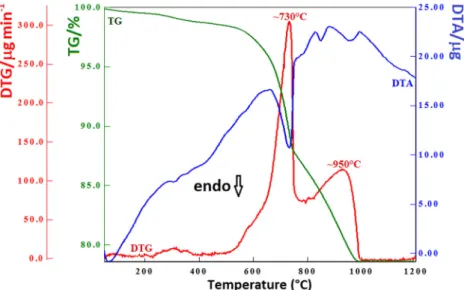
Figure 1 shows the reactions with two-step decomposition mechanisms of the (Ba,Ca)2SiO4, in the first, the
decomposi-tion of calcium carbonate (CaCO3) which was used as raw
material to get CaO; in the second, the decomposition of bar-ium carbonate (BaCO3) which was used as another raw
ma-terial to get BaO, and then CaO and BaO react with silicon oxide (SiO2) to produce (Ba,Ca)2SiO4. The approach was to
obtain firstly the decomposition reaction of carbonates of
calcium and barium to determine the parameters that control the sintering process then the results used to optimize the solid-state reaction of oxides. Although the weight loss should start slowly within the temperature range of 25–1000 °C, and the high weight loss steps should be occurred above 1000 °C caused by the decomposition of BaCO3according to literature
[4], the decomposition process started at lower temperatures (~460 °C) and ended before 1000 °C in this research. These results originate from the using of boric acid (H3BO3) as flux
agent in this system.
Considering the TG curve, the weight loss was slow within the temperature range of 50–540 °C, and the two high weight loss steps occurred above 540 °C caused by the decomposi-tion of carbonates. For the maximum weight loss at about 730 °C, the DTA curve corresponded to the endothermic peak near at that temperature. In addition, there were also three small endothermic peaks at 311, 849, and 956 °C, respective-ly, in the DTA curve. The decomposition of BaCO3reveals
that 849 °C was the phase transition temperature forγ to β phase, and 956 °C was that for β to α phase, which was consistent with the theoretical values [4]. The loss weight associated with the total process is about 20.30%. Therefore, reaction temperatures above 1000 °C are necessary for a com-plete reaction to (Ba,Ca)2SiO4.
X-ray diffraction (XRD)
Figure 2 shows the XRD patterns of first synthesized (Ba,Ca)2SiO4:Eu2+, Mn2+phosphor which was sintered in
reducing atmosphere. The sample was identified as T-phase (JCPDS#36-1449) with no obvious shifting of peaks or other impurity phase can be detected at the current doping level of rare earths. It is known that the T-phase structure belongs to the space group P3m1 with hexagonal unit cell parameters: a = 0.575 nm and c = 0.1467 nm for Ba1.30Ca0.70SiO4. As
shown in Fig.3, The T-phase is made of five Ba/Ca sites (one
Fig. 1 Thermal analysis results of (Ba,Ca)2SiO4host structure
M(2)O6octahedron, four M(1, 3, 4, 5)O10 or 12polyhedra) and
two SiO4tetrahedral sites. The M(2) site has a doughnut-like
shape surrounded by a six-oxygen ring and is the smallest of the five sites. The M(1) and M(4) sites are tightly bonded with the M(2) site by sharing the oxygens O(3, 5, 7) and O(3, 4, 8), respectively, as shown in the inset [1,5].
The determined lattice parameters are (Table1) compared with the standard T-phase crystal, and the value ofa, c, and V has barely changed, which indicates that Ca2+can be partly replaced by rare earth ions Eu2+ and Mn2+ ions without change of crystal structure.
The XRD patterns of (Ba,Ca)SiO4:Eu2+, Mn2+,yDy3+with
varying Dy amounts (y = 0.006, 0.02, 0.06, and 0.1 mol) at fixed Eu2+and Mn2+concentrations are given in Fig.4.
Figure2proved that all diffraction peaks of these samples comply well with the T-phase, JCPDS#36-1449, no obvious
shifting of peaks or other impurity phase can be detected ex-cept that only higher levels of Dy3+co-doping among the current doping levels. There are some small impurity phases occurring for 0.06 and 0.1 mol concentrations of Dy3+. The determined lattice parameters of different concentrations of Dy3+and base sample are (Table2) compared with the stan-dard T-phase crystal. According to results, the value ofa, c, andV has barely changed, which indicates that Ca2+can be partly replaced by rare earth ions Eu2+and Mn2+ions without prominent change of crystal structure.
The XRD patterns of (Ba,Ca)2SiO4: xEu2+, Mn2+ with
varying Eu2O3 amounts (y = 0.006, 0.06, 0.15, and
0.25 mol) at fixed Mn2+concentrations are given in Fig.5. Figure5showed that all diffraction peaks of these samples are suited well with the T-phase, JCPDS#36-1449, no obvious shifting of peaks or other impurity phase can be detected ex-cept that only higher levels of activator (Eu2+) among the current doping levels. There are three some impurity phases for only 0.25 mol of Eu2+. The determined lattice parameters of different concentrations of Eu2+ and base sample are (Table 3) compared with the standard T-phase crystal. The value ofa, c, and V has barely changed, which indicates that Ca2+can be partly replaced by rare earth ions Eu2+and Mn2+ ions without prominent change of crystal structure.
Photoluminescence (PL)
The excitation and emission spectra of first synthesized (Ba,Ca)2SiO4:Eu2+, Mn2+in reducing atmosphere monitored
Fig. 3 The T-phase (Ba,Ca)2SiO4host lattice viewed in thec plane (a)
and in thea plane (b) as crystal structure [5]
Fig. 2 XRD patterns of first synthesized (Ba,Ca)2SiO4: Eu2+, Mn2+
phosphor
Table 1 Unit cell parameters of (Ba,Ca)2SiO4:Eu2+, Mn2+phosphor
Sample a/Å c/Å V/Å3 Z Density
Base sample 5.738 14.637 417.40 4.0 4.7682 Standard T-Phase 5.749 14.664 419.73 4.0 4.7418
Fig. 4 The XRD patterns of (Ba,Ca)2SiO4:0.12Eu2+, 0.06Mn2+,yDy3+
with varying Dy2O3amounts (y = 0.006, 0.02, 0.06, and 0.1 mol) at fixed
at 605 nm maximum for emission and 421 nm maximum for excitation are shown in Fig.6. The PL results are related with Eu2+rare earth ions transitions. Firstly, the excitation peaks of this system contain several bands centered at 292, 364, 394, and 420 nm. The excitation spectrum shows a broad band and implies that this phosphor can be excited well at UV region. Then, the strong emission peak observed at 604 nm, excited by 360 or 420 nm, corresponding to the4T-6A forbidden tran-sition of Mn2+ions. Weak peak of the broad blue to green emission bands ranging from 400 to 550 nm observed at 466 nm is due to f-d transitions of Eu2+ions [5]. Because the blue emission has the same characteristics (peak position and half width) as the Eu2+emission observed previously in similar researches [5], it was attributed to the electronic tran-sition 4f65d(Eg)→ 4f7(8S7/2) of Eu2+ions [6]. The reasons of
this broad band are the convolution of the spectra from the five different Eu2+ions which are substituted at the five different Ca/Ba sites in the T-phase (Ba,Ca)2SiO4:Eu2+, Mn2+ [7].
Additionally, the significant spectral overlap of excitation and emission bands in Fig.6indicates that the (Ba,Ca)2SiO4
host may exhibit an energy transfer between sensitizer Eu2+ and activator Mn2+[8].
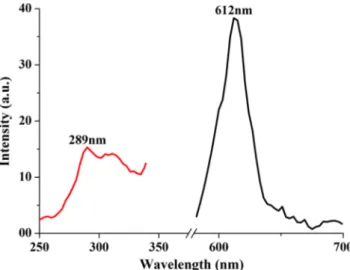
In the Fig.7, the PL results of first synthesized which was sintered in open atmosphere. So, PL results are related with Eu3+rare earth ions transitions. The presence of the emission band at 612 nm was observed in the PL spectra, which is attributed to the 5D0 → 7F2 transition of the Eu3+ [9].
Although the dominant red emission from5D0→7F2
transi-tion indicates the inversion antisymmetry crystal field around Eu3+ion in the present phosphor, which is favorable to im-prove the color purity of the red phosphor, its band intensity is very low to detect. Also, it could not detect the Mn2+ transi-tions. Therefore, the PL results prove that (Ba,Ca)2SiO4:Eu3+,
Mn2+phosphor gives no effective phosphorescence property in red region. The reducing atmosphere sintered samples had prominent emission properties. Thus, the researches continued as sintering process in reducing atmosphere to get 2+-ionic state of Eu.
Figure 8 shows the PL spectra of (Ba,Ca)2SiO4: xEu2+,
0.06Mn2+with changing Eu2+concentrations while keeping the Mn2+concentrations fixed, under excitation by a light source at about 360 nm. All spectra of different Eu2O3
con-centrations consist of a relatively broad blue to green band and a red emission band similar to the starting batch. The broad blue to green emissions band from 400 to 550 nm and
Fig. 5 The XRD patterns of (Ba,Ca)2SiO4:xEu2+, 0.06 mol Mn2+with
varying Eu2O3amounts (x = 006, 0.06, 0.15, and 0.25 mol) at fixed Mn2+
concentrations
Table 2 Unit cell parameters of (Ba,Ca)2SiO4: Eu2+, Mn2+,yDy3+
phosphor
Sample a/Å c/Å V/Å3 Z Density
Base sample 5.738 14.637 417.40 4.0 4.7682 +0.006 mol Dy3+ 5.739 14.645 417.27 4.0 4.7581 +0.02 mol Dy3+ 5.741 14.657 417.12 4.0 4.7472 +0.06 mol Dy3+ 5.742 14.651 417.30 4.0 4.7592 +0.1 mol Dy3+ 5.740 14.642 417.74 4.0 4.7622 Standard T-Phase 5.749 14.664 419.73 4.0 4.7418
Table 3 Unit cell parameters of (Ba,Ca)2SiO4:x mol Eu2+, 0.06 Mn2+
phosphor
Sample a/Å c/Å V/Å3 Z Density
Base sample 5.738 14.637 417.40 4.0 4.7682 0.006 mol Eu2+ 5.739 14.641 417.21 4.0 4.7575 0.06 mol Eu2+ 5.742 14.653 417.10 4.0 4.7471 0.15 mol Eu2+ 5.743 14.651 417.27 4.0 4.7590 0.25 mol Eu2+ 5.747 14.647 417.71 4.0 4.7618 Standard T-Phase 5.749 14.664 419.73 4.0 4.7418
Fig. 6 Excitation and emission spectra of first synthesized (Ba,Ca)2SiO4:Eu2+, Mn2+phosphor which was sintered in reducing
centered at 420 nm are characteristics of the allowed 4f65d(Eg)→ 4f7(8S7/2) transition in Eu2+ions as mentioned
before [10]. The following reason of broadening of the blue to green region is from the spectral overlap off obtained different emission peaks associated with Eu2+ions substituted on each o f t h e f o u r d i f f e r e n t C a2 + s i t e s i n t h e T- p h a s e (Ba,Ca)2SiO4:Eu2+, Mn2+. This resulting intense red emission
is concerned with the4T1–6A1forbidden transitions of Mn2+
ions having ms order decay time [11]. It was showed up from the changing Eu2O3amount studies in the system that, as the
Eu2+concentration (x) is increased, the intensity of the blue to green emission band significantly decreases also the red emis-sion band decreases, but the excitation and emisemis-sion bands reach a maximum forx = 0.06 mol of Eu2O3. This apparent
decrease in the PL emission and excitation intensity for Eu with x > 0.06 mol is primarily due to the concentration quenching effect.
PL spectra of (Ba,Ca)2SiO4: 0.06Eu2+, 0.06Mn2+,yDy3+
with adding and changing Dy3+concentrations while keeping the Eu2+and Mn2+concentrations fixed, under excitation by a 360 nm source, as given Fig. 9. The results prove that all spectra of different co-doped Dy2O3concentrations consist
of a relatively broad blue to green band and a red emission band similar to the first synthesized sample. It was thought that the trap centers introduced by co-doping Dy3+ions obvi-ously may enhance the helpful to postpone the afterglow of Mn2+because of the Dy3+ions act as trap centers in many long-lasting phosphors doped with Eu2+ and Dy3+such as strontium aluminates [2,3]. With the increase of the concen-tration of Dy3+, the emission intensities reached the minimum when the corresponding concentration was 0.1 mol. Even this minimum emission, results have shown that higher emission intensity was obtained than first synthesized sample which has no Dy3+. The most effective excitation and emission spectra w e r e a c h i e v e d f r o m 0 . 0 0 6 m o l D y3 + u s e d (Ba,Ca)2SiO4:0.06Eu2+, 0.06Mn2+.
Conclusion
In this study, it is demonstrated the synthesis of two series of different concentrations of Eu2O3and adding the Dy2O3as
co-doping agent and its concentrations for (Ba,Ca)2SiO4host
structures via high-temperature solid-state reactions. The XRD results showed that all diffraction peaks of sintered sam-ples match well with the T-phase, JCPDS#36-1449, and no obvious shifting of peaks or other impurity phase can be de-tected except that only higher levels of Eu2+activator or Dy3+ co-dopant among the current dopant levels. So, it has been understood that the sintering conditions were well chosen for this structure. The excitation spectrum of all samples
Fig. 7 Excitation and emission spectra of first synthesized (Ba,Ca)2SiO4:Eu3+, Mn2+phosphor which was sintered in open
atmosphere
F i g . 8 Ex ci t at i o n a n d emi s sion spect ra of (Ba,Ca)2S i O4:
xEu2+
,0.06Mn2+phosphors dependence of different concentrations of Eu2+
Fig. 9 Excitation and emission spectra of (Ba,Ca)2SiO4: 0.06Eu2+,
0.06Mn2+,yDy3+phosphors dependence of different concentrations of Dy3+
shows a broad band in UV region and mean that all samples can be excited well by UV lights. When the samples were excited by 360 or 421 nm light, the strong emission peaks observed in the red region corresponding to the4T-6A forbid-den transition of Mn2+ions. The weak peak of the blue to green broad emission bands ranging from 400 nm to 550 nm observed at 466 nm is due to f-d transitions of Eu2+ions, and these results generate white light. Thus, this phosphor could be recommended as LED phosphor to get white light. Also, it was proved that Dy3+co-doping in different concentrations to the (Ba,Ca)2SiO4:0.06Eu2+, 0.06Mn2+phosphor enhances the
PL intensities.
References
1. Park, K., Choi, N., Kim, J., Kung, P., Kim, S.M.: Temperature and excitation power-resistant white-light emission of the T-phase (Ba, Ca)2SiO4:Eu2+, Mn2+ phosphor. Sol St Comm. 150, 329–332
(2010)
2. Karacaoglu, E., Karasu, B.: The effects of re-firing process under oxidizing atmosphere and temperatures on the properties of stron-tium aluminate phosphors. Mat Res Bull. 48, 3702–3706 (2013)
3. Yesilay Kaya, S., Karacaoglu, E., Karasu, B.: Effect of Al/Sr ratio on the luminescence properties of SrAl2O4:Eu2+,Dy3+phosphors.
Cer Int. 38, 3701–3706 (2012)
4. Xin, L.S., Bin, W.H., Ji-Chuan, H., Ming, L.: Influence of EDTA on the morphology of barium carbonate using high gravity technology. Chinese J Struct Chem. 31, 1483–1489 (2010)
5. Choi, N.S., Won Park, K., Park, B.W., Zhang, X.M., Kim, J.S., Kung, S.M., Kim, P.: Eu2+–Mn2+energy transfer in
white-light-emitting T-phase (Ba,Ca)2SiO4:Eu2+, Mn2+phosphor. J of Lum.
130, 560–566 (2010)
6. Mendez, A., Ramos, F.L., Riveros, H., Camarillo, E., Caldinä, O.G.: Energy transfer mechanisms in the KBr: Eu2+, Mn2+
phos-phor. J of Mat Sci Lett. 1, 399–402 (1999)
7. Shionoya, S., Yen, W.M.: Phosphor handbook. CRC Press, NY (1998)
8. Huang, C.H., Liu, W.R., Chen, T.M.: Single-phased white-light phosphors Ca9Gd(PO4)7:Eu2+, Mn2+under near-ultraviolet
excita-tion. J Phys Chem C. 114, 18698–18701 (2010)
9. Volanti, D.P., Rosa, I.L.V., Paris, E.C., Paskocimas, C.A., Pizani, P.S., Varelaa, J.A., Longo, E.: The role of the Eu3+ions in structure and photoluminescence properties of SrBi2Nb2O9powders. Opt
mat. 31, 995–999 (2009)
10. Zaitoun, M.A., Kim, T., Lin, C.T.: Observation of electron-hole carrier emission in the Eu3+-doped silica xerogel. J Phys Chem B.
102, 1122–1125 (1998)
11. Kim, J.S., Lim, K.T., Jeong, Y.S., Jeon, P.E., Choi, J.C., Park, H.L.: Full-color Ba3MgSi2O8:Eu2+, Mn2+phosphors for