Umut Cil
1. IntroductionSönmez (1990: 12) starts his book with the following words on the one hand: “It does not matter whether we are aware of it or not. Approximately 50 families or capital groups have managed Turkey. And the domination of these families has consolidated with every passing year. From economy to politics, from cultural life to the foreign policy, the decisions determining the destiny of 60 million have been decided by these big families or holding companies”. On the other hand, Buğra (1994: 187) emphasizes that “the decision to enter into a new area of activity is often taken via suggestions and recommendations of government authorities rather than through an evaluation of market signals”. It is obvious that there is an important relationship between governments and businesses. Moreover, as Çolpan, Hikino and Lincoln’s book (the Oxford Handbook of Business Groups, 2010) shows, it is important to emphasize that this is not only a case for Turkey but almost for all countries, particularly for developing ones because governments need some specific groups to help them for the growth and sustain it (e.g. Buğra, 1994; Çolpan et al, 2010; Çolpan and Hikino, 2008; Hoskisson, Johnson, Tihanyi and White, 2005; Khanna and Palebu, 2000; Tezel, 1982). Big business groups have undertaken the task of basic developmental actors of modern economic development in successful developing countries (Buğra, 1994; Çolpan et al, 2010; Çolpan and Hikino, 2008). In other words, there are mutual needs between them. In this context, despite the nuances, the holding companies or family holdings in Turkey is assumed under the same conceptual framework with the groups of Spain and South America, business houses of India, chaebol of South Korea, keiretsu of Japan and qiye jituan of China (e.g. Buğra, 1994; Çolpan and Hikino, 2008; Karaevli, 2008; Özkara et al., 2008).
The relationship between some giant business groups and governments is an important claim which is often expressed as a necessity to grow and make the achieved growth sustainable (e.g. Buğra, 1994; Schneider, 2010; Tezel, 1982). One of the most important reasons behind the frequent discussion of this claim is the growing interest in diversified business groups, which are frequently seen in developing countries as serious economic actors against developed countries (e.g. Colpan, Hikino and Linkoln, 2010). With diversified business groups that is defined by Colpan and Jones (2016: 69) as “the term business group has been used broadly to encompass quite different organizational forms, including network-type, diversified and pyramidal groups, even if most research has focused on 'diversified' business groups that are active in technologically unrelated businesses”, the studies on business groups and developing countries show that it is one of the most common growth options, although Nguyen and Cai, (2016) argue that diversification is a rare event. The diversification strategy, which is the most important growth method of these groups and the popularity of the diversification strategy has also constituted an important field of study (Colpan and Jones, 2016). In this context, while it is often claimed that the main motivations identified in the central countries are valid for the whole world, on the contrary, it is emphasized that cultural and national differences will also lead to differences in this field. This study also predicts that the main drivers will differ in different countries. For this reason, it is claimed that the adoption of the diversification strategy of business groups in Turkey, which has a different class from the central country in terms of the national business systems that Whitley presents, can be based on more political-based reasons than the main sources of motivation in the central literature. This study is tried to examine that, different motivations may be the subject of different political periods and even different groups may follow this strategy for various reasons due to different attitudes towards politics with the emphasis on the diversified business groups classification made by Schneider (2010). Therefore, the largest business groups in Turkey have been identified and six of them have been selected to examine the main sources of the motivation behind the adoption of the diversification strategy in different political periods.
Finally, it should be emphasized that in recent years there has been an increasing number of significant contributions from European and Asian countries, but almost all literature and the main
theories still arise in North America, which is the central country. In this study, it is anticipated that the data obtained from Turkey, which is in a different business system (State-Organized Business Systems) from North America (Compartmentalized Business Systems), will be important in terms of further enriching the literature.
2. The Growth of Business Groups
The growth of the businesses is carried out in several ways and they show significant differences among small, medium and large enterprises. However, we can classify them into two main groups; internal (organic) growth and external (inorganic) growth. Whilst the important examples of organic growth are product-related strategies, geographic expansion and integration; inorganic growth is merger and acquisitions, licensing, franchising and strategic alliances. Another important classification is concentration versus diversification strategies that are the main strategies under the corporate level strategies. With the words of Hofer and Schendel (1978, p.27) "corporate-level strategy is concerned primarily with answering the question of what set of businesses should we be in. Consequently, scope and resource deployments among businesses are the primary components of corporate strategy". While concentration refers to focus on the core businesses of companies and become an expert at the core businesses via generic strategies such as differentiation, low-cost leadership and focus; diversification refers the new lines or markets of activities.
Ramanujam and Varadarajan (1989: 525) define diversification as “the entry of a firm or business unit into new lines of activity, either by processes of internal business development or acquisition, which entail changes in its administrative structure, systems, and other management processes”. It can be related or unrelated to the companies’ core activities and it is named as “related diversification” or “unrelated diversification” based on its relationship (Ramanujam and Varadarajan, 1989; Rumelt, 1982). Diversification is done in two ways: The first one is to go to the diversification of products in the relevant market through forward integration, backward integration and horizontal integration. The second way is to go to the diversification of products in unrelated markets. This seen very risky for companies because they are new in a new market and they do not have sufficient information about it. However, Analoui and Karami, (2003) stated that this risk has been decreased over time.
It has been suggested that there are three main motivations behind the diversification strategies of organizations: growth, risk aversion and benefit from economies of scope (Karaevli, 2008):
Growth: When companies believe they have grown up to an advanced level in their main industry or market, they look for ways to invest in other areas.
To Benefit from The Scope of Economies: Another theoretical background is the motivation of benefit from economies of scope based on the field of industrial organization and organizational economics. According to this, by producing different products together, organizations diversify their operations across different product / service areas with the aims to spread the costs of production, advertising, distribution and management to various products and take advantage of the skills of these issues and the customer loyalty (Buğra, 1994; Chang, 2003; Çolpan and Hikino; 2008; Karaevli, 2008; Purkayastha, Manolova and Edelman, 2012).
Risk Avoidance: One of the benefits of the diversification strategy is, by operating in different areas, to spread the risk into different areas as possible and gain the flexibility to deploy resources from each other in independent business units (Baysinger and Hoskisson, 1990; Buğra, 1994; Çolpan and Hikino; 2008; Karaevli, 2008; Purkayastha, Manolova and Edelman, 2012).
Due to directly based on an economic background, the motivation of benefit from economies is the most acceptable reason behind diversification strategy (Chang, 2003; Karaevli, 2008). However, it is not easy to think that theories explaining the motivation of diversification of organizations in developed economies can explain the motivation and forms of diversification of business groups that emerged in developing countries which have different political, economic, legal and institutional conditions for the external environment (Wan, 2005). Since, as Karaevli (2008) also stated, these
theories cannot explain enough this high rate of diversification of family businesses that there is not a clear separation between ownership and management. If so, what are the main motivations of the largest Turkish business groups on diversification? The idea claiming that governments have a significant effect on the issue has become more spoken. Foreign trade and investment policies of the governments and incentives they offer in these areas have encouraged these business groups to invest in different sectors or export and caused to become a diversified company because these big groups want to seize opportunities (Chang and Choi, 1988; Guillen, 2000).
Picone and Dagnino (2016) have classified the main motivation of (unrelated) diversification into three class as i) Environmental and Institutional, ii) Organizational Value-Enhancing and iii) Managerial drivers. As Environmental and Institutional Drivers, the authors have focused on the relationships between unrelated diversification with the institutional context and the institutional context and the relationship the strategic choices and the evolution of the macroeconomic and social system to produce the functions of the missing institutions. While, under the Organizational Value-Enhancing Drivers, establishing an internal capital market (e.g. risk reduction, lower costs of financial transaction, proper management liquidity cash practices), achieving market power (e.g. predatory pricing strategy), leveraging valuable and imperfectly imitable resources, cross-fertilization and know-how blending and capturing strategic flexibility are accepted as the main antecedents; Weberian power and prestige and Schumpeterian empire-building reasons, escalating the demand for managerial skills, generating favourable conditions for misleading the shareholders and risk reduction are the antecedents as managerial drivers.
In addition these main motivations, there are some different perspectives which have enough voice in the last decades. First, according to the assumptions of agency theory, growth is not based on any rational strategy of the organization but top managers’ desires. Senior executives give the growth decision to satisfy their personal egos or to earn a financial gain (Jensen, 1993; Karaevli, 2008). Interestingly, some researchers suppose that the big economic crisis of USA in 2008 revealed because of this reason (e.g. Reavis, 2009). Another different point of view is the government policy perspective. The high diversity of companies is a result of the state policies of the country and the diversity of these policies. Thus, the diversification may be more or less in line with the preferences of the state (Gökşen ve Üsdiken, 2001). Lastly, according to the power perspective, foreign trade and investment policies and government incentives offered in new areas have encouraged big business groups to invest in different sectors because they are stronger than others. As a result, large groups have become diversified as they seek to seize opportunities (Chang and Choi, 1988; Guillen, 2000).
3. Classification of Business Groups
Schneider (2010) classifies business groups into three different classes based on their characteristics. Table 1: Diversified Business Groups
Organic Portfolio induced Policy-Core Motivations Economies of scope (and vertical integration) Risk
management Government incentives Scope of
diversification Narrower Broadest Broader
Integration of
management High Variable Variable
Groups ties to
subsidiary Longer term Shorter term Shorter term (Schneider, 2010; p. 654)
Organic Groups: While the most important diversification type of organic groups developing to benefit from the scope of the economy is usually vertical integration, as companies expand their scope of the economy, they tend to invest more to Greenfields. For example, in the 55-year period between 1938 and 1993, Samsung established 62 new companies and doubled the number of acquisition and it
seems that acquisitions were predominant in the first years and Greenfield in the last decades of this period. In addition, while the establishment of new companies is preferred to enter a new industry, acquisitions are usually used as horizontal integration (Kang 1997: 37 as cited in Schneider, 2010). Portfolio Groups: Portfolio groups that aim to reduce risk and maximize returns tend to diversify through acquisition rather than establishing a new firm from scratch, but tend to easily transfer firms they find problematic. Such groups are mostly bank-based groups and they more often invest in different sectors than main group companies. Moreover, the technological incentives for management integration are lower, and particularly in developed countries, owners of the group generally permit significant autonomy to the management of subsidiaries. Nevertheless, broad diversification has led to problems of asymmetry of information and agency that can encourage more management integration especially in less competitive markets and in developing countries.
Policy-Induced Groups: Policy-based groups, which are based on government incentives or directives rather than rational decisions, are privileged groups that receive government support for a number of areas, from industrial incentives, privatizations, customs, tariffs and other protection. These groups, which can be classified as a subdivision of patrimonial groups, can be distinguished conceptually from other groups (organic and portfolio) based on stronger economic motivations.
4. National Business Systems (NBS)
The national business system approach developed by Richard Whitley speaks of six different national business systems that vary from country to country, by focusing on the relationship of the forms of doing business in different countries with the social context (Fıkırkoca, 2012). These six different business systems are shaped according to the eight basic dimensions shown in table 2. Moreover, in addition to eight key dimensions, Whitley focused on the following four institutions in order to make cross-country comparisons and to identify sets of business systems (Fıkırkoca, 2012): a) State, b) Financial system, c) Skill development and control system, d) Trust and authority relations
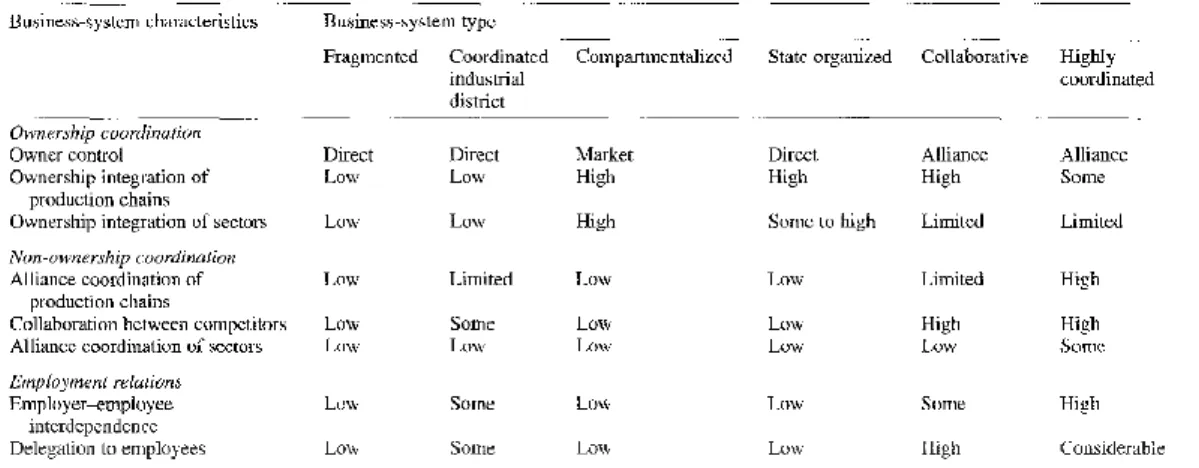
Table 2: Business Systems and Characteristics
Source: Whitley (1999, p. 42)
Fragmented Business Systems: These business systems have high direct control and low ownership and alliance coordination. Collaboration between firms is limited and markets are highly competitive. These business systems are often found in environments where trust is low and financial resources are not easily accessible (Hotho, 2014). In such business systems, companies tend to grow less because it is only possible to grow with their own resources (Selekler Gökşen, 2007). It is seen in countries like China.
Coordinated Industrial District Business Systems: In this kind of business systems where small firms dominate, alliance integration is more comprehensive and they are also more artisanal. In these
systems where the resources and opportunities are easily changed by the companies, the companies are supported by the local institutions rather than the national institutions (Hotho, 2014; Selekler Gökşen, 2007). As seen in most of Italy's industrial regions, local government agencies help increase entry and exit barriers and provide a high-quality education system (Best, 1990; Whitley, 1994 as cited in Hotho, 2014).
Compartmentalized: This business system, which promotes competition among firms that tend to be larger and organizationally integrated is usually seen in Anglo-Saxon countries. In these business systems, the risk is not shared with the institutions but thanks to the strong institutional structure they have, it does not hinder their growth (Hotho, 2014; Selekler Gökşen, 2007).
State-Organized Business Systems: In such business systems, states take a more active role in economic development and risk-sharing, and therefore the relationship with the state is vital. These systems, where company owners are usually the most active people in company management, are seen in countries like Turkey and South Korea, and the relations with the state are managed by the owners themselves (Hotho, 2014; Selekler Gökşen, 2007). This encourages direct ownership with closer links between political and economic elites, and limits anti-ownership coordination (Hotho, 2014; Whitley, 2000). Relations among firms are rather weak because the state allocates the resources directly by themselves and the companies are competing for this distribution (Hotho, 2014; Gökşen, 2007; Whitley, 2000).
Collaborative and Highly Coordinated Business Systems: While centralization, professionalization and diversification of activities are moderate in these business systems observed in developed countries such as Germany and Japan where strong links and risk sharing between economic actors are found, the importance of intermediary institutions is great. While states encourage and facilitate business union among economic actors in collaborative business systems, they are playing a more active guide role in highly coordinated business systems (Hotho, 2014; Gökşen, 2007; Whitley, 2000).
5. Data Processing and Discussion
To be able to make comparisons, ten political periods were determined from 1923 to 2016. In these ten periods, there are two military administration, two coalition parties and six single party governments as seen in table 3.
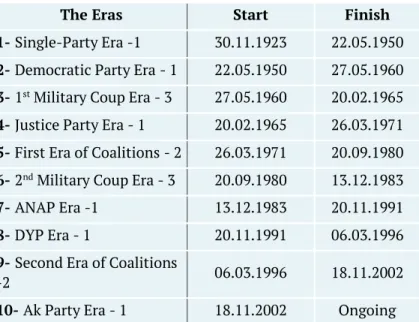
Table 3: Political periods between 1923 to 2016
The Eras Start Finish
1- Single-Party Era -1 30.11.1923 22.05.1950 2- Democratic Party Era - 1 22.05.1950 27.05.1960 3- 1st Military Coup Era - 3 27.05.1960 20.02.1965
4- Justice Party Era - 1 20.02.1965 26.03.1971 5- First Era of Coalitions - 2 26.03.1971 20.09.1980 6- 2nd Military Coup Era - 3 20.09.1980 13.12.1983
7- ANAP Era -1 13.12.1983 20.11.1991
8- DYP Era - 1 20.11.1991 06.03.1996
9- Second Era of Coalitions
-2 06.03.1996 18.11.2002
10- Ak Party Era - 1 18.11.2002 Ongoing Source: Premiership of Republic of Turkey, 2016
In addition to the periods, Istanbul Chamber of Industry (ISO) has explained Turkey's largest companies since 1968 and in this study, the owner families or groups of these companies have been first determined and state-owned enterprises and the companies that are not diversified have eliminated to determine the largest groups (ISO 500, 2015). Considering this information, the largest 30 groups of Turkey are seen at table 4.
Table 4: The largest 30 business groups or families in Turkey (2015)
Group ID Group Name Foundation Year Ownership Families
1 ÇUKUROVA 1923 KARAMEHMET FAMILY
2 İŞ BANKASI 1924 İŞ BANKASI FUND & CHP
3 KOÇ 1926 KOÇ FAMILY
4 SABANCI 1932 SABANCI FAMILY
5 STFA 1938 TÜRKEŞ AND AKKAYA FAMILIES
6 ECZACIBAŞI 1942 ECZACIBAŞI FAMILY
7 BORUSAN 1944 KOCABIYIK FAMILY
8 ÜLKER 1944 ÜLKER FAMILY
9 YAŞAR 1945 YAŞAR FAMILY
10 ANADOLU 1949 YAZICI AND ÖZILHAN FAMILY
11 DOĞAN 1950 DOĞAN FAMILY
12 KAZANCI* 1950 KAZANCI FAMILY
13 DOĞUŞ 1951 ŞAHENK FAMILY
14 AKKÖK* 1952 DINÇKÖK FAMILY
15 ZORLU 1953 ZORLU FAMILY
16 ALARKO 1954 ALATON AND GARIH FAMILY
17 TEKFEN 1956 AKÇAĞLILAR, BERKER AND GÖKYIĞIT FAMILIES
18 BOYDAK 1957 BOYDAK FAMILY
19 ENKA 1957 TARA AND GÜLÇELIKFAMILIES
20 KALE 1957 BODUR FAMILY
21 ÇELEBİ 1958 ÇELEBIOĞLU FAMILY
22 GÜRİŞ 1958 YAMANTÜRK FAMILY
23 OYAK 1961 ARMED FORCES PENSION FUND
24 SANKO 1966 KONUKOĞLU FAMILY
25 NERGİS 1967 ÇAĞLAR AND ŞANKAYA FAMILIES
26 KİBAR 1972 KIBAR FAMILY
27 CİNER 1978 CINER FAMILY
28 ŞAHİNLER 1982 ŞAHIN FAMILY
29 FİBA 1987 ÖZYEĞIN FAMILY
30 ÇALIK* 1930 ÇALIK FAMILY
The diversification information of these groups was investigated and only six of them could be accessed which are Çukurova, Koç, Sabancı, Doğan, Doğuş and Zorlu. The necessary information was collected through activity reports, the official website of the groups, group magazine, news bulletins and books written by founders and managers of the groups (e.g. Bizden Haberler, 2013; Dündar, 2006; 2008; Kıraç, 1995; Koç, 1972; 1987; Sabancı, 1985; 1993). When there is conflicting information, activity reports and official documents are considered as a basis. Now firstly the frequencies will be present and then all information will be discussed in depth.
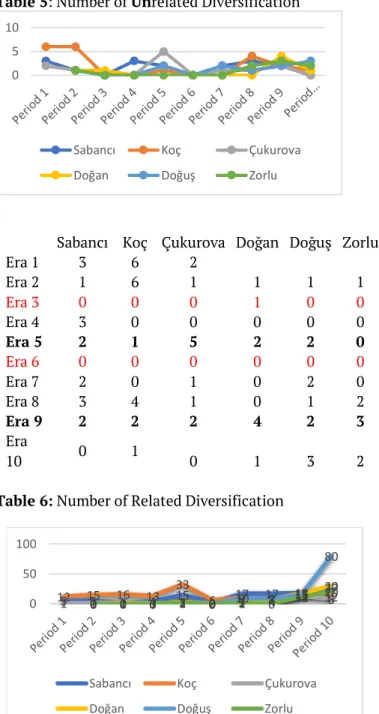
Table 5: Number of Unrelated Diversification
Sabancı Koç Çukurova Doğan Doğuş Zorlu
Era 1 3 6 2 Era 2 1 6 1 1 1 1 Era 3 0 0 0 1 0 0 Era 4 3 0 0 0 0 0 Era 5 2 1 5 2 2 0 Era 6 0 0 0 0 0 0 Era 7 2 0 1 0 2 0 Era 8 3 4 1 0 1 2 Era 9 2 2 2 4 2 3 Era 10 0 1 0 1 3 2
Table 6: Number of Related Diversification
Sabancı Koç Çukurova Doğan Doğuş Zorlu
Era 1 5 12 1 Era 2 5 15 1 0 0 0 Era 3 1 16 2 1 0 0 Era 4 4 13 1 0 0 0 Era 5 15 33 1 3 2 2 Era 6 2 6 0 0 0 0 Era 7 17 10 3 2 9 1 Era 8 17 7 4 7 8 0 Era 9 18 18 12 17 15 11 Era 10 27 12 8 30 80 20 0 5 10
Sabancı Koç Çukurova
Doğan Doğuş Zorlu
5 5 1 4 15 2 17 17 18 27 121 15010 16201 13010 33213 0006 10329 7478 12171815 30128 80 0 0 0 2 0 1 0 11 20 0 50 100
Sabancı Koç Çukurova
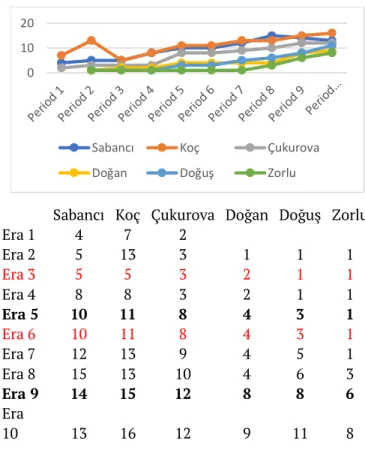
As is seen above, while the huge differences between periods can be observed in terms of unrelated diversification (Table 5), there are more stable changes for the related diversification (Table 6). On the other hand, considering the total number of industries and companies, it would not be wrong to claim that all companies have a sustainable growth almost in all periods although sharp zigzags were seen in some periods (Table 7 & 8).
The background information given in tables 5 to 8 show that there are some very interesting issues: for instance, Era 5 is a complete breakpoint due to the growth activities experienced in terms of all firms and diversification strategies. In this period, about 9 and a half years, exactly 11 governments were established and there are absolute unstable economic and political conditions. As it is claimed often at the main literature, in such conditions, the groups show the tendency to distribute the risk among firms and they try to gain flexibility through unrelated diversification (e.g. Baysinger and Hoskisson, 1990; Buğra, 1994; Çolpan and Hikino; 2008; Çolpan et al, 2010: Karaevli, 2008; Purkayastha et al., 2012). However, considering the related diversification, similar high-level growths are also observed in terms of related diversification, which contradicts the main literature suggesting that firms will make more cautious growth operations and will never do because of the risk factor reaching maximum in these periods as it observed in Era 6 which is a military administration period.
Table 7: Total number of industries/markets
Sabancı Koç Çukurova Doğan Doğuş Zorlu
Era 1 4 7 2 Era 2 5 13 3 1 1 1 Era 3 5 5 3 2 1 1 Era 4 8 8 3 2 1 1 Era 5 10 11 8 4 3 1 Era 6 10 11 8 4 3 1 Era 7 12 13 9 4 5 1 Era 8 15 13 10 4 6 3 Era 9 14 15 12 8 8 6 Era 10 13 16 12 9 11 8 0 10 20
Sabancı Koç Çukurova
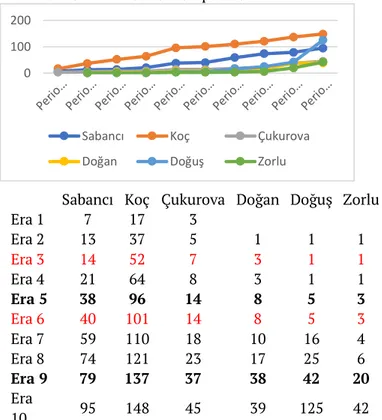
Table 8: Total number of companies
Sabancı Koç Çukurova Doğan Doğuş Zorlu
Era 1 7 17 3 Era 2 13 37 5 1 1 1 Era 3 14 52 7 3 1 1 Era 4 21 64 8 3 1 1 Era 5 38 96 14 8 5 3 Era 6 40 101 14 8 5 3 Era 7 59 110 18 10 16 4 Era 8 74 121 23 17 25 6 Era 9 79 137 37 38 42 20 Era 10 95 148 45 39 125 42
When the other coalitions and military administrated periods are considered, very similar comments can be made for all observed groups. Thus, it is easy to claim that coalition periods not a big problem for largest groups but military administrated periods are a very problematic. For example, considering the unrelated diversification, there is only one observation for all of six groups during the all military periods while there are 29 observations during the coalition governments. Similar observations are seen in terms of related diversification: while there are 137 activities observed in the coalition governments period, only 28 activities could be realized in military periods. When the total industry numbers are examined, only one growth activity was observed for Doğan groups in the first Military Coup Era, while Koç group which is the biggest group of the period reduces its total industry number from 13 to 5. In the second Military Coup Era, there are not any observations. The numbers can be useful but they may not be sufficiently descriptive and hence the percentages and annual averages based on period type will be now examined.
Table 9: Activity Increase Based on Period Type
Sabancı Koç Çukurova Doğan Doğuş Zorlu Average
Single Parties 70 80 23 11 104 26 52,33
Coalitions 22 48 20 26 21 16 25,50
Military 3 20 2 2 0 0 4,50
Table 10: Average Annual Activity Increase Based on Period Type
Sabancı Koç Çukurova Doğan Doğuş Zorlu Average
Single Party 1,09 1,25 0,36 0,30 2,81 0,70 1,09
Coalitions 1,47 3,20 1,33 1,73 1,40 1,07 1,70
Military 0,38 2,50 0,25 0,25 0,00 0,00 0,56
Table 11: Growth Rates (Percentage) by Period Type
Sabancı Koç Çukurova Doğan Doğuş Zorlu Average
Single Party 0,46 0,34 0,32 0,24 1,18 0,48 0,53 Coalitions 0,44 0,32 0,68 1,45 2,34 2,17 1,23 Military 0,06 0,23 0,20 1,00 0,00 0,00 0,25 0 100 200
Sabancı Koç Çukurova
When only the number of activities are taken into account (Table 9), it is easy to claim that single party governments are the best times to growth, while it is doubled the coalitions periods, there are 11 times more growth activities than military periods. However, considering in annual based, there is a very interesting result that coalitions periods are the period of most growth activity. In these periods, the average of annual growth was 1,70 while it is 1.09 in single party eras and 0,56 in military administration.
The percentages at table 11 represent the average growth rate of each period compared to the previous period. Both coalition governments came into force after a single party government and after each military administration, a single party government came into force but more growth activities have seen in the coalition eras. When the total number of affiliated companies is taken into consideration, the periods in which the Koç and Sabancı groups have the greatest growth periods are single party eras while the coalition periods are the most prosperous growth periods of Çukurova, Doğan, Doğuş and Zorlu groups.This data is not, of course, capable to claim any bold arguments only by itself however it is obvious that there is an important relationship between period type and growth activities.
Lastly, if the Whitley and Schneider’s classifications are focused, Turkey is accepted as a member of policy-induced diversified groups of Schneider and state-organized business systems of Whitley. Both classifications emphasize that there is an important relationship between state and groups and having a good relationship with the state have seen crucial due to the state’s active role in economy, risk-sharing and resource allocation. In this study, the opposite of these allegations was not reached as well. For example, when the era 10 is focused, while, the Doğuş and Zorlu groups, which had better relations with the ruling party of the period, grew by 197.6% and 110% compared to the previous period, Doğan group, which has respectively bad relations with the state recorded a growth of only 2,63% in the same period. However, it important to highlight that when each group is individually focused, there are some different data. For instance, Koç and Sabancı which are accepted relatively larger, well-established and more institutionalized groups seem to have made more economically rational decisions with the sale of their major companies from time to time. These behaviors called as corporate refocusing (Hoskisson et al., 2005) or Multi-Focusing Diversification (Karevli, 2008) in literature correspond to invest in other high added value areas as in the case of Koç's selling Migros and focusing the Yapı Kredi and Tüpraş. However, this kind of behaviors is not seen for other groups. On the other hand, Schneider (2010) emphasizes that any of these three groups can gain weight in some countries or periods but in practice, these three groups can be observed in each country and period. For example, the core set of organic subsidiaries could be blended other strategies by combining with another set of risk-balancing portfolio investments. In other cases, organic or portfolio groups can be stimulated by specific policies to enter new sectors, especially during periods of rapid political change. This also shows that the mix of diversified groups’ characteristics may be valid for different groups in the same country.
6. Conclusion
It has found a voice that business groups are emerging in different forms depending on the different politico-economic environment and business groups also can vary with changes in these conditions. Thus, this study is also built on the idea that the effect of different economic and political conditions may show differences in various business groups. Moreover, we think it will show differences even in diversification and the type of diversification, and the relationships with the government in question period have a significant impact on the decisions of business groups. Therefore, this study set out to determine the relationship between various political eras and the growth and diversification decision of the largest business groups.
It has been determined that different political periods have a significant effect on large groups and when the periods are examined one by one, differences are observed in terms of related and unrelated diversification in different government periods: When the effects of growth, diversification and the type of diversification in each period are analyzed independently and comparatively, the Sabancı and Koç groups achieved the highest growth figures during the single-party periods (Single Party Period,
Democratic Party, Justice Party, Anavatan Party, Doğru Yol Party and AK Party) while the other four groups achieved more growth activity during the coalition-party periods. In the military periods, all the groups except Doğan experienced the weakest times. The era 5, the coalition era, was the period when almost all groups peaked in terms of unrelated diversity. It is clear that the best period is clearly ANAP (Era 7) and the worst is the 2nd military coup (Era 6). The existence of so many growth activities in the seventh period generally overlaps with the liberal economic programs adopted by the Ozal government. Moreover, the good relations with Turgut Ozal, who is the ruling power of the era and the former manager of the group, have a significant influence on Sabancı Group's remarkable growth in this period. Finally, it can be clearly seen that there is a general increase in sector diversity and total activity number although increases or decreases are observed between periods in the numbers or types of diversification.
The study explains the central importance of main growth motivation and pattern in Turkey context and hence it is expected that findings will show significant contributions to the literature. The evidence from this study may suggest completely different and novel point of views. The research results accessed by this study may help business group managers to understand better the new environmental and competitive conditions in the process of integration with the global competition. Also, it may be a guide to decide the new strategies and the necessities of these strategies under these new environmental conditions. Of course, it should not be ignored that this is a proposal work and some changes may be experienced during the process but being a proposal is the main limitations of the study with the time.
7. References
Analoui, F., & Karami, A. (2003). Strategic Management in Small and Medium Enterprises. London: Cengage Learning EMEA.
Baysinger, B., & Hoskisson, R. E. (1990). The composition of board of directors and strategic control: effects on coprorate strategy. Academy of Management Review, 72-87.
Bizden Haberler. (2013). 50 Yıl 50 Kapak: 50. Yıl Özel Sayı. BizdenHaberler, 405:1-52.
Buğra, A. (1994: 2015). Devlet ve İşadamları (9th Eds). (F. Adaman, Translator) İstanbul: İletişim. Chang, S. J., & Choi, U. (1988). Strategy, structure and performance of Korean business groups: A
transactions cost approach. The Journal of Industrial Economics, 37 (2), 141-158.
Chang, S.J. (2003). Financial crisis and transformation of Korean business groups: The rise and fall of chaebols. Cambridge: Cambridge University Press.
Colpan A. M. and Jones, G. (2016). Business groups, entrepreneurship and the growth of the Koç Group in Turkey. Business History, 58 (1): 69–88.
Colpan A. M., Hikino, T and Lincoln, J. R (2010). The Oxford Handbook of Business Groups. New York: Oxford University Press.
Çolpan, A. M., & Hikino, T. (2008). Türkiye’nin Büyük Şirketler Kesiminde İşletme Gruplarinin İktisadi Rolü ve Çeşitlendirme Stratejileri. Yönetim Araştırmaları Dergisi, 23-58.
Dündar, C. (2006). Özel Arşivinden Belgeler ve Anılarıyla Vehbi Koç (1901 - 1960). İstanbul: Doğan Kitap. Dündar, C. (2008). Özel Arşivinden Belgeler ve Anılarıyla Vehbi Koç II (1961-1976). İstanbul: Yapı Kredi
Yayınları.
Fıkırkoca, A. (2012). Makrokurumsal Kuram. H. C. Sözen, & H. N. Basım (Eds) Örgüt Kuramları (p. 287-315). İstanbul: Beta.
Gökşen, N. S. (2007: 2015). Makrokurumsal Bakış Açısı: Bir Değerlendirme, A. S. Sargut, & Ş. Özen (Eds), Örgüt Kuramları (3. e., p. 331-378). Ankara: İmge.
Gökşen, N. S. and Üsdiken, B. (2001). Uniformity and diversity in Turkish business groups: effects of scale and time of founding. British Journal of Management, 12: 325-340.
Guillen, M. F. (2000). Business Groups In Emerging Economies:A Resource-Based View. Academy of Management Journal, 362-380.
Hofer, C. W., & Schendel, D. (1978). Strategy Formulation: Analytical Concepts (The West Series in Business Policy and Planning). St. Paul Minn: West Publishing Co.
Hoskisson, R. E., Johnson, R. A., Tihanyi, L., & White, R. E. (2005). Diversified Business Groups and Corporate Refocusing in Emerging Economies. Journal of Management, 941-965.
Hotho, J. J. (2014). From Typology to Taxonomy: A Configurational Analysis of National Business Systems and their Explanatory Power. Organization Studies, 35(5) 671–702.
Istanbul Chamber of Industry (ISO). (2015, June 6). 500 Largest Industrial Organization of Turkey. Retrieved June 6, 2015, from Istanbul Chamber of Industry (ISO): http://www.iso.org.tr/sites/1/content/500-buyuk-liste-2015.html
Jensen, M. C., (1993). The modern industrial revolution, exit and failure of internal control systems. The Journal of Finance, 48:831-880.
Karaevli, A. (2008). Türkiye’deki İşletme Gruplarında Çeşitlendirme Stratejilerinin Evrimi. Yönetim Araştırmaları Dergisi, 85-107.
Khanna, T., & Palebu, K. (2000). The future of business groups in emerging markets: long-run evidence from Chile. Academy of Management Journal, 268-285.
Kıraç, C. (1995). Anılarımla Patronum VEHBİ KOÇ. İstanbul: Milliyet Yayınları. Koç, V. (1973). Hayat Hikayem (Third Edition). İstanbul: Apa Ofset.
Koç, V. (1987). Hatıralarım, Görüşlerim, Öğütlerim: Vehbi KOÇ (1973-1987) (Second Edition). İstanbul: Hürriyet Ofset.
Nguyen, T., & Cai, C. X. (2016). Value-enhancing Learning from Industry-wide Diversification Experience. British Journal of Management, 27: 323–337.
Özkara, B., Kurt, M., & Karayormuk, K. (2008). Türkiye'de İşletme Grupları: Eskiler ve Yeniler. Yönetim Araştırmaları Dergisi, 8(1-2): 59-83.
Picone, P. M., & Dagnino, G. B. (2016). Revamping research on unrelated diversification strategy: perspectives, opportunities and challenges for future inquiry. Journal of Management & Governance, 20: 413–445.
Premiership of Republic of Turkey. (2016). Prime Ministers from the past to present. Retrieved May 01,
2016, from Premiership of Republic of Turkey:
https://www.basbakanlik.gov.tr/Forms/_Global/_PrimeMinister/pg_PrimeMinisters.aspx
Purkayastha, S., Manolova, T. S., & Edelman, L. F. (2012). Diversification and Performance in Developed and Emerging Market Contexts: A Review of the Literature. International Journal of Management Reviews, 18–38.
Ramanujam, V., & Varadarajan, P. (1989). Research on Corporate Diversification: A Synthesis. Strategic Management Journal, 523-551.
Reavis, C. (2009). The Global Financial Crisis of 2008 – 2009: The Role of Greed, Fear and Oligarchs, MIT Sloan Management, (July), 1-22.
Rumelt, R. P. (1982). Diversification Strategy and profitability. Strategic Management Journal, 359-369. Sabancı, S. (1985). İşte Hayatım. İstanbul: Aksoy.
Sabancı, S. (1993). Değişen ve Gelişen Türkiye. İstanbul: Güzel Sanatlar.
Schneider, B. R. (2010). Business Groups and the State: The Politics of Expansion, Restructuring, and Collapse. A. M. Colpan, T. Hikino, & J. R. Lincoln (Eds), The Oxford Handbook of Business Groups. (p. 650-669). New York: Oxford University Press.
Sönmez, M. (1990). Türkiye'de Holdingler Kırk Haramiler (4. Edition.). Ankara: Arkadaş. Tezel, Y. S. (1982). Cumhuriyet Döneminin İktisadi Tarihi (1923-1950). Ankara: Yurt Yayınevi.
Wan, W. P. (2005). Country Resource Environments, Firm Capabilities, and Corporate Diversification Strategies. Journal of Management Studies, 161-182.
Whitley, R. (1999). Divergent Capitalisms: The Social Structuring and Change of Business Systems. New York: Oxford University Press.
Whitley, R. (2000). The Institutional Structuring of Innovation Strategies: Business Systems, Firm Types and Patterns of Technical Change in Different Market Economies. Organization Studies, 21 (5): 855-886.