JHEP04(2021)109
Published for SISSA by SpringerReceived: December 7, 2020 Revised: March 9, 2021 Accepted: March 15, 2021 Published: April 13, 2021
Measurement of differential cross sections for Z
bosons produced in association with charm jets in pp
collisions at
√
s = 13 TeV
The CMS collaboration
E-mail: [email protected]
Abstract: Measurements are presented of differential cross sections for the production of Z bosons in association with at least one jet initiated by a charm quark in pp collisions at√s= 13 TeV. The data recorded by the CMS experiment at the LHC correspond to an
integrated luminosity of 35.9 fb−1. The final states contain a pair of electrons or muons that are the decay products of a Z boson, and a jet consistent with being initiated by a charm quark produced in the hard interaction. Differential cross sections as a function of the transverse momentum pT of the Z boson and pT of the charm jet are compared with predictions from Monte Carlo event generators. The inclusive production cross section 405.4 ± 5.6 (stat) ± 24.3 (exp) ± 3.7 (theo) pb, is measured in a fiducial region requiring both leptons to have pseudorapidity |η| < 2.4 and pT > 10 GeV, at least one lepton with pT > 26 GeV, and a mass of the pair in the range 71–111 GeV, while the charm jet is
required to have pT > 30 GeV and |η| < 2.4. These are the first measurements of these cross sections in proton-proton collisions at 13 TeV.
Keywords: Hadron-Hadron scattering (experiments), QCD
JHEP04(2021)109
Contents
1 Introduction 1
2 The CMS detector 2
3 Data and simulated events 2
4 Object reconstruction and event selection 3
5 Signal determination and data unfolding 5
6 Systematic uncertainties 9
7 Results 12
8 Summary 12
A Post-fit secondary vertex mass distributions 16
The CMS collaboration 20
1 Introduction
The CERN LHC produced a large number of events at√s= 13 TeV in proton-proton (pp)
collisions containing a Z boson accompanied by one or more jets initiated by charm quarks (c jets). The differential cross sections for inclusive Z+c jet production, as functions of the transverse momenta pT of the Z boson and of the c jet, are used to verify quantum chromodynamics (QCD) models, provide information on the parton distribution function (PDF) of the charm quark, and investigate the possibility of observing the intrinsic charm quark (IC) component in the nucleon [1–3]. An IC component would enhance the rate of Z+c jet production, especially at large values of pT of the Z boson and of the c jet.
Associated production of a Z boson and a c jet is an important background in searches for physics beyond the standard model (SM). For example, in supersymmetry models a top scalar quark (et) could decay into a charm quark and an undetected lightest supersymmetric particle, providing thereby a large pT imbalance [4]. One of the background sources for such a process is Z+c jet production with the Z boson decaying into neutrinos. Better modelling of Z+c jet production through studies of visible decay modes can enhance the sensitivity in searches for new physics. An example of a Feynman diagram corresponding to the Z+c jet process is shown in figure 1.
A previous measurement of the Z+c jet cross section at 8 TeV is reported in ref. [5]. In this paper the Z boson is formed from an identified electron or muon pair, and the c jet
JHEP04(2021)109
Figure 1. Example Feynman diagram for the Z+c jet process.
is identified by applying charm tagging criteria [6] to reconstructed jets. This achieves a higher selection efficiency than in the 8 TeV measurement, where c jets were identified by reconstructed D∗
(2010) mesons or low-momentum muons inside the jets.
Measurements of the fiducial total and differential cross sections of Z+c jet production are presented as functions of the pTof the Z boson and of the c jet pT. To provide a direct comparison with predictions from Monte Carlo (MC) event generators (generator level), we unfold the detector effects.
The data, corresponding to an integrated luminosity of 35.9 fb−1at√
s= 13 TeV, were
recorded by the CMS experiment during pp collisions in 2016. The minimum proton bunch spacing is 25 ns with 24 interactions on average per beam crossing.
2 The CMS detector
The central feature of the CMS apparatus is a superconducting solenoid of 6 m internal diameter, providing a magnetic field of 3.8 T. A silicon pixel and strip tracker, covering a pseudorapidity region |η| < 2.5, a lead tungstate crystal electromagnetic calorimeter (ECAL), and a brass and scintillator hadron calorimeter, with each system composed of a barrel and two endcap sections, lie within the solenoid volume. Forward calorimeters, made of steel and quartz fibers, extend η coverage provided by the barrel and endcap detectors to |η| < 5. Muons are detected in gas-ionization chambers embedded in the steel flux-return yoke outside the solenoid that cover |η| < 2.4. Events of interest are selected using a two-tiered trigger system [7]. The first level, composed of specialized hardware processors, uses information from the calorimeters and muon detectors to select events at a rate of ≈100 kHz within a fixed latency of about 4 µs. The second level, known as the high-level trigger, consists of a farm of processors running full event reconstruction software optimized for fast processing, that reduces the event rate to ≈1 kHz before data storage. A more detailed description of the CMS detector, together with a definition of the coordinate system and kinematic variables, can be found in ref. [8].
3 Data and simulated events
Various MC generators are used to simulate the Z+jets background and the signal pro-cesses. The MadGraph5_amc@nlo version 2.2.2 [9] (MG5_aMC) generator is used to
JHEP04(2021)109
simulate Drell-Yan (DY) processes, including the Z+c jet signal, calculated atnext-to-leading order (NLO). Background DY events include those with a Z boson and a jet initiated by a bottom quark (b jet), or a jet initiated by a light quark or a gluon (light jet). Samples are made for Z+n jet processes (n ≤ 2), calculated at NLO in perturbative QCD. A second signal model is provided by using MG5_aMC to calculate leading order (LO) matrix elements for pp → Z +n jets (n ≤ 4). For a third signal model, sherpa v2.2 [10,11] is used to generate pp → Z + n jets events, with n ≤ 2 at NLO and n ≤ 4 at LO. All three signal models are normalized to the value of the inclusive Z + jets cross section calculated at next-to-next-to-leading order with fewz v3.1 [12]. These samples are generated using the NNPDF 3.0 [13] PDF set.
In addition to events with light and b jets, there are contributions to the background from processes producing top quark pairs [14, 15] and single top quarks [16, 17]. These samples are generated using NLO powheg v2.0 [18–20] or MG5_aMC. There is also back-ground from vector boson pair production, which is simulated using pythia 8 v8.212 [21]. All samples, except sherpa, use pythia 8 to model the initial- and final-state parton showers and hadronization, with the CUETP8M1 [22] or CUETP8M2T4 [23] (top pair sample) tune that includes the NNPDF 2.3 [24] LO PDFs and the value of the strong coupling at the mass of the Z boson is αS(mZ) = 0.119. Matching between the matrix element generators and the parton shower is done using the kT-MLM [25,26] scheme with the matching scale set at 19 GeV for the LO MG5_aMC samples, and the FxFx [27] scheme with the matching scale set to 30 GeV for the NLO MG5_aMC events.
Geant4 [28] is used for CMS detector simulation. The simulation includes additional pp interactions (pileup) in the current and nearby bunch crossings.
The simulated events are reconstructed with the same algorithms used for the data.
4 Object reconstruction and event selection
The particle flow (PF) algorithm [29] is used to reconstruct and identify individual particle candidates (physics objects) in an event, through an optimized combination of information from the various elements of the CMS detector. Energy depositions are measured in the calorimeters, and charged particles are identified in the central tracking and muon systems. Electrons are reconstructed from tracks, fitted with a Gaussian sum filter, matching energy deposits in the ECAL [30]. Identification requirements are applied based on the ECAL shower shape, matching between the track and the ECAL deposits, and observ-ables characterizing the emission of bremsstrahlung radiation along the electron trajectory. Electrons are required to originate from the primary vertex, which is the vertex candi-date with the largest value of summed physics-object pT2. Longitudinal and transverse impact parameters with respect to the primary vertex for barrel (endcap) are required to be <0.10 (0.20) and <0.05 (0.10) cm, respectively. The electron momentum is estimated by combining the energy measurement in the ECAL with the momentum measurement in the tracker. The momentum resolution for electrons with pT ≈ 45 GeV from Z → ee decays ranges from 1.7 to 4.5%. The dielectron mass resolution for Z → ee decays when both
JHEP04(2021)109
electrons are in the ECAL barrel is 1.9%, degrading to 2.9% when both electrons are inthe endcaps.
Muons are reconstructed by combining signals from the inner tracker and the muon detector subsystems. They are required to satisfy standard identification criteria based on the number of hits in each detector, the track fit quality, and the consistency with the primary vertex by requiring the longitudinal and transverse impact parameters to be less than 0.5 and 0.2 cm, respectively. The efficiency to reconstruct and identify muons is greater than 96% [31]. Matching muons to tracks measured in the silicon tracker results in a relative pT resolution for muons with 20 < pT<100 GeV of 1% in the barrel and 3% in
the endcaps.
To reduce the misidentification rate, electrons and muons are required to be isolated. The isolation of electron or muon is defined as the sum of the pT of all additional PF candidates within a cone of radius ∆R =p
(∆η)2+ (∆φ)2 = 0.3 (0.4) around the electron (muon) track, where φ is the azimuthal angle in radians. After compensating for the contribution from pileup [32], the resultant sum is required to be less than 25% of the lepton pT.
Jets are clustered from PF candidates using the infrared- and collinear-safe anti-kT al-gorithm with a distance parameter of 0.4, as implemented in the FastJet package [33,34]. The jet momentum is determined as the vectorial sum of all particle momenta in the jet, and, based on simulation, is within 5 to 10% of the true momentum over the entire pT spectrum and detector acceptance. To mitigate the effects of pileup, charged particle can-didates identified as originating from pileup vertices are discarded and a correction [32] is applied to remove remaining contributions. The reconstructed jet energy scale (JES) is corrected using a factorized model to compensate for the nonlinear and nonuniform re-sponse in the calorimeters. Corrections are derived from simulation to bring the measured response of jets to that of generator-level jets on average. In situ measurements of the momentum balance in dijet, multijet, photon+jet, and leptonically decaying Z+jet events are used to correct any residual differences between the JES in data and simulation [35]. The jet energy in simulation is degraded to match the resolution observed in data. The jet energy resolution (JER) amounts typically to 15% at 10 GeV, 8% at 100 GeV, and 4% at 1 TeV. Additional selection criteria are applied to remove jets potentially dominated by anomalous contributions from various subdetector components or reconstruction fail-ures [36]. Jets identified as likely coming from pileup [37] are also removed.
Events are selected online through a single electron trigger requiring at least one elec-tron candidate with pT > 27 GeV (electron channel), or a single muon trigger requiring
at least one muon candidate with pT > 24 GeV (muon channel). Offline, we require a pair of oppositely charged electrons or muons each satisfying identification and isolation criteria, with pT >10 GeV and |η| < 2.4, and with an invariant mass close to the mass of
the Z boson: 71 < mee orµµ < 111 GeV. To exceed the trigger threshold in the electron channel at least one electron must have pT > 29 GeV, and in the muon channel at least
one muon must have pT >26 GeV. Small residual differences in the trigger, identification,
and isolation efficiencies between data and simulation are measured using tag-and-probe methods [38], and corrected by applying scale factors to simulated events.
JHEP04(2021)109
The event must contain at least one jet with pT > 30 GeV and |η| < 2.4, satisfyingtight c tagging criteria using the deep combined secondary vertices algorithm [6]. This algorithm discriminates c jets from b and light jets based on jet properties such as the presence of displaced vertices (secondary vertices) and tracks with large impact parameter with respect to the primary vertex. Data from W+jets, tt, and inclusive jet production are used to measure the c tagging efficiency for c jets, and mistag rates for b and light jets. These are compared with the simulation, where the reconstructed jet flavor is known from its hadron content. Small differences between data and simulation are corrected by applying scale factors to the simulation. The threshold applied in this analysis gives a c tagging efficiency of about 30%, and misidentification probabilities of 1.2% for light jets and 20% for b jets, with relative uncertainties between 5% and 15% depending on the pT of the jet. If several c-tagged jets occur in the event, the one with the highest pT is selected. The simulated events are classified according to generator-level information. Generator-level jets are made by clustering all stable particles resulting from hadronization using the anti-kT algorithm with a distance parameter of 0.4, and the jet flavor is defined by the flavor of the hadrons within the jet. If an event contains a generator-level jet with
pT > 10 GeV containing a b hadron, the event is defined as a Z+b jet event. If there is
no such generator-level b jet in the event and there is at least one generator-level jet with
pT >10 GeV containing a c hadron, the event is defined as a Z+c jet event. Other events in
the DY sample are classified as Z+light jet events. The generator-level leptons are dressed by adding the momenta of all photons within ∆R = 0.1 around the lepton directions.
5 Signal determination and data unfolding
Measurement of the differential cross sections of Z+c jet production as a function of the pT of the Z boson (pZT) and as a function of the c jet pT (pc jetT ) are performed in several steps. The first step is to select c jet-enriched samples of Z → ee (electron channel) or Z →µµ (muon channel) candidate events. The second step is to split the sample into different bins according to the pT of the Z boson or c-tagged jet (pc-tagged jetT ), and to measure the number of Z+c jet events in each bin. The third step is to unfold the data, using the simulation of the signal to construct response matrices to relate the observed distributions to those at the generator level. The final step is to combine the resulting unfolded electron and muon channel pTdistributions, and compare them with predictions from different MC event generators.
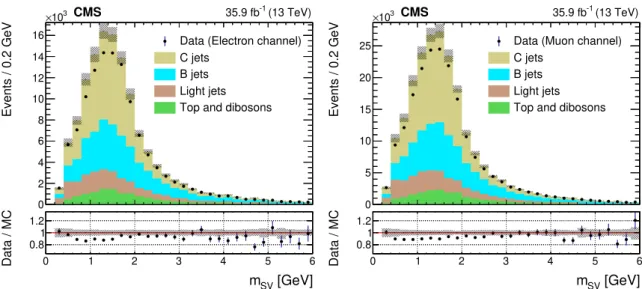
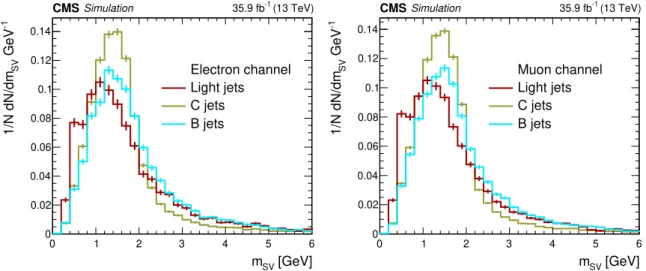
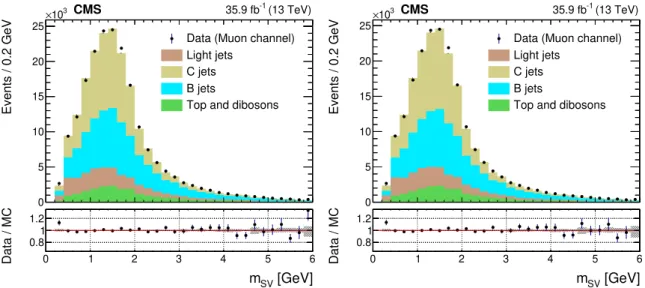
Charm hadrons can decay at points displaced from the primary vertex. This secondary vertex is reconstructed using the inclusive vertex finder algorithm [39]. The invariant mass of charged particles associated with the secondary vertex (mSV) in the c-tagged jet [6] is used to discriminate between signal and background. Figure 2 shows the observed distri-butions of mSVin the electron and muon channels, compared with the different signal and background contributions predicted by the simulation. Although mSV is an ingredient in the c tagging algorithm, there are sufficient differences remaining in the distributions for the c-tagged samples to provide information on the flavor composition. The normalized distri-butions of mSVfor Z+light jet, Z+c jet and Z+b jet components are compared in figure3.
JHEP04(2021)109
Events / 0.2 GeV 0 2 4 6 8 10 12 14 16 3 10 ×Data (Electron channel) C jets
B jets Light jets Top and dibosons
CMS 35.9 fb-1 (13 TeV) [GeV] SV m 0 1 2 3 4 5 6 Data / MC 0.8 1 1.2 Events / 0.2 GeV 0 5 10 15 20 25 3 10 ×
Data (Muon channel) C jets
B jets Light jets Top and dibosons
CMS 35.9 fb-1 (13 TeV) [GeV] SV m 0 1 2 3 4 5 6 Data / MC 0.8 1 1.2
Figure 2. Distribution of the secondary vertex mass mSV of the highest-pT c-tagged central jet,
for electron (left) and muon (right) channels. The observed data is compared with the different signal and background components in simulation, before normalization scale factors are applied. Dashed area represents MC systematic uncertainties. The vertical bars on the data points represent statistical uncertainties. Bottom panels on each plot represent the data to MC ratio.
The top quark and diboson background predictions are taken directly from simulation. The normalizations for the Z+c jet, Z+b jet and Z+light jet components are then obtained by fitting templates of the mSVdistribution obtained from simulation to the observed data. A maximum likelihood template fit is performed separately in each bin of Z boson candidate or c-tagged jet pT.
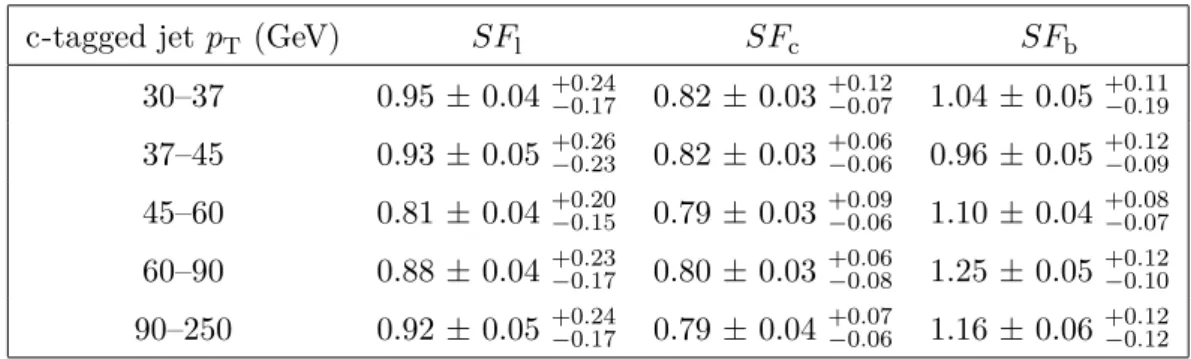
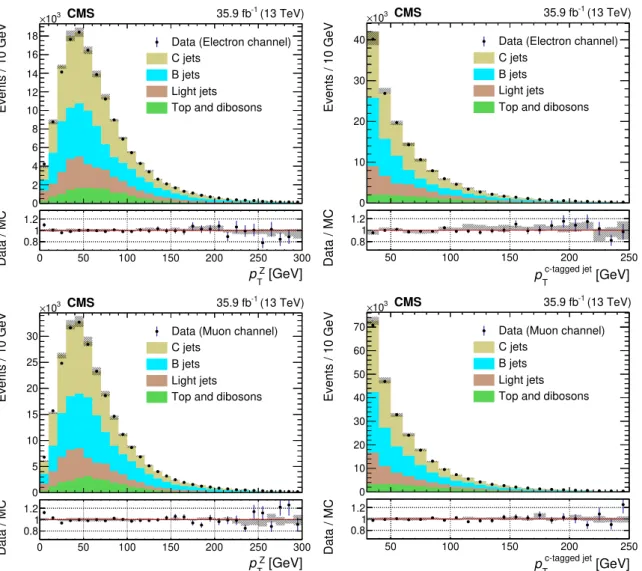
The values of the scale factors for the light (SFl), charm (SFc), and bottom (SFb) com-ponents, defined as the ratio of the fitted normalization to the prediction from simulation, are presented in tables 1–4for each pT bin for each Z+q jet process. The correlation coef-ficients between errors of different flavor SFs, found in the fit, are approximately equal to −0.8, −0.35 and −0.25 for SFc and SFb, SFland SFb, SFc and SFlrespectively. Sources of systematic uncertainty are discussed in section6. Figure4shows the distributions of the Z boson candidate and c-tagged jet pTafter applying these scale factors, assuming they are constant across the pT range in which they are determined. The post-fit mSV distributions are presented in appendix A. Good agreement is observed between simulation and data after applying these factors.
The generator-level signal is defined to be Z+c jet events with two oppositely charged generator-level electrons or muons with pT > 10 GeV (at least one with pT > 26 GeV),
|η| < 2.4, and an invariant mass 71 < mee orµµ <111 GeV. There must also be at least
one generator-level c jet with pT > 30 GeV and |η| < 2.4. To avoid double counting, jets within ∆R = 0.4 of one of the two leptons from the Z candidate are removed.
A fraction of Z+c jet events that are outside the signal phase space will migrate into the reconstructed signal region, primarily events with c jets with generated pT <30 GeV but reconstructed pT >30 GeV due to the finite detector resolution. The fraction of Z+c
JHEP04(2021)109
[GeV] SV m 0 1 2 3 4 5 6 -1 GeV SV 1/N dN/dm 0 0.02 0.04 0.06 0.08 0.1 0.12 0.14 CMSSimulation 35.9 fb-1 (13 TeV) Electron channel Light jets C jets B jets [GeV] SV m 0 1 2 3 4 5 6 -1 GeV SV 1/N dN/dm 0 0.02 0.04 0.06 0.08 0.1 0.12 0.14 CMSSimulation 35.9 fb-1 (13 TeV) Muon channel Light jets C jets B jetsFigure 3. Distribution of the secondary vertex mass of the highest-pT c-tagged central jet, for
electron (left) and muon (right) channels for Z+light jet, Z+c jet and Z+b jet components, nor-malized to 1. Vertical bars represent statistical uncertainties.
c-tagged jet pT (GeV) SFl SFc SFb
30–37 1.16 ± 0.05+0.29−0.21 0.70 ± 0.04+0.09−0.11 1.06 ± 0.05 +0.16−0.12 37–45 0.79 ± 0.06+0.26−0.18 0.89 ± 0.03+0.10−0.08 0.92 ± 0.05 +0.16−0.16 45–60 0.97 ± 0.06+0.23−0.19 0.74 ± 0.03+0.08−0.06 1.07 ± 0.06 +0.09−0.09 60–90 0.99 ± 0.07+0.24−0.18 0.87 ± 0.04+0.08−0.08 0.95 ± 0.07 +0.09−0.12 90–250 0.92 ± 0.07+0.27−0.19 0.98 ± 0.05+0.11−0.10 1.04 ± 0.07 +0.08−0.08
Table 1. Values of Z+light jet SFl, Z+c jet SFc, and Z+b jet SFb scale factors measured in the
electron channel, as a function of c-tagged jet pT. The first uncertainty is the statistical uncertainty from the fit, the second is the systematic uncertainty.
Z candidate pT (GeV) SFl SFc SFb 0–30 0.86 ± 0.05+0.24−0.18 0.76 ± 0.04 +0.11−0.09 1.25 ± 0.07+0.17−0.18 30–50 0.98 ± 0.05+0.23−0.17 0.80 ± 0.03 +0.08−0.08 0.91 ± 0.05+0.10−0.08 50–65 0.85 ± 0.07+0.21−0.16 0.78 ± 0.04 +0.15−0.11 1.04 ± 0.06+0.17−0.17 65–95 1.14 ± 0.08+0.30−0.22 0.97 ± 0.04 +0.08−0.07 0.76 ± 0.06+0.09−0.11 95–300 1.01 ± 0.07+0.26−0.20 0.83 ± 0.05 +0.07−0.07 1.13 ± 0.07+0.08−0.08
Table 2. Values of Z+light jet SFl, Z+c jet SFc, and Z+b jet SFb scale factors measured in the
electron channel, as a function of Z candidate pT. The first uncertainty is the statistical uncertainty from the fit, the second is the systematic uncertainty.
JHEP04(2021)109
c-tagged jet pT (GeV) SFl SFc SFb
30–37 0.95 ± 0.04+0.24−0.17 0.82 ± 0.03+0.12−0.07 1.04 ± 0.05 +0.11−0.19 37–45 0.93 ± 0.05+0.26−0.23 0.82 ± 0.03+0.06−0.06 0.96 ± 0.05 +0.12−0.09 45–60 0.81 ± 0.04+0.20−0.15 0.79 ± 0.03+0.09−0.06 1.10 ± 0.04 +0.08−0.07 60–90 0.88 ± 0.04+0.23−0.17 0.80 ± 0.03+0.06−0.08 1.25 ± 0.05 +0.12−0.10 90–250 0.92 ± 0.05+0.24−0.17 0.79 ± 0.04+0.07−0.06 1.16 ± 0.06 +0.12−0.12
Table 3. Values of Z+light jet SFl, Z+c jet SFc, and Z+b jet SFb scale factors measured in the
muon channel, as a function of c-tagged jet pT. The first uncertainty is the statistical uncertainty from the fit, the second is the systematic uncertainty.
Z candidate pT (GeV) SFl SFc SFb 0–30 0.97 ± 0.04+0.24−0.20 0.82 ± 0.03 +0.09−0.08 1.09 ± 0.05+0.11−0.10 30–50 0.91 ± 0.04+0.21−0.16 0.80 ± 0.02 +0.07−0.06 0.99 ± 0.04+0.05−0.06 50–65 0.63 ± 0.06+0.17−0.13 0.73 ± 0.03 +0.09−0.06 1.24 ± 0.05+0.09−0.10 65–95 0.96 ± 0.05+0.25−0.18 0.85 ± 0.03 +0.09−0.06 1.04 ± 0.05+0.13−0.14 95–300 0.89 ± 0.05+0.23−0.17 0.78 ± 0.04 +0.07−0.07 1.33 ± 0.06+0.08−0.08
Table 4. Values of Z+light jet SFl, Z+c jet SFc, and Z+b jet SFb scale factors measured in the
muon channel, as a function of Z candidate pT. The first uncertainty is the statistical uncertainty from the fit, the second is the systematic uncertainty.
jet events that are inside the signal phase space is estimated from the number of selected events in which the c-tagged jet and lepton pair match within ∆R < 0.3 to a generator-level highest-pT c jet and lepton pair satisfying the phase space requirements. Figure 5 shows this fraction as functions of Z boson and c-tagged jet pT, for electron and muon channels, calculated using MadGraph5_amc@nlo sample.
Response matrices are constructed using the Z+c jet events in the DY sample that is simulated using the MG5_aMC (NLO) generator, and cross-checked using the MG5_aMC (LO) generator. Each matrix entry represents the probability for an event generated in the signal phase space within a certain c jet (or Z boson) pT range to end up within a certain reconstructed c jet (or Z boson candidate) pT range. The unfolding was done with 5 detector-level pT bins and 4 generator-level pT bins. The TUnfold package v17.5 [40], which is based on a least-squares fit, is then used to invert the response matrices and unfold the distribution of the measured number of Z+c jet events.
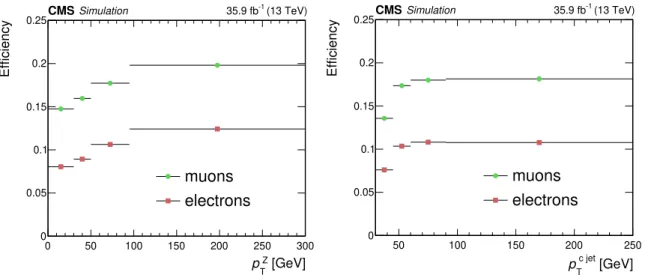
Figure 6 shows the efficiency (defined as the fraction of signal events generated in the fiducial phase space that pass all selection criteria after reconstruction) as a function of the generator-level Z boson or c jet pT for electron and muon channels, calculated using the MG5_aMC (NLO) sample. The dominant losses are due to the c tagging and lepton selection efficiencies.
JHEP04(2021)109
Events / 10 GeV 0 2 4 6 8 10 12 14 16 18 3 10 ×Data (Electron channel) C jets
B jets Light jets Top and dibosons
CMS -1 (13 TeV) 35.9 fb [GeV] T Z p 0 50 100 150 200 250 300 Data / MC 0.8 1 1.2 Events / 10 GeV 0 10 20 30 40 3 10 ×
Data (Electron channel) C jets
B jets Light jets Top and dibosons
CMS -1 (13 TeV) 35.9 fb [GeV] T c-tagged jet p 50 100 150 200 250 Data / MC 0.8 1 1.2 Events / 10 GeV 0 5 10 15 20 25 30 3 10 ×
Data (Muon channel) C jets
B jets Light jets Top and dibosons
CMS 35.9 fb-1 (13 TeV) [GeV] T Z p 0 50 100 150 200 250 300 Data / MC 0.8 1 1.2 Events / 10 GeV 0 10 20 30 40 50 60 70 3 10 ×
Data (Muon channel) C jets
B jets Light jets Top and dibosons
CMS -1 (13 TeV) 35.9 fb [GeV] T c-tagged jet p 50 100 150 200 250 Data / MC 0.8 1 1.2
Figure 4. The distributions of pTin data and corrected simulation, after applying the fitted scale
factors to the Drell-Yan components. The upper plots show distributions for the electron channel, with the pTof the electron pair (left) and c-tagged jet (right). The lower plots show distributions for the muon channel with the pT of the muon pair (left) and c-tagged jet (right). Dashed area represents MC systematic uncertainties. The vertical bars on the data points represent statistical uncertainties. Bottom panels on each plot represent the data to MC ratio.
6 Systematic uncertainties
The systematic uncertainties are estimated by varying relevant parameters and then repeat-ing the unfoldrepeat-ing procedure, recalculatrepeat-ing the values of the efficiency, response matrix, and number of Z+c jet and background events in each case. The differences observed between the unfolded distributions are assumed as the uncertainties. The following uncertainties are included:
• QCD renormalization and factorization scales. The ambiguity in the choice of QCD renormalization scale (µR) and factorization scale (µF) leads to uncertainty in the-oretical predictions for the DY process. This uncertainty is estimated by
chang-JHEP04(2021)109
[GeV] T Z p 0 50 100 150 200 250 300 Fiducial purity 0.5 0.6 0.7 0.8 0.9 1 CMSSimulation 35.9 fb-1 (13 TeV) muons electrons [GeV] T c-tagged jet p 50 100 150 200 250 Fiducial purity 0.5 0.6 0.7 0.8 0.9 1 CMSSimulation 35.9 fb-1 (13 TeV) muons electronsFigure 5. Fraction of selected Z+c jet events originating within the fiducial phase space as a
function of pT. The plots show distributions for electron and muons channels as a function of p Z T (left) and pc-tagged jet
T (right). [GeV] T Z p 0 50 100 150 200 250 300 Efficiency 0 0.05 0.1 0.15 0.2 0.25 CMSSimulation 35.9 fb-1 (13 TeV) muons electrons [GeV] T c jet p 50 100 150 200 250 Efficiency 0 0.05 0.1 0.15 0.2 0.25 CMSSimulation 35.9 fb-1 (13 TeV) muons electrons
Figure 6. Efficiency as a function of pT. The plots show distributions for the electron and muon
channels, as a function of pZ
T (left) and p c jet
T (right).
ing the values of µR and µF by factors of 0.5 and 2 relative to the default values,
µF = µR= mZ, excluding the (0.5µF,2µR) and (0.5µR,2µF) combinations. Largest
deviations from the central values were used as uncertainty.
• PDF. The unfolding is performed with different PDF replicas and compared with the nominal distribution.
• c tagging efficiency. The effect of uncertainties in the c tagging rates is estimated by varying tagging and mistagging scale factors for the different jet flavors. Scale factors for tagging c jets, and mistagging b jets and light jets are varied up and down by one standard deviation. The combined c tagging uncertainty is then calculated
JHEP04(2021)109
Channel QCD PDF c tag/mistag JER JES Pileup Top Pair ID\Iso L MC stat.(%) (%) (%) (%) (%) (%) (%) (%) (%) (%)
µµ, pc jetT 5.5 0.5 4.2 3.9 4.8 1.5 0.6 1.0 2.5 4.2
µµ, pZT 1.9 0.5 4.2 1.1 3.9 1.6 0.8 1.0 2.5 3.1
ee, pc jetT 6.4 0.6 4.2 3.1 6.4 3.0 0.7 2.6 2.5 6.3
ee, pZT 2.6 0.5 4.1 1.1 4.8 1.8 0.6 2.6 2.5 3.8
Table 5. Summary of the systematic uncertainties in the integral fiducial cross section arising from
the various sources for electron (ee) and muon (µµ) channels, calculated by integrating over pc jetT or pZ
T.
as the sum in quadrature of these variations. The variation of scale factors is ≈15% for light jets, and ≈5% for charm and bottom jets.
• Jet energy resolution and scale. Both the JES and JER corrections can affect jet pT and the mSV distributions used in the SFb and SFl measurements. The uncertainty resulting from JES corrections is estimated by varying the pT- and η-dependent scale factors within their uncertainty (up to ≈4%). The JER uncertainty is estimated by varying the amount of jet pTresolution degradation applied to the simulation up and down by one standard deviation (≈10%).
• Pileup. The corresponding uncertainty is estimated by changing the total inelastic cross section by ±4.6% [41].
• Lepton identification and isolation. Uncertainties resulting from the modeling of the identification and isolation of muons and electrons are estimated by varying the corresponding scale factors within their uncertainties. For electrons the uncertainty is less than 3%, while for muons uncertainties in identification and isolation are less than 2%.
• Top pair production cross section. The uncertainty because of the cross section used for the modeling of top quark pair production is estimated by varying the normal-ization of the top pair component of the background by ±10% [42].
• Luminosity. The uncertainty is obtained by changing the luminosity value used to normalize the unfolded distributions by ±2.5% [43].
• Statistical uncertainties in mSV templates. The uncertainty is obtained by taking
into account statistical fluctuations in each bin of the simulated mSV distributions, used in the fit of SFl, SFc and SFb.
The uncertainties in the integral fiducial cross section from the considered sources are listed in table 5.
JHEP04(2021)109
7 Results
The total fiducial cross section is measured as
σfid = NcharmPfid
εLB(Z → ``), (7.1)
where Ncharm is the integral number of measured charm events, Pfid is the integral fiducial purity, ε is the integral fiducial selection efficiency, L is the integrated luminosity, and B(Z → ``) = 3.36% is the branching fraction of the Z boson to `` with ` = e orµ.
The fiducial differential cross sections are obtained from the unfolded distributions as dσ
dpT =
Ni
L∆iB(Z → ``), (7.2)
where Ni is the number of events in pT bin i of the unfolded distribution and ∆i is the width of the bin.
The results of the measurement of total and differential fiducial cross sections from the electron and muon channels are combined by a fit using the Convino tool [44], which includes statistical and systematic uncertainties. The uncertainties related to the c tag and mistag rates, JER, JES, pileup, luminosity, and top quark pair cross section are assumed fully correlated between the channels, whereas uncertainties from other sources are assumed to be uncorrelated. The experimental systematic uncertainties are those related to c tag and mistag rates, JER, JES, identification and isolation, pileup, and luminosity. The rest are designated as theoretical systematic uncertainties.
The total fiducial cross section value for Z boson pT < 300 GeV equals 405.4 ±
5.6 (stat) ± 24.3 (exp) ± 3.7 (theo) pb, where (exp) and (theo) denote experimental and theoretical systematic uncertainties, respectively. This value is significantly lower than the MG5_aMC (NLO) predicted value of 524.9 ± 11.7 (theo) pb. The theoretical systematic uncertainty includes uncertainties in QCD scale and PDF.
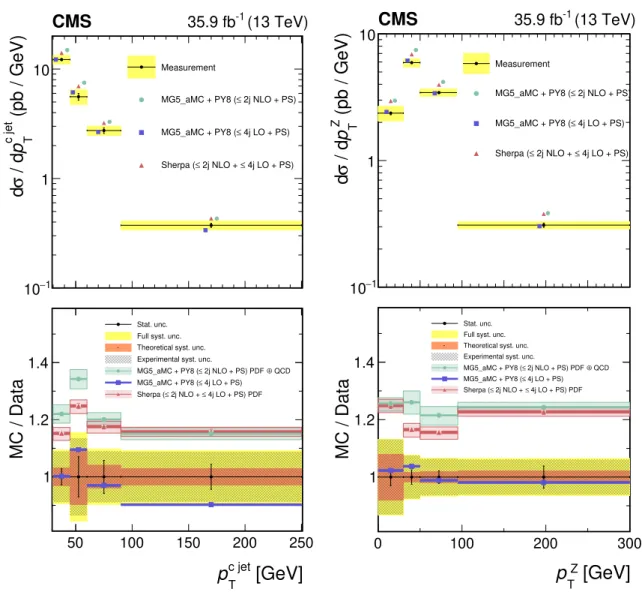
The values of the cross sections as a function of pT of the Z boson and c jet after combining are shown in figure 7. This also shows a comparison of the measured fiducial cross sections with predictions from the generators MG5_aMC (NLO), MG5_aMC (LO), and sherpa. The prediction from MG5_aMC at leading order shows good agreement with data, while both MG5_aMC and sherpa at next-to-leading order tend to overestimate the cross section.
The values of the measured differential cross sections are presented in tables 6and 7.
8 Summary
The first differential cross sections for inclusive Z+c jet production as functions of trans-verse momenta pT of the Z boson and of the associated c jet are presented for collisions at √s = 13 TeV using 35.9 fb−1 of data collected by the CMS experiment at the CERN
LHC. The measurements pertain to a fiducial space defined as containing a c jet with
pT >30 GeV and pseudorapidity |η| < 2.4, and a pair of leptons with each lepton having pT >10 GeV, |η| < 2.4, and at least one with pT >26 GeV, and a dilepton mass between
JHEP04(2021)109
(pb / GeV) T c jet p / d σ d 1 − 10 1 10 CMS 35.9 fb-1 (13 TeV) Measurement 2j NLO + PS) ≤ MG5_aMC + PY8 ( 4j LO + PS) ≤ MG5_aMC + PY8 ( 4j LO + PS) ≤ 2j NLO + ≤ Sherpa ([GeV]
T c jetp
50 100 150 200 250 MC / Data 1 1.2 1.4 Stat. unc. Full syst. unc. Theoretical syst. unc. Experimental syst. unc.QCD ⊕ 2j NLO + PS) PDF ≤ MG5_aMC + PY8 ( 4j LO + PS) ≤ MG5_aMC + PY8 ( 4j LO + PS) PDF ≤ 2j NLO + ≤ Sherpa ( (pb / GeV) T Z p / d σ d 1 − 10 1 10 CMS -1 (13 TeV) 35.9 fb Measurement 2j NLO + PS) ≤ MG5_aMC + PY8 ( 4j LO + PS) ≤ MG5_aMC + PY8 ( 4j LO + PS) ≤ 2j NLO + ≤ Sherpa (
[GeV]
T Zp
0 100 200 300 MC / Data 1 1.2 1.4 Stat. unc. Full syst. unc. Theoretical syst. unc. Experimental syst. unc.QCD ⊕ 2j NLO + PS) PDF ≤ MG5_aMC + PY8 ( 4j LO + PS) ≤ MG5_aMC + PY8 ( 4j LO + PS) PDF ≤ 2j NLO + ≤ Sherpa (
Figure 7. Measured fiducial differential cross sections for inclusive Z+c jet production, dσ/dpc jetT
(left) and dσ/dpZ
T (right). Yellow band shows total systematic uncertainties. Predictions from MG5_aMC (LO) are shown with statistical uncertainties only. The vertical bars on the data points represent statistical uncertainties.
pc jetT (GeV) electrons (pb/GeV) muons (pb/GeV) combined (pb/GeV)
30–45 11.91 ± 0.54 ± 1.50 12.34 ± 0.44 ± 1.05 12.20 ± 0.34 ± 1.15 45–60 5.30 ± 0.63 ± 0.92 5.73 ± 0.49 ± 0.66 5.59 ± 0.39 ± 0.87 60–90 3.10 ± 0.25 ± 0.51 2.66 ± 0.19 ± 0.41 2.74 ± 0.16 ± 0.27 90–250 0.43 ± 0.03 ± 0.06 0.34 ± 0.02 ± 0.03 0.37 ± 0.02 ± 0.03
Table 6. Measured differential cross section as a function of pc jetT for electron and muon channels
and combined value. The first and second uncertainty values correspond to the statistical and systematic contributions, respectively.
JHEP04(2021)109
pZT (GeV) electrons (pb/GeV) muons (pb/GeV) combined (pb/GeV)
0–30 2.28 ± 0.13 ± 0.28 2.40 ± 0.08 ± 0.24 2.37 ± 0.07 ± 0.31 30–50 5.91 ± 0.23 ± 0.54 5.90 ± 0.19 ± 0.46 5.93 ± 0.15 ± 0.45 50–95 3.69 ± 0.13 ± 0.27 3.32 ± 0.09 ± 0.22 3.44 ± 0.08 ± 0.23 95–300 0.32 ± 0.02 ± 0.03 0.30 ± 0.02 ± 0.02 0.31 ± 0.01 ± 0.02
Table 7. Measured differential cross section as a function of pZT for electron and muon channels
and combined value. The first and second uncertainty values correspond to the statistical and systematic contributions, respectively.
71 and 111 GeV. The main background sources correspond to Z+light jet, Z+b jet, top quark pair, and diboson (ZZ, ZW, or WW) production. To provide a direct comparison with predictions from Monte Carlo (MC) event generators, we unfold detector effects from our measurements.
The total fiducial cross section for the Z boson with pT<300 GeV is measured to be
405.4±5.6 (stat) ±24.3 (exp)±3.7 (theo) pb, while the MadGraph5_amc@nlo generator at next-to-leading order predicts 524.9 ± 11.7(theo) pb for the same fiducial region. The theoretical uncertainties include QCD scale variation and parton distribution function un-certainties. The predictions from MC event generators were compared with measurements, which are in good agreement with MadGraph5_amc@nlo at leading order, while both MadGraph5_amc@nlo and sherpa at next-to-leading order tend to overestimate the cross section. Predictions from all three generators were normalized to the cross section calculated with fewz at next-to-next-to-leading order. The prediction of inclusive Z+jets production at next-to-leading order is in better agreement with data than that at leading order [45]. This could be an indication that the parton distribution functions overestimate the charm content. These results can be used to improve existing constraints on the charm quark content in the proton.
Acknowledgments
We congratulate our colleagues in the CERN accelerator departments for the excellent per-formance of the LHC and thank the technical and administrative staffs at CERN and at other CMS institutes for their contributions to the success of the CMS effort. In addition, we gratefully acknowledge the computing centers and personnel of the Worldwide LHC Computing Grid for delivering so effectively the computing infrastructure essential to our analyses. Finally, we acknowledge the enduring support for the construction and operation of the LHC and the CMS detector provided by the following funding agencies: BMBWF and FWF (Austria); FNRS and FWO (Belgium); CNPq, CAPES, FAPERJ, FAPERGS, and FAPESP (Brazil); MES (Bulgaria); CERN; CAS, MoST, and NSFC (China); COL-CIENCIAS (Colombia); MSES and CSF (Croatia); RIF (Cyprus); SENESCYT (Ecuador); MoER, ERC PUT and ERDF (Estonia); Academy of Finland, MEC, and HIP (Finland); CEA and CNRS/IN2P3 (France); BMBF, DFG, and HGF (Germany); GSRT (Greece);
JHEP04(2021)109
NKFIA (Hungary); DAE and DST (India); IPM (Iran); SFI (Ireland); INFN (Italy); MSIPand NRF (Republic of Korea); MES (Latvia); LAS (Lithuania); MOE and UM (Malaysia); BUAP, CINVESTAV, CONACYT, LNS, SEP, and UASLP-FAI (Mexico); MOS (Montene-gro); MBIE (New Zealand); PAEC (Pakistan); MSHE and NSC (Poland); FCT (Portugal); JINR (Dubna); MON, RosAtom, RAS, RFBR, and NRC KI (Russia); MESTD (Serbia); SEIDI, CPAN, PCTI, and FEDER (Spain); MOSTR (Sri Lanka); Swiss Funding Agen-cies (Switzerland); MST (Taipei); ThEPCenter, IPST, STAR, and NSTDA (Thailand); TUBITAK and TAEK (Turkey); NASU (Ukraine); STFC (United Kingdom); DOE and NSF (U.S.A.).
Individuals have received support from the Marie-Curie program and the European Re-search Council and Horizon 2020 Grant, contract Nos. 675440, 724704, 752730, and 765710 (European Union); the Leventis Foundation; the A.P. Sloan Foundation; the Alexander von Humboldt Foundation; the Belgian Federal Science Policy Office; the Fonds pour la Forma-tion à la Recherche dans l’Industrie et dans l’Agriculture (FRIA-Belgium); the Agentschap voor Innovatie door Wetenschap en Technologie (IWT-Belgium); the F.R.S.-FNRS and FWO (Belgium) under the “Excellence of Science — EOS” — be.h project n. 30820817; the Beijing Municipal Science & Technology Commission, No. Z191100007219010; the Ministry of Education, Youth and Sports (MEYS) of the Czech Republic; the Deutsche Forschungsgemeinschaft (DFG) under Germany’s Excellence Strategy — EXC 2121 “Quan-tum Universe” — 390833306; the Lendület (“Momen“Quan-tum”) Program and the János Bolyai Research Scholarship of the Hungarian Academy of Sciences, the New National Excellence Program ÚNKP, the NKFIA research grants 123842, 123959, 124845, 124850, 125105, 128713, 128786, and 129058 (Hungary); the Council of Science and Industrial Research, India; the HOMING PLUS program of the Foundation for Polish Science, cofinanced from European Union, Regional Development Fund, the Mobility Plus program of the Min-istry of Science and Higher Education, the National Science Center (Poland), contracts Harmonia 2014/14/M/ST2/00428, Opus 2014/13/B/ST2/02543, 2014/15/B/ST2/03998, and 2015/19/B/ST2/02861, Sonata-bis 2012/07/E/ST2/01406; the National Priorities Re-search Program by Qatar National ReRe-search Fund; the Ministry of Science and Higher Education, project no. 0723-2020-0041 (Russia); the Tomsk Polytechnic University Com-petitiveness Enhancement Program; the Programa Estatal de Fomento de la Investigación Científica y Técnica de Excelencia María de Maeztu, grant MDM-2015-0509 and the Pro-grama Severo Ochoa del Principado de Asturias; the Thalis and Aristeia programs cofi-nanced by EU-ESF and the Greek NSRF; the Rachadapisek Sompot Fund for Postdoc-toral Fellowship, Chulalongkorn University and the Chulalongkorn Academic into Its 2nd Century Project Advancement Project (Thailand); the Kavli Foundation; the Nvidia Cor-poration; the SuperMicro CorCor-poration; the Welch Foundation, contract C-1845; and the Weston Havens Foundation (U.S.A.).
JHEP04(2021)109
A Post-fit secondary vertex mass distributions
Figures 8 and 9 show post-fit secondary vertex mass distributions for electron and muon channels. The normalization scale factors from the fit of mSV were applied as a function of Z or c-tagged central jet pT.
Events / 0.2 GeV 0 2 4 6 8 10 12 14 3 10 ×
Data (Electron channel) Light jets
C jets B jets
Top and dibosons
CMS 35.9 fb-1 (13 TeV) [GeV] SV m 0 1 2 3 4 5 6 Data / MC 0.8 1 1.2 Events / 0.2 GeV 0 2 4 6 8 10 12 14 3 10 ×
Data (Electron channel) Light jets
C jets B jets
Top and dibosons
CMS 35.9 fb-1 (13 TeV) [GeV] SV m 0 1 2 3 4 5 6 Data / MC 0.8 1 1.2
Figure 8. Distribution of the secondary vertex mass mSV of the highest-pTc-tagged central jet, for
electron channel. The observed data is compared to the different signal and background components in simulation, after normalization scale factors as function of Z pT (left) and c-tagged central jet
pT(right) are applied. Bottom panels on each plot represent the data to MC ratio.
Events / 0.2 GeV 0 5 10 15 20 25 3 10 ×
Data (Muon channel) Light jets
C jets B jets
Top and dibosons
CMS 35.9 fb-1 (13 TeV) [GeV] SV m 0 1 2 3 4 5 6 Data / MC 0.8 1 1.2 Events / 0.2 GeV 0 5 10 15 20 25 3 10 ×
Data (Muon channel) Light jets
C jets B jets
Top and dibosons
CMS 35.9 fb-1 (13 TeV) [GeV] SV m 0 1 2 3 4 5 6 Data / MC 0.8 1 1.2
Figure 9. Distribution of the secondary vertex mass mSV of the highest-pTc-tagged central jet, for
muon channel. The observed data is compared to the different signal and background components in simulation, after normalization scale factors as function of Z pT (left) and c-tagged central jet
JHEP04(2021)109
Open Access. This article is distributed under the terms of the Creative Commons Attribution License (CC-BY 4.0), which permits any use, distribution and reproduction in any medium, provided the original author(s) and source are credited.
References
[1] S.J. Brodsky, A. Kusina, F. Lyonnet, I. Schienbein, H. Spiesberger and R. Vogt, A review of
the intrinsic heavy quark content of the nucleon,Adv. High Energy Phys. 2015(2015) 231547
[arXiv:1504.06287] [INSPIRE].
[2] T.-J. Hou et al., CT14 Intrinsic Charm Parton Distribution Functions from CTEQ-TEA
Global Analysis,JHEP 02(2018) 059[arXiv:1707.00657] [INSPIRE].
[3] NNPDF collaboration, A Determination of the Charm Content of the Proton,Eur. Phys. J.
C 76(2016) 647[arXiv:1605.06515] [INSPIRE].
[4] CMS collaboration, Search for the pair production of third-generation squarks with two-body
decays to a bottom or charm quark and a neutralino in proton-proton collisions at√s= 13
TeV,Phys. Lett. B 778(2018) 263[arXiv:1707.07274] [INSPIRE].
[5] CMS collaboration, Measurement of associated Z + charm production in proton-proton
collisions at√s= 8 TeV,Eur. Phys. J. C 78(2018) 287[arXiv:1711.02143] [INSPIRE].
[6] CMS collaboration, Identification of heavy-flavour jets with the CMS detector in pp
collisions at 13 TeV,2018 JINST 13 P05011[arXiv:1712.07158] [INSPIRE].
[7] CMS collaboration, The CMS trigger system,2017 JINST 12 P01020[arXiv:1609.02366] [INSPIRE].
[8] CMS collaboration, The CMS Experiment at the CERN LHC,2008 JINST 3 S08004 [INSPIRE].
[9] J. Alwall et al., The automated computation of tree-level and next-to-leading order
differential cross sections, and their matching to parton shower simulations,JHEP 07(2014)
079[arXiv:1405.0301] [INSPIRE].
[10] T. Gleisberg et al., Event generation with SHERPA 1.1,JHEP 02(2009) 007
[arXiv:0811.4622] [INSPIRE].
[11] F. Buccioni et al., OpenLoops 2, Eur. Phys. J. C 79(2019) 866[arXiv:1907.13071] [INSPIRE].
[12] Y. Li and F. Petriello, Combining QCD and electroweak corrections to dilepton production in FEWZ,Phys. Rev. D 86(2012) 094034[arXiv:1208.5967] [INSPIRE].
[13] NNPDF collaboration, Parton distributions for the LHC Run II,JHEP 04(2015) 040
[arXiv:1410.8849] [INSPIRE].
[14] CMS collaboration, Measurement of the t¯t production cross section using events with one
lepton and at least one jet in pp collisions at √s= 13 TeV,JHEP 09(2017) 051
[arXiv:1701.06228] [INSPIRE].
[15] CMS collaboration, Measurement of the t¯t production cross section using events in the eµ
final state in pp collisions at√s= 13 TeV,Eur. Phys. J. C 77(2017) 172
JHEP04(2021)109
[16] N. Kidonakis, Differential and total cross sections for top pair and single top production, in20th International Workshop on Deep-Inelastic Scattering and Related Subjects, (2012) [DOI]
[arXiv:1205.3453] [INSPIRE].
[17] S. Alioli, P. Nason, C. Oleari and E. Re, NLO single-top production matched with shower in
POWHEG: s- and t-channel contributions,JHEP 09(2009) 111[Erratum ibid. 02 (2010)
011] [arXiv:0907.4076] [INSPIRE].
[18] P. Nason, A New method for combining NLO QCD with shower Monte Carlo algorithms, JHEP 11(2004) 040[hep-ph/0409146] [INSPIRE].
[19] S. Frixione, P. Nason and C. Oleari, Matching NLO QCD computations with Parton Shower
simulations: the POWHEG method,JHEP 11(2007) 070[arXiv:0709.2092] [INSPIRE].
[20] S. Alioli, P. Nason, C. Oleari and E. Re, A general framework for implementing NLO
calculations in shower Monte Carlo programs: the POWHEG BOX,JHEP 06(2010) 043
[arXiv:1002.2581] [INSPIRE].
[21] T. Sjöstrand et al., An introduction to PYTHIA 8.2,Comput. Phys. Commun. 191(2015)
159[arXiv:1410.3012] [INSPIRE].
[22] CMS collaboration, Event generator tunes obtained from underlying event and multiparton
scattering measurements,Eur. Phys. J. C 76(2016) 155[arXiv:1512.00815] [INSPIRE].
[23] CMS collaboration, Investigations of the impact of the parton shower tuning in PYTHIA 8
in the modelling oftt at√s= 8 and 13 TeV,CMS-PAS-TOP-16-021(2016).
[24] R.D. Ball et al., Parton distributions with LHC data, Nucl. Phys. B 867(2013) 244
[arXiv:1207.1303] [INSPIRE].
[25] J. Alwall et al., Comparative study of various algorithms for the merging of parton showers
and matrix elements in hadronic collisions,Eur. Phys. J. C 53(2008) 473
[arXiv:0706.2569] [INSPIRE].
[26] J. Alwall, S. de Visscher and F. Maltoni, QCD radiation in the production of heavy colored
particles at the LHC,JHEP 02(2009) 017[arXiv:0810.5350] [INSPIRE].
[27] R. Frederix and S. Frixione, Merging meets matching in MC@NLO,JHEP 12(2012) 061
[arXiv:1209.6215] [INSPIRE].
[28] GEANT4 collaboration, Geant4— a simulation toolkit,Nucl. Instrum. Meth. A 506
(2003) 250[INSPIRE].
[29] CMS collaboration, Particle-flow reconstruction and global event description with the CMS
detector,2017 JINST 12 P10003[arXiv:1706.04965] [INSPIRE].
[30] CMS collaboration, Performance of Electron Reconstruction and Selection with the CMS
Detector in Proton-Proton Collisions at√s= 8 TeV,2015 JINST 10 P06005
[arXiv:1502.02701] [INSPIRE].
[31] CMS collaboration, Performance of the CMS muon detector and muon reconstruction with
proton-proton collisions at√s= 13 TeV,2018 JINST 13 P06015[arXiv:1804.04528]
[INSPIRE].
[32] M. Cacciari and G.P. Salam, Pileup subtraction using jet areas,Phys. Lett. B 659(2008) 119
[arXiv:0707.1378] [INSPIRE].
[33] M. Cacciari, G.P. Salam and G. Soyez, The anti-kt jet clustering algorithm,JHEP 04(2008)
JHEP04(2021)109
[34] M. Cacciari, G.P. Salam and G. Soyez, FastJet User Manual,Eur. Phys. J. C 72(2012)1896[arXiv:1111.6097] [INSPIRE].
[35] CMS collaboration, Jet energy scale and resolution in the CMS experiment in pp collisions
at 8 TeV,2017 JINST 12 P02014[arXiv:1607.03663] [INSPIRE].
[36] CMS collaboration, Performance of missing transverse momentum reconstruction in
proton-proton collisions at√s= 13 TeV using the CMS detector,2019 JINST 14 P07004
[arXiv:1903.06078] [INSPIRE].
[37] CMS collaboration, Pileup mitigation at CMS in 13 TeV data,2020 JINST 15 P09018
[arXiv:2003.00503] [INSPIRE].
[38] CMS collaboration, Measurement of the Inclusive W and Z Production Cross Sections in pp
Collisions at√s= 7 TeV,JHEP 10(2011) 132[arXiv:1107.4789] [INSPIRE].
[39] CMS collaboration, Measurement of B ¯B Angular Correlations based on Secondary Vertex
Reconstruction at√s= 7 TeV,JHEP 03(2011) 136[arXiv:1102.3194] [INSPIRE].
[40] S. Schmitt, TUnfold: an algorithm for correcting migration effects in high energy physics,
2012 JINST 7 T10003[arXiv:1205.6201] [INSPIRE].
[41] CMS collaboration, Measurement of the inelastic proton-proton cross section at√ s= 13 TeV,JHEP 07(2018) 161[arXiv:1802.02613] [INSPIRE].
[42] M. Czakon, P. Fiedler and A. Mitov, Total Top-Quark Pair-Production Cross Section at
Hadron Colliders Through O(αS4),Phys. Rev. Lett. 110(2013) 252004[arXiv:1303.6254]
[INSPIRE].
[43] CMS collaboration, CMS Luminosity Measurements for the 2016 Data Taking Period,
CMS-PAS-LUM-17-001(2017).
[44] J. Kieseler, A method and tool for combining differential or inclusive measurements obtained
with simultaneously constrained uncertainties, Eur. Phys. J. C 77(2017) 792
[arXiv:1706.01681] [INSPIRE].
[45] CMS collaboration, Measurement of differential cross sections for Z boson production in
association with jets in proton-proton collisions at √s= 13 TeV,Eur. Phys. J. C 78(2018)
JHEP04(2021)109
The CMS collaboration
Yerevan Physics Institute, Yerevan, Armenia A.M. Sirunyan†, A. Tumasyan
Institut für Hochenergiephysik, Wien, Austria
W. Adam, T. Bergauer, M. Dragicevic, J. Erö, A. Escalante Del Valle, R. Frühwirth1, M. Jeitler1, N. Krammer, L. Lechner, D. Liko, T. Madlener, I. Mikulec, F.M. Pitters, N. Rad, J. Schieck1, R. Schöfbeck, M. Spanring, S. Templ, W. Waltenberger, C.-E. Wulz1, M. Zarucki
Institute for Nuclear Problems, Minsk, Belarus
V. Chekhovsky, A. Litomin, V. Makarenko, J. Suarez Gonzalez Universiteit Antwerpen, Antwerpen, Belgium
M.R. Darwish2, E.A. De Wolf, D. Di Croce, X. Janssen, T. Kello3, A. Lelek, M. Pieters, H. Rejeb Sfar, H. Van Haevermaet, P. Van Mechelen, S. Van Putte, N. Van Remortel Vrije Universiteit Brussel, Brussel, Belgium
F. Blekman, E.S. Bols, S.S. Chhibra, J. D’Hondt, J. De Clercq, D. Lontkovskyi, S. Lowette, I. Marchesini, S. Moortgat, A. Morton, Q. Python, S. Tavernier, W. Van Doninck, P. Van Mulders
Université Libre de Bruxelles, Bruxelles, Belgium
D. Beghin, B. Bilin, B. Clerbaux, G. De Lentdecker, B. Dorney, L. Favart, A. Grebenyuk, A.K. Kalsi, I. Makarenko, L. Moureaux, L. Pétré, A. Popov, N. Postiau, E. Starling, L. Thomas, C. Vander Velde, P. Vanlaer, D. Vannerom, L. Wezenbeek
Ghent University, Ghent, Belgium
T. Cornelis, D. Dobur, M. Gruchala, I. Khvastunov4, M. Niedziela, C. Roskas, K. Skovpen, M. Tytgat, W. Verbeke, B. Vermassen, M. Vit
Université Catholique de Louvain, Louvain-la-Neuve, Belgium
G. Bruno, F. Bury, C. Caputo, P. David, C. Delaere, M. Delcourt, I.S. Donertas, A. Giammanco, V. Lemaitre, K. Mondal, J. Prisciandaro, A. Taliercio, M. Teklishyn, P. Vischia, S. Wertz, S. Wuyckens
Centro Brasileiro de Pesquisas Fisicas, Rio de Janeiro, Brazil G.A. Alves, C. Hensel, A. Moraes
Universidade do Estado do Rio de Janeiro, Rio de Janeiro, Brazil
W.L. Aldá Júnior, E. Belchior Batista Das Chagas, H. BRANDAO MALBOUISSON, W. Carvalho, J. Chinellato5, E. Coelho, E.M. Da Costa, G.G. Da Silveira6, D. De Je-sus Damiao, S. Fonseca De Souza, J. Martins7, D. Matos Figueiredo, M. Medina Jaime8, C. Mora Herrera, L. Mundim, H. Nogima, P. Rebello Teles, L.J. Sanchez Rosas, A. San-toro, S.M. Silva Do Amaral, A. Sznajder, M. Thiel, F. Torres Da Silva De Araujo, A. Vilela Pereira
JHEP04(2021)109
Universidade Estadual Paulista a, Universidade Federal do ABC b, São Paulo, Brazil
C.A. Bernardesa,a, L. Calligarisa, T.R. Fernandez Perez Tomeia, E.M. Gregoresa,b, D.S. Lemosa, P.G. Mercadantea,b, S.F. Novaesa, Sandra S. Padulaa
Institute for Nuclear Research and Nuclear Energy, Bulgarian Academy of Sciences, Sofia, Bulgaria
A. Aleksandrov, G. Antchev, I. Atanasov, R. Hadjiiska, P. Iaydjiev, M. Misheva, M. Rodozov, M. Shopova, G. Sultanov
University of Sofia, Sofia, Bulgaria
M. Bonchev, A. Dimitrov, T. Ivanov, L. Litov, B. Pavlov, P. Petkov, A. Petrov Beihang University, Beijing, China
W. Fang3, Q. Guo, H. Wang, L. Yuan
Department of Physics, Tsinghua University, Beijing, China M. Ahmad, Z. Hu, Y. Wang
Institute of High Energy Physics, Beijing, China
E. Chapon, G.M. Chen9, H.S. Chen9, M. Chen, T. Javaid9, A. Kapoor, D. Leggat, H. Liao, Z. Liu, R. Sharma, A. Spiezia, J. Tao, J. Thomas-wilsker, J. Wang, H. Zhang, S. Zhang9, J. Zhao
State Key Laboratory of Nuclear Physics and Technology, Peking University, Beijing, China
A. Agapitos, Y. Ban, C. Chen, Q. Huang, A. Levin, Q. Li, M. Lu, X. Lyu, Y. Mao, S.J. Qian, D. Wang, Q. Wang, J. Xiao
Sun Yat-Sen University, Guangzhou, China Z. You
Institute of Modern Physics and Key Laboratory of Nuclear Physics and Ion-beam Application (MOE) - Fudan University, Shanghai, China
X. Gao3
Zhejiang University, Hangzhou, China M. Xiao
Universidad de Los Andes, Bogota, Colombia
C. Avila, A. Cabrera, C. Florez, J. Fraga, A. Sarkar, M.A. Segura Delgado Universidad de Antioquia, Medellin, Colombia
J. Jaramillo, J. Mejia Guisao, F. Ramirez, J.D. Ruiz Alvarez, C.A. Salazar González, N. Vanegas Arbelaez
University of Split, Faculty of Electrical Engineering, Mechanical Engineering and Naval Architecture, Split, Croatia
JHEP04(2021)109
University of Split, Faculty of Science, Split, Croatia Z. Antunovic, M. Kovac, T. Sculac
Institute Rudjer Boskovic, Zagreb, Croatia
V. Brigljevic, D. Ferencek, D. Majumder, M. Roguljic, A. Starodumov10, T. Susa University of Cyprus, Nicosia, Cyprus
M.W. Ather, A. Attikis, E. Erodotou, A. Ioannou, G. Kole, M. Kolosova, S. Konstantinou, J. Mousa, C. Nicolaou, F. Ptochos, P.A. Razis, H. Rykaczewski, H. Saka, D. Tsiakkouri Charles University, Prague, Czech Republic
M. Finger11, M. Finger Jr.11, A. Kveton, J. Tomsa Escuela Politecnica Nacional, Quito, Ecuador E. Ayala
Universidad San Francisco de Quito, Quito, Ecuador E. Carrera Jarrin
Academy of Scientific Research and Technology of the Arab Republic of Egypt, Egyptian Network of High Energy Physics, Cairo, Egypt
H. Abdalla12, A.A. Abdelalim13,14, S. Elgammal15
Center for High Energy Physics (CHEP-FU), Fayoum University, El-Fayoum, Egypt
A. Lotfy, M.A. Mahmoud
National Institute of Chemical Physics and Biophysics, Tallinn, Estonia
S. Bhowmik, A. Carvalho Antunes De Oliveira, R.K. Dewanjee, K. Ehataht, M. Kadastik, M. Raidal, C. Veelken
Department of Physics, University of Helsinki, Helsinki, Finland P. Eerola, L. Forthomme, H. Kirschenmann, K. Osterberg, M. Voutilainen Helsinki Institute of Physics, Helsinki, Finland
E. Brücken, F. Garcia, J. Havukainen, V. Karimäki, M.S. Kim, R. Kinnunen, T. Lampén, K. Lassila-Perini, S. Lehti, T. Lindén, H. Siikonen, E. Tuominen, J. Tuominiemi
Lappeenranta University of Technology, Lappeenranta, Finland P. Luukka, T. Tuuva
IRFU, CEA, Université Paris-Saclay, Gif-sur-Yvette, France
C. Amendola, M. Besancon, F. Couderc, M. Dejardin, D. Denegri, J.L. Faure, F. Ferri, S. Ganjour, A. Givernaud, P. Gras, G. Hamel de Monchenault, P. Jarry, B. Lenzi, E. Locci, J. Malcles, J. Rander, A. Rosowsky, M.Ö. Sahin, A. Savoy-Navarro16, M. Titov, G.B. Yu Laboratoire Leprince-Ringuet, CNRS/IN2P3, Ecole Polytechnique, Institut Polytechnique de Paris, Palaiseau, France
S. Ahuja, F. Beaudette, M. Bonanomi, A. Buchot Perraguin, P. Busson, C. Charlot, O. Davignon, B. Diab, G. Falmagne, R. Granier de Cassagnac, A. Hakimi, I. Kucher,
JHEP04(2021)109
A. Lobanov, C. Martin Perez, M. Nguyen, C. Ochando, P. Paganini, J. Rembser, R. Salerno,J.B. Sauvan, Y. Sirois, A. Zabi, A. Zghiche
Université de Strasbourg, CNRS, IPHC UMR 7178, Strasbourg, France J.-L. Agram17, J. Andrea, D. Bloch, G. Bourgatte, J.-M. Brom, E.C. Chabert, C. Collard, J.-C. Fontaine17, D. Gelé, U. Goerlach, C. Grimault, A.-C. Le Bihan, P. Van Hove
Université de Lyon, Université Claude Bernard Lyon 1, CNRS-IN2P3, Institut de Physique Nucléaire de Lyon, Villeurbanne, France
E. Asilar, S. Beauceron, C. Bernet, G. Boudoul, C. Camen, A. Carle, N. Chanon, D. Con-tardo, P. Depasse, H. El Mamouni, J. Fay, S. Gascon, M. Gouzevitch, B. Ille, Sa. Jain, I.B. Laktineh, H. Lattaud, A. Lesauvage, M. Lethuillier, L. Mirabito, L. Torterotot, G. Touquet, M. Vander Donckt, S. Viret
Georgian Technical University, Tbilisi, Georgia I. Bagaturia18, Z. Tsamalaidze11
RWTH Aachen University, I. Physikalisches Institut, Aachen, Germany
L. Feld, K. Klein, M. Lipinski, D. Meuser, A. Pauls, M. Preuten, M.P. Rauch, J. Schulz, M. Teroerde
RWTH Aachen University, III. Physikalisches Institut A, Aachen, Germany D. Eliseev, M. Erdmann, P. Fackeldey, B. Fischer, S. Ghosh, T. Hebbeker, K. Hoepfner, H. Keller, L. Mastrolorenzo, M. Merschmeyer, A. Meyer, G. Mocellin, S. Mondal, S. Mukherjee, D. Noll, A. Novak, T. Pook, A. Pozdnyakov, Y. Rath, H. Reithler, J. Roemer, A. Schmidt, S.C. Schuler, A. Sharma, S. Wiedenbeck, S. Zaleski
RWTH Aachen University, III. Physikalisches Institut B, Aachen, Germany C. Dziwok, G. Flügge, W. Haj Ahmad19, O. Hlushchenko, T. Kress, A. Nowack, C. Pistone, O. Pooth, D. Roy, H. Sert, A. Stahl20, T. Ziemons
Deutsches Elektronen-Synchrotron, Hamburg, Germany
H. Aarup Petersen, M. Aldaya Martin, P. Asmuss, I. Babounikau, S. Baxter, O. Behnke, A. Bermúdez Martínez, A.A. Bin Anuar, K. Borras21, V. Botta, D. Brunner, A. Campbell, A. Cardini, P. Connor, S. Consuegra Rodríguez, V. Danilov, A. De Wit, M.M. De-franchis, L. Didukh, D. Domínguez Damiani, G. Eckerlin, D. Eckstein, T. Eichhorn, L.I. Estevez Banos, E. Gallo22, A. Geiser, A. Giraldi, A. Grohsjean, M. Guthoff, A. Harb, A. Jafari23, N.Z. Jomhari, H. Jung, A. Kasem21, M. Kasemann, H. Kaveh, C. Kleinwort, J. Knolle, D. Krücker, W. Lange, T. Lenz, J. Lidrych, K. Lipka, W. Lohmann24, R. Mankel, I.-A. Melzer-Pellmann, J. Metwally, A.B. Meyer, M. Meyer, M. Missiroli, J. Mnich, A. Mussgiller, V. Myronenko, Y. Otarid, D. Pérez Adán, S.K. Pflitsch, D. Pitzl, A. Raspereza, A. Saggio, A. Saibel, M. Savitskyi, V. Scheurer, C. Schwanenberger, A. Singh, R.E. Sosa Ricardo, N. Tonon, O. Turkot, A. Vagnerini, M. Van De Klundert, R. Walsh, D. Walter, Y. Wen, K. Wichmann, C. Wissing, S. Wuchterl, O. Zenaiev, R. Zlebcik
JHEP04(2021)109
University of Hamburg, Hamburg, Germany
R. Aggleton, S. Bein, L. Benato, A. Benecke, K. De Leo, T. Dreyer, A. Ebrahimi, M. Eich, F. Feindt, A. Fröhlich, C. Garbers, E. Garutti, P. Gunnellini, J. Haller, A. Hinzmann, A. Karavdina, G. Kasieczka, R. Klanner, R. Kogler, V. Kutzner, J. Lange, T. Lange, A. Malara, C.E.N. Niemeyer, A. Nigamova, K.J. Pena Rodriguez, O. Rieger, P. Schleper, S. Schumann, J. Schwandt, D. Schwarz, J. Sonneveld, H. Stadie, G. Steinbrück, B. Vormwald, I. Zoi
Karlsruher Institut fuer Technologie, Karlsruhe, Germany
J. Bechtel, T. Berger, E. Butz, R. Caspart, T. Chwalek, W. De Boer, A. Dierlamm, A. Droll, K. El Morabit, N. Faltermann, K. Flöh, M. Giffels, A. Gottmann, F. Hartmann20, C. Heidecker, U. Husemann, M.A. Iqbal, I. Katkov25, P. Keicher, R. Koppenhöfer, S. Maier, M. Metzler, S. Mitra, D. Müller, Th. Müller, M. Musich, G. Quast, K. Rabbertz, J. Rauser, D. Savoiu, D. Schäfer, M. Schnepf, M. Schröder, D. Seith, I. Shvetsov, H.J. Simonis, R. Ulrich, M. Wassmer, M. Weber, R. Wolf, S. Wozniewski
Institute of Nuclear and Particle Physics (INPP), NCSR Demokritos, Aghia Paraskevi, Greece
G. Anagnostou, P. Asenov, G. Daskalakis, T. Geralis, A. Kyriakis, D. Loukas, G. Paspalaki, A. Stakia
National and Kapodistrian University of Athens, Athens, Greece
M. Diamantopoulou, D. Karasavvas, G. Karathanasis, P. Kontaxakis, C.K. Koraka, A. Manousakis-katsikakis, A. Panagiotou, I. Papavergou, N. Saoulidou, K. Theofilatos, K. Vellidis, E. Vourliotis
National Technical University of Athens, Athens, Greece
G. Bakas, K. Kousouris, I. Papakrivopoulos, G. Tsipolitis, A. Zacharopoulou University of Ioánnina, Ioánnina, Greece
I. Evangelou, C. Foudas, P. Gianneios, P. Katsoulis, P. Kokkas, K. Manitara, N. Manthos, I. Papadopoulos, J. Strologas
MTA-ELTE Lendület CMS Particle and Nuclear Physics Group, Eötvös Loránd University, Budapest, Hungary
M. Bartók26, M. Csanad, M.M.A. Gadallah27, S. Lökös28, P. Major, K. Mandal, A. Mehta, G. Pasztor, O. Surányi, G.I. Veres
Wigner Research Centre for Physics, Budapest, Hungary
G. Bencze, C. Hajdu, D. Horvath29, F. Sikler, V. Veszpremi, G. Vesztergombi† Institute of Nuclear Research ATOMKI, Debrecen, Hungary
S. Czellar, J. Karancsi26, J. Molnar, Z. Szillasi, D. Teyssier
Institute of Physics, University of Debrecen, Debrecen, Hungary P. Raics, Z.L. Trocsanyi, B. Ujvari
Eszterhazy Karoly University, Karoly Robert Campus, Gyongyos, Hungary T. Csorgo, F. Nemes, T. Novak
JHEP04(2021)109
Indian Institute of Science (IISc), Bangalore, India
S. Choudhury, J.R. Komaragiri, D. Kumar, L. Panwar, P.C. Tiwari
National Institute of Science Education and Research, HBNI, Bhubaneswar, India
S. Bahinipati30, D. Dash, C. Kar, P. Mal, T. Mishra, V.K. Muraleedharan Nair Bindhu, A. Nayak31, D.K. Sahoo30, N. Sur, S.K. Swain
Panjab University, Chandigarh, India
S. Bansal, S.B. Beri, V. Bhatnagar, G. Chaudhary, S. Chauhan, N. Dhingra32, R. Gupta, A. Kaur, S. Kaur, P. Kumari, M. Meena, K. Sandeep, S. Sharma, J.B. Singh, A.K. Virdi University of Delhi, Delhi, India
A. Ahmed, A. Bhardwaj, B.C. Choudhary, R.B. Garg, M. Gola, S. Keshri, A. Kumar, M. Naimuddin, P. Priyanka, K. Ranjan, A. Shah
Saha Institute of Nuclear Physics, HBNI, Kolkata, India
M. Bharti33, R. Bhattacharya, S. Bhattacharya, D. Bhowmik, S. Dutta, S. Ghosh, B. Gomber34, M. Maity35, S. Nandan, P. Palit, P.K. Rout, G. Saha, B. Sahu, S. Sarkar, M. Sharan, B. Singh33, S. Thakur33
Indian Institute of Technology Madras, Madras, India
P.K. Behera, S.C. Behera, P. Kalbhor, A. Muhammad, R. Pradhan, P.R. Pujahari, A. Sharma, A.K. Sikdar
Bhabha Atomic Research Centre, Mumbai, India
D. Dutta, V. Kumar, K. Naskar36, P.K. Netrakanti, L.M. Pant, P. Shukla Tata Institute of Fundamental Research-A, Mumbai, India
T. Aziz, M.A. Bhat, S. Dugad, R. Kumar Verma, G.B. Mohanty, U. Sarkar Tata Institute of Fundamental Research-B, Mumbai, India
S. Banerjee, S. Bhattacharya, S. Chatterjee, R. Chudasama, M. Guchait, S. Karmakar, S. Kumar, G. Majumder, K. Mazumdar, S. Mukherjee, D. Roy
Indian Institute of Science Education and Research (IISER), Pune, India S. Dube, B. Kansal, S. Pandey, A. Rane, A. Rastogi, S. Sharma
Department of Physics, Isfahan University of Technology, Isfahan, Iran H. Bakhshiansohi37, M. Zeinali38
Institute for Research in Fundamental Sciences (IPM), Tehran, Iran S. Chenarani39, S.M. Etesami, M. Khakzad, M. Mohammadi Najafabadi University College Dublin, Dublin, Ireland
M. Felcini, M. Grunewald
INFN Sezione di Bari a, Università di Bari b, Politecnico di Bari c, Bari, Italy M. Abbresciaa,b, R. Alya,b,40, C. Arutaa,b, A. Colaleoa, D. Creanzaa,c, N. De Filippisa,c, M. De Palmaa,b, A. Di Florioa,b, A. Di Pilatoa,b, W. Elmetenaweea,b, L. Fiorea, A. Gelmia,b,