© TÜBİTAK
doi:10.3906/kim-1805-39 h t t p : / / j o u r n a l s . t u b i t a k . g o v . t r / c h e m /
Research Article
Computational investigation of influenza A virus M2 protein inhibition
mechanism by ion channel blockers
Mehmet ÖZBİL∗,
Department of Molecular Biology and Genetics, Faculty of Arts and Sciences, İstanbul Arel University, İstanbul, Turkey
Received: 17.05.2018 • Accepted/Published Online: 10.12.2018 • Final Version: 05.02.2019
Abstract: The M2 protein of the influenza A virus, responsible for flu, is a homotetramer transmembrane protein,
forming a transmembrane ion channel, where His 37s act as pH sensors and Trp 41s and Asp 44s act as channel gates. Opening of this channel leads to transfer of virus RNA into the human host. Thus, blocking this transfer is an important pharmaceutical strategy to stop infection. As a result of viral drug resistance, commercially available channel inhibitors, rimantadine (RIM) and amantadine (AMA), are not as effective as they used to be. Understanding binding sites and outcomes of binding will lead to new inhibitor design studies. Here, utilizing molecular docking with classical and constant pH molecular dynamics simulations, two novel binding sites for RIM and AMA molecules were revealed. Both structural and chemical effects of inhibitors on M2 protein on the closed, inactive M2 channel structure were investigated. Upon binding of the inhibitor molecules, decrease in ion channel cross-distances was observed. Meanwhile, RIM binding did not alter protonation of His 37s and Asp 44s, whereas AMA binding drastically increased the protonation population of two residues from different monomers, creating a more basic channel at physiological pH.
Key words: Influenza A M2, ion channel, molecular dynamics simulations, constant pH molecular dynamics simulations,
rimantadine, amantadine
1. Introduction
M2 protein is a homotetramer transmembrane protein, which has a pivotal role in influenza A virus, responsible for flu. The first 23 amino acids of the N-terminal facilitate binding to the host cell, amino acids 23–46 form the transmembrane alpha helix that constructs the proton channel, and amino acids located at the C-terminal are responsible for viral proliferation.1,2 In the alpha helix region amino acid His 37 acts as a pH sensor and Trp 41 forms the gate of the channel.3 Additionally, Asp 44 is believed to stabilize Trp 41 through H-bonding.4,5 Any change in protonation states of amino acids His 37 and Asp 44 upon pH alteration of the environment is known to destabilize Trp 41 and consequently the ion channel turns into an open conformation. However, protonation states of His 37 residues are still under debate, and despite numerous experimental and theoretical studies, protonation states of four His 37s are not clear.6−10 In 2010, Acharya et al. solved the high resolution (1.65 Å) X-ray structure of the M2 tetramer and revealed that two of four His 37s were protonated at δ and ε sites (fully protonated) and two were protonated only at ε sites.11
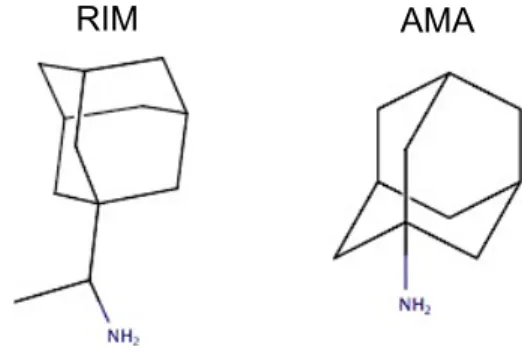
There are two commercially available drugs used widely for M2 channel inhibition, rimantadine (RIM) and amantadine (AMA), drawn in Figure 1. However, in humans, birds, and pigs, drug resistance has reached ∗Correspondence: [email protected]
more than 90% recently.12 In addition, the use of amantadine as an antiinfluenza drug is limited as it displays nervous system side effects.13 Thus, active research for designing novel channel inhibitors is underway. AMA was shown to bind into a hydrophobic pocket consisting of Val 27, Ala 30, and Ser 31 in the X-ray structure by Stouffer et al,14 whereas in the NMR structure resolved by Schnell et al., RIM binding pockets were formed by Leu 40, Trp 41, Ile 42, Leu 43, Asp 44, and Arg 45, located both inside and outside of the channel.15 There are numerous studies on the structural effects of AMA and RIM binding to ion channels, which can be found in the detailed review by Hong and DeGrado.8 On the other hand, there is a limited number of studies focused on the alteration of protonation states of His 37 and Asp 44 residues.16,17 These NMR studies revealed that upon amantadine binding protonation states of His 37 residues changed, revealing a chemical effect on the proton channel.
RIM
AMA
Figure 1. 2D drawings of RIM and AMA ligands.
This work will address the structural and chemical effects of inhibitor binding on the inactive closed conformation M2 protein channel through a plethora of computational calculations. Four binding sites, two of which were observed for the first time, were revealed and structural alterations were investigated through molecular docking and classical molecular dynamics (MD) simulations. Then the chemical effects of inhibitor binding were studied by analyzing the shift in protonation states of His 37 and Asp 44 residues through constant pH MD simulations. This article is organized in the following manner: binding sites will be discussed together with structural consequences observed upon binding and chemical effects by alteration in protonation states of residues His 37 and Asp 44 will be discussed for each type of binding of RIM, followed by AMA.
2. Results and discussion
2.1. Structural effects of RIM binding
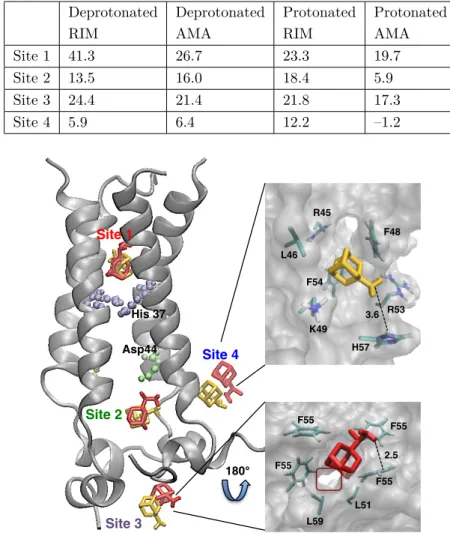
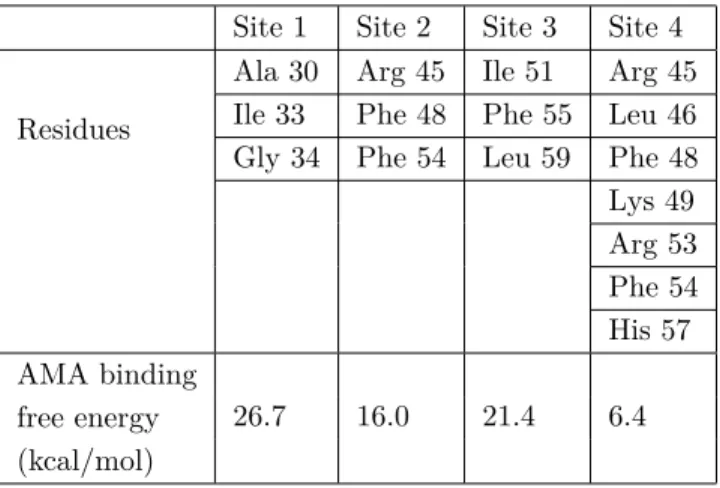
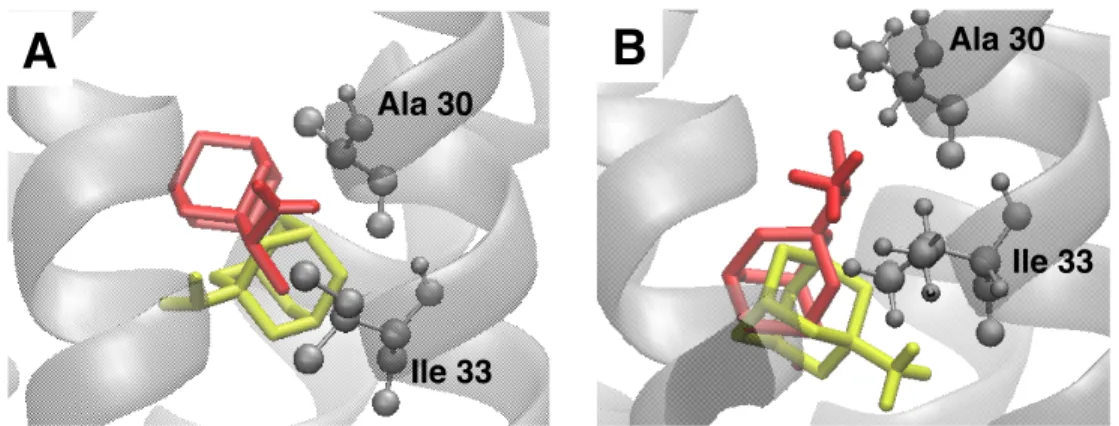
Four binding sites were identified for RIM on M2 protein, listed in Table 1. Sites 1 and 2 were located inside the proton channel, site 3 was located at the bottom of the channel, towards the intracellular space, and site 4 was located outside the channel (Figure 2). Binding site 1 was located just above the pH sensor His 37 residues and consisted of residues Ala 30, Ile 33, and Gly 34. RIM interacted with Ala 30 through H-bonding between its amine H atoms and backbone O atoms of two of the Ala 30 residues, and side chains of Ile 33 and Gly 34 residues created a hydrophobic cleft for the ligand. Binding energy of the ligand in this binding site was computed as 41.3 kcal/mol (Table 2). This binding site was also identified in different experimental and computational studies.6,15,18 However, in these studies RIM was observed in protonated form, whereas free binding energies from MD simulations clearly showed that RIM is deprotonated. Detailed discussion of deprotonation of ligands is provided in Section 2.5. Comparison of intermolecular distances between C α atoms of amino acid pairs chosen from four different regions of the channel, summarized in Table 3, clearly indicated a
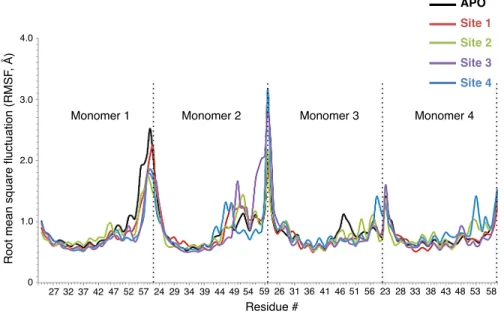
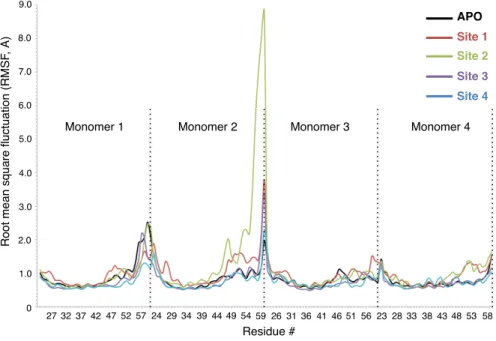
constricted channel from the Val 27 region upon ligand binding. Changes in distances between two monomers across the channel were also observed at the His 37 and Lys 49 amino acid regions. Binding site 2 was located inside the channel, below pH sensor His 37 and channel gate Trp 41 residues. This binding site was the most frequently detected binding site by RIM, with 53% of total hits, in molecular docking simulations and it is the first of two novel sites observed in this study. This site was formed by amino acids Asp 44, Phe 47, Phe 48, and Ile 51. The amine H atom of RIM made an H-bond with the backbone O atom of Asp 44, whereas Phe and Ile residues created a highly hydrophobic cleft. Binding energy of the ligand in this binding site was computed as 13.5 kcal/mol. The channel distance comparison revealed slight constriction at Trp 41 and Lys 49 regions, but expansion in other regions of the channel, surprisingly. The reason for this expansion may well be the protein’s effort to accommodate the ligand inside the channel. Site 3 is the second novel binding site, located at the bottom of the channel, that has never been observed before. This highly hydrophobic binding pocket consisted of Ile 51, Phe 55, and Leu 59. One of the amine H atoms formed NH- π interaction with the benzene ring of one of the Phe 55 residues. Other Phe, Leu, and Ile residues provided a hydrophobic pocket for the ligand. Binding energy of the ligand in this binding site was computed as 24.4 kcal/mol, which is the second best for RIM binding. Upon ligand binding two regions of the channel constricted slightly. These regions were the Val 27 region and Lys 49 region, where the ligand was bound. This binding site seems very promising for ligand binding because it lay at one of the narrowest points of the channel, surrounded by highly hydrophobic Phe and Leu residues, and highly bulky phenyl rings of Phe residues. Moreover, it was the exit of the channel into intracellular space. Binding site 4 is the only outside binding pocket obtained in this study. This binding site was located slightly lower than the binding site observed in the NMR structure by Schnell et al.15 From docking simulations the same binding site resolved in the NMR structure was obtained, where the ligand interacted with residues Ile 42 and Leu 46. However, after classical MD simulations RIM moved slightly down and was stabilized in this new binding site, which consisted of Phe 47, Phe 48, and Arg 53 residues. In this pocket, the amine group of RIM formed a very strong H-bond with the HH atom of Arg 53 and side chains of Phe 47 and Phe 48 amino acids formed a highly hydrophobic pocket. Due to its outside position, this binding site was formed by only one monomer of the M2 tetramer, which explains the lowest binding energy computed for the RIM ligand, 5.9 kcal/mol (Table 1). Binding of RIM constricted the channel at two regions, Val 27 and His 37. The Val 27 region was constricted the most among all other RIM binding cases, close to 2 Å on one side and 0.1 Å on the other side. In addition, similar to binding site 1, binding to this site tightened the channel from the His 37 region, which together with Trp 41 is known to be the channel volume controller. Therefore, binding to this pocket might have significant functional outcomes, which might require an experimental study. Analysis of root mean square fluctuation (RMSF) values for individual amino acids indicates significant changes upon RIM ligand binding. As seen from Figure 3, RIM binding increased RMSF values of the second monomer in the region between residues Asp 44 and Lys 60. Especially binding to sites 3 and 4 increased RMSF values of C-terminal residues sharply. Binding to site 4 also increased RMSF values of the third and fourth monomers. On the contrary, binding of the ligand decreased RMSF values only at the C-terminal of monomer 1 and Asp 44–Ser 50. These simulations demonstrated that ligand binding significantly altered the fluctuation of residues in this region specifically, which hosts the Asp 44 residue, responsible for channel gating.
2.2. Chemical effects of RIM binding
Chemical effects of ligand binding were analyzed by examining deprotonation populations of His 37 and Asp 44 residues. Deprotonation populations obtained from CPHMD simulations of 5 ns in length were compared
Table 1. Binding sites for RIM on M2 protein. Site 1 Site 2 Site 3 Site 4
Residues
Ala 30 Asp 44 Ile 51 Phe 47 Ile 33 Phe 47 Phe 55 Phe 48 Gly 34 Phe 48 Leu 59 Arg 53
Ile 51 RIM binding free
energy (kcal/mol) 41.3 13.5 24.4 5.9
Table 2. Calculated binding free energies for deprotonated and protonated ligands on M2 protein in kcal/mol. Deprotonated Deprotonated Protonated Protonated
RIM AMA RIM AMA
Site 1 41.3 26.7 23.3 19.7 Site 2 13.5 16.0 18.4 5.9 Site 3 24.4 21.4 21.8 17.3 Site 4 5.9 6.4 12.2 –1.2 L59 L51 F55 F55 F55 F55 Site 1 Site 2 Site 3 Site 4 His 37 Asp44 K49 R53 F54 F48 R45 L46 H57 180° 3.6 2.5
Figure 2. Binding sites for RIM (shown in red) and AMA (shown in yellow) on M2 protein. Novel binding sites (sites
2 and 3) are shown in detail for AMA and RIM, respectively. Site 3 was viewed from the bottom of the protein and the ion channel can be seen in red frame. H-bond distances in Å are shown in the figure.
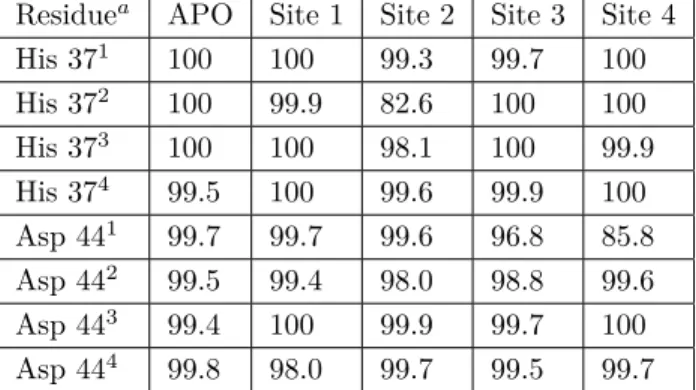
for APO and ligand bound M2 structures. As can be seen from Table 4, in the APO M2 structure all His 37 and Asp 44 residues were calculated to be in the deprotonated state. Only the His 37 residue located in monomer 4 was found to be protonated 0.5% of the time ( +1 state). Although this seems to contradict with
Table 3. Channel distances in Å between different pairs of residues from each of four monomers upon RIM binding. Regiona APO Site 1 Site 2 Site 3 Site 4
V271–V273 13.4 12.5 13.5 12.1 11.6 V272–V274 10.6 10.6 10.6 10.7 10.5 H371–H373 12.1 12.0 12.9 12.2 12.3 H372–H374 11.7 12.0 11.8 11.9 11.4 W411–W413 13.1 13.2 12.7 13.2 13.2 W412–W414 14.1 14.5 14.5 14.2 14.1 K491–K493 20.7 19.7 20.9 19.7 21.1 K492–K494 18.6 19.1 17.7 18.8 19.0
aEach monomer number is given in subscript. Two distances in each region define the cross-section of the channel in
that region. Val 27 is located at the entrance (top) and Lys 49 at the exit (bottom) of the channel. These regions are pictured in Figure 9. 27 32 0 1.0 2.0 3.0 4.0 R o o t me a n sq u a re flu ct u a tio n (R MSF , Å ) Residue # Site 1 Site 2 Site 3 Site 4 37 42 47 52 57 24 29 34 39 44 49 54 59 26 31 36 41 46 51 56 23 28 33 38 43 48 53 58
Monomer 1 Monomer 2 Monomer 3 Monomer 4
APO
Figure 3. RMSF values for APO and RIM bound M2 proteins.
the experimental +2 state obtained in the high resolution crystal structure (PDB ID: 3BLW),.11 it should be recalled that the crystal structure was obtained at pH 6.51, whereas our calculations were performed at pH 7.0. Where the APO and ligand RIM bound structures are concerned, it should be stated that any change smaller than 4% in deprotonation percentages reported in Table 4 is not taken as a significant change. Although there is no reference in the literature for this cut-off value, the high number of small alterations around 1%–2% led us to believe that the precision of these calculations is below 2%–3%. Thus, in the manuscript only changes above 4% will be discussed. Binding to site 1 did not result in any significant alteration of the protonation state of His 37 and Asp 44 residues, but only that of the Asp 44 residue in the first monomer, where the deprotonation population decreased by 4.3%. This was interesting because the binding site was considerably far away from the Asp 44 residue. Binding to site 2 had no significant effect on deprotonation populations. RIM binding to site 3 had the highest influence on protonation states. Binding caused a slight reduction of deprotonation of
His 37 on monomer 3. In contrast, it reduced Sdeprot of His 37 of monomer 2 by 5.7%. This finding was very interesting because, although binding site 1 is much closer to the His 37 residues, binding did not affect the protonation of these residues. This novel binding site also reduced Sdeprot of Asp 44 of monomer 1 by 5.1%. RIM binding to this newly identified binding site had the highest chemical impact on M2 protein. Binding to site 4, the only binding site located outside the channel, did not show any significant alteration for any of the residues.
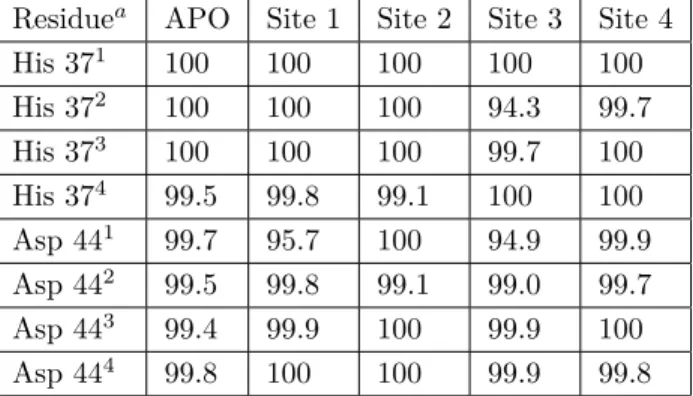
Table 4. Deprotonation (Sdeprot) populations (%) for each of His 37 and Asp 44 residues for APO and RIM bound M2
proteins.
Residuea APO Site 1 Site 2 Site 3 Site 4
His 371 100 100 100 100 100 His 372 100 100 100 94.3 99.7 His 373 100 100 100 99.7 100 His 374 99.5 99.8 99.1 100 100 Asp 441 99.7 95.7 100 94.9 99.9 Asp 442 99.5 99.8 99.1 99.0 99.7 Asp 443 99.4 99.9 100 99.9 100 Asp 444 99.8 100 100 99.9 99.8
aEach monomer number is given in subscript.
2.3. Structural effects of AMA binding
Similar to RIM binding, four binding sites were identified on M2 protein, listed in Table 5. These sites are identical to RIM binding sites, sites 1 and 2 located inside the channel, site 3 at the exit of the channel, and site 4 located outside the channel (Figure 1). At binding site 1, the amine group of the ligand made a strong H-bond with the HD1 atom of His 37. Residues Ala 30, Ile 33, and Gly 34 created a hydrophobic cleft, which hosted the hydrophobic part of the ligand. The binding energy of the ligand in this binding site was computed as 26.7 kcal/mol. AMA binding at this site drastically decreased one of the distances at the Val 27 and Lys 49 regions (1.6 Å and 3.7 Å, respectively), as listed in Table 6. On the contrary, the binding slightly increased intermolecular distances at the His 37 and Trp 41 regions for both monomer pairs. At binding site 2, one of the two novel sites, the AMA ligand made two strong H-bonds with the Arg 45 residue from monomer 1. One of them involved the side chain of the residue and the amino group of AMA, and the other involved the backbone O of Lys 49 from monomer 4 and the amino group of AMA. Another important interaction is NH- π interaction between the amino group of AMA and the benzene ring of Phe 54 on monomer 4. Moreover, Phe 48 residues from all monomers created a hydrophobic cleft for the ligand, which was buried in that pocket. Binding energy of AMA in this binding site was computed as 16.0 kcal/mol (Table 5). Binding at this site resulted in constriction of one distance at each part of the channel, which was observed for the first time in this study. Binding site 3, the second novel binding site for AMA, was located at the exit of the channel, towards the intracellular space. Interactions holding AMA at this binding site are purely hydrophobic. Ile 51, Phe 55, and Leu 59 residues from each monomer created this highly hydrophobic cleft. Binding energy of the ligand in this binding site was computed as 21.4 kcal/mol, which is only 5.3 kcal/mol lower than the energy computed upon binding at site 1. Interestingly, binding to this end of the channel slightly decreased the channel diameter at the Val 27 region, the entrance of the channel. One distance decreased by 1.8 Å, while the other increased by
0.5 Å. Similarly, a slight decrease of 0.6 Å was observed for the His 37 region. On the other hand, the channel expanded slightly at the Trp 41 and Lys 49 regions, which was similar to the Trp 41 region expansion also observed upon ligand binding at site 1 (Table 6). Site 4, similar to binding site 4 for the RIM ligand, which was the only pocket located outside the channel, possessed a highly hydrophobic character. The AMA ligand formed H-bonds only with the Arg 53 and His 57 residues. The Phe 48 and Phe 54 residues from monomer 4 created one side of the hydrophobic pocket. The side chain of Leu 46 and long carbon chains of Arg 45 and Lys 49 side chains formed the other side of this highly hydrophobic pocket. This type of hydrophobic interaction is commonly observed in proteins.19 Binding energy of the ligand in this binding site was computed as 6.4 kcal/mol, which is the lowest binding energy calculated for the AMA ligand. Binding at this site constricted the channel at the Val 27 region, decreasing one distance by 2.3 Å and increasing the other by 1.0 Å. Surprisingly, binding expanded the channel at the Trp 41 region. Distances increased by 0.5 and 0.7 Å, marking a significant expansion. Moreover, expansion at the end of the channel, at the Lys 49 region, was observed. Binding at site 1 reduced RMSF values of only the C-terminal of monomer 1 compared to APO M2 protein (Figure 4). Binding increased the RMSF values for almost the entire protein, increasing values extremely for the Phe 47–Lys 60 region of monomer 2. Binding at site 2 affected the RMSF values the most, increasing drastically at the Leu 43–Lys 60 region at monomer 2, the C-terminal having the biggest increment. A similar but smaller increment in RMSF values at the Asp 44–Lys 60 region of monomer 4 was observed. Binding at site 3 did not lead to any significant alterations of RMSF values, except for a slight decrease at the C-terminal region of monomer 1 and significant increase at the C-terminal of monomer 2. Binding to site 4, the outside binding site, did not have a significant effect on RMSF values. Similar to RIM binding, alteration in the fluctuation of the transmembrane proton channel might have important functional consequences.
Table 5. Binding sites for AMA on M2 protein. Site 1 Site 2 Site 3 Site 4
Residues
Ala 30 Arg 45 Ile 51 Arg 45 Ile 33 Phe 48 Phe 55 Leu 46 Gly 34 Phe 54 Leu 59 Phe 48 Lys 49 Arg 53 Phe 54 His 57 AMA binding 26.7 16.0 21.4 6.4 free energy (kcal/mol)
2.4. Chemical effects of AMA binding
Similar to RIM binding, chemical outcomes of AMA binding on the protein were analyzed by investigating deprotonation populations of His 37 and Asp 44, shown in Table 7. Where APO and ligand AMA bound structures are concerned, it should be restated that any change smaller than 4% in deprotonation percentages reported in Table 7 was not taken as a significant change for the aforementioned reasons. Binding of AMA at binding site 1 did not change the deprotonation populations of His 37s and Asp 44s significantly. Binding
Table 6. Channel distances in Å between different pairs of residues from each four monomers upon AMA binding. Regiona APO Site 1 Site 2 Site 3 Site 4
V271–V273 13.4 11.8 12.3 11.6 11.1 V272–V274 10.6 15.2 11.0 11.1 11.6 H371–H373 12.1 12.6 11.7 11.5 11.8 H372–H374 11.7 12.1 12.6 11.9 12.0 W411–W413 13.1 13.7 12.9 12.9 13.6 W412–W414 14.1 14.2 14.7 14.9 14.8 K491–K493 20.7 21.0 21.6 21.6 22.5 K492–K494 18.6 14.9 17.7 18.5 18.4
aEach monomer number is given in subscript. Two distances in each region define the cross-section of the channel in
that region. Val 27 is located at the entrance (top) and Lys 49 at the exit (bottom) of the channel. These regions are pictured in Figure 9. 27 32 0 1.0 2.0 3.0 6.0 R o o t me a n sq u a re flu ct u a ti o n (R MSF , Å ) Residue # 37 42 47 52 57 24 29 34 39 44 49 54 59 26 31 36 41 46 51 56 23 28 33 38 43 48 53 58
Monomer 1 Monomer 2 Monomer 3 Monomer 4
Site 1 Site 2 Site 3 Site 4 APO 4.0 5.0 7.0 8.0 9.0
Figure 4. RMSF values for APO and AMA bound M2 proteins.
at site 2 affected protonation states of all His 37 and Asp 44 amino acids, demonstrating the most dramatic alterations observed for both ligands. Deprotonation of His 37 at monomer 2 by 17.4% was the highest change upon ligand binding in the current study. This binding mode of the AMA ligand clearly increased protonation of this particular His 37 and slightly Asp 44 at monomer 2 by 2.0%, which clearly changed the chemical identity of the channel, creating a tunnel with more basic character. Binding at site 3 slightly decreased the deprotonation populations of Asp 44 at monomer 1 by 3.2% and at monomer 2 by 1.2%, which are not very significant changes and are below the 4.0% alteration cut-off applied in this study (Table 7). Binding at site 4 resulted in the second biggest alterations after binding at site 2. Protonation populations of His 37s remained the same, while the deprotonation population observed for Asp 44 at monomer 1 decreased by 14.2%. This was the second highest alteration of protonation state observed in the study. Deprotonation to 85.8%, or in other words protonation
to 14.2%, revealed significant basicity for this Asp 44 amino acid. The change in protonation states might be a result of proton transfer between M2 amino acids and water molecules located nearby, observed in the most representative structures from MD simulations.
Table 7. Deprotonation (Sdeprot) populations (%) for each His 37 and Asp 44 residue for APO and AMA bound M2
proteins.
Residuea APO Site 1 Site 2 Site 3 Site 4
His 371 100 100 99.3 99.7 100 His 372 100 99.9 82.6 100 100 His 373 100 100 98.1 100 99.9 His 374 99.5 100 99.6 99.9 100 Asp 441 99.7 99.7 99.6 96.8 85.8 Asp 442 99.5 99.4 98.0 98.8 99.6 Asp 443 99.4 100 99.9 99.7 100 Asp 444 99.8 98.0 99.7 99.5 99.7 aEach monomer number is given in subscript.
2.5. Docking simulations of protonated ligands on M2 protein
As ligands have high pKa values (for amantadine pKa = 9),20 protonated RIM and AMA ligands (bearing +1 charge with NH+
3 group) were docked on M2 protein. Similar binding sites were observed with differences in ligand orientations. This resulted in a slight decrease in binding affinities obtained by AutoDock Vina, around 0.2 kcal/mol. However, upon calculation of free binding energies with MD simulations of 500 ps, drastic changes were observed. Binding free energies, provided in Table 2, clearly decreased for AMA and in two cases for RIM. These changes in binding energies were due to the change in hydrophobic interactions and the new dominance of electrostatic interactions created by the NH+
3 group (Figure 5). Only the RIM ligand bound in sites 2 and 4 showed a significant increase in binding energies, 4.9 kcal/mol and 6.3 kcal/mol, respectively. However, it is very hard to rule out protonated forms of ligands in general, except RIM binding into site 1 and AMA binding into site 2. In these two cases of deprotonated ligands the binding free energy differences clearly favored the protonated form of ligands. It is noteworthy that the sum of the binding energy and deprotonation energy determines the protonation state of the binding ligand. As mentioned above, both ligands have high pKa values and are expected to be protonated in bulk water. Thus, free energy of deprotonation cost will be around 5–10 kcal/mol. In addition, error of margin in binding free energy calculations, 1–2 kcal/mol, must be taken into account. As a result, according to the calculated binding energies in Table 2, it is very hard to decide which form of ligands will bind dominantly. Moreover, calculated binding free energies were higher for protonated RIM into binding site 2. Chew et al. also studied protonation/deprotonation of adamantane ligands in a lipid layer.20 They concluded that membrane-permeant ligands must be in deprotonated form. However, the exact time of deprotonation of the ligands, whether in bulk solution or upon absorption into the lipid layer, was not clearly known.
2.6. Conclusions
Elevated drug resistance of M2 protein towards inhibitors inspired recent pharmaceutical research to design more potent inhibitors than the already available inhibitors, RIM and AMA. The main strategy focuses on blocking
A
B
Ala 30
Ile 33
Ala 30
Ile 33
Figure 5. A) Orientations of deprotonated ligands, B) orientations of protonated ligands. RIM is shown in red and
AMA is shown in yellow.
the ion channel, either by directly blocking it or constricting it through an allosteric pathway. However, the exact mechanisms of action of these inhibitors are not well understood yet. In this study, first the binding sites of RIM and AMA were searched through tandem molecular docking and classical molecular dynamics studies. For this purpose, both deprotonated and protonated forms of the ligands were studied on the high pH, inactivated conformation of the M2 channel. All binding sites consisted of mainly hydrophobic residues, which resided in the common adamantane part of the inhibitor molecules, three connected cyclohexane rings in chair configuration. Apart from confirming the already observed binding sites, two novel binding sites for each inhibitor molecule were elucidated. These sites, sites 2 and 3, were located at the exit of the channel and outside of the channel, respectively. Computed binding energies revealed that both ligands were bound to the protein in binding sites 1 and 3 more tightly than in binding sites 2 and 4. When compared with protonated ligands, deprotonated ligands had significantly higher binding free energies, except for RIM binding at sites 2 and 4. The reason for this was the dominance of hydrophobic interactions, especially for RIM, the CH3 group next to the amine group. Protonation of the amine group shields this methyl group; thus, RIM cannot interact with M2 through strong hydrophobic interactions. Moreover, RIM was reported to bind into site 1 as a deprotonated ligand in this study, to our knowledge for the first time in the literature. Moreover, it was obvious that AMA binds into site 2 in the deprotonated state as well. For other binding sites, it was very hard to clearly state which protonation forms of ligands were dominant. The reason for that is the small free binding energy difference, ranging from 2.6 kcal/mol to 7.6 kcal/mol, which might be the consequence of deprotonation free energy of ligands and calculation error. Structural analysis in the study also revealed that binding of both inhibitor molecules on site 1 and site 3 either decreased or retained channel width. After identifying the precise inhibitor binding sites, chemical effects of binding were investigated. By utilizing constant pH molecular dynamics simulations, alteration of protonation states for residues His 37 and Asp 44 upon binding were investigated. His 37s are known to act as a pH sensor of this channel, and Asp 44s together with Trp 41s are the gates of the channel. Binding of RIM did not alter protonation states of His37s and Asp44s significantly. However, AMA altered the protonation states of these two residues, proving the chemical effect of inhibitor binding. Especially binding of AMA at binding sites 2 and 4 increased protonation of these two residues, by 17.4% and 14.2%, respectively. Increased protonation means increased basic character for the channel, which is just the opposite of the high acidity required for the virus. This study revealed precise binding sites for two commercially available inhibitor molecules for the M2 protein channel of influenza A virus, including two novel binding sites. Between these two novel binding sites, site 3 proved to be a better candidate for both RIM and AMA ligands with higher binding
affinity and better channel width retention or constriction. In addition, chemical effects of the inhibitors on the channel’s protonation were elucidated, which will guide future inhibitor design studies.
3. Experimental
3.1. Classical molecular dynamics simulations
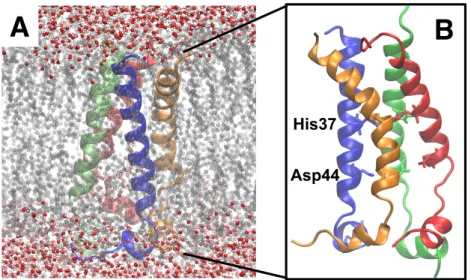
All classical MD simulations were performed using the GROMACS 5.0.0 program,21−23 which was utilized with GROMOS force field GROMOS96 53A6.24 Initial coordinates for the M2 protein channel region were taken from solution NMR structure (PDB ID: 2KIH).25 In this structure, the Ser 31 residue was mutated to Asn; thus, it was mutated back to Ser by utilizing VMD 1.9.1 software.26 The ligand-free M2 protein was embedded into a DPPC (dipalmitoyl phosphatidylcholine) membrane model.27 Later, the system was placed in a truncated rectangular box with dimensions of 6.2 × 6.2 × 10.6 nm. These dimensions ensured that at any point of the simulation the proteins stayed in the simulation box. The box was filled with single point charge (SPC) water molecules.28 and some of them were displaced during the addition of chloride ions to neutralize the system, visualized in Figure 6.
A
B
His37
Asp44
Figure 6. A) System that was utilized in classical MD simulations. M2 protein was embedded in DPPC lipid bilayer
and this complex was put into simulation box and filled with SPC water molecules. B) Zoomed in view of M2 protein, each monomer shown with a different color. Titratable His 37 and Asp 44 residues are shown with stick representation.
Starting structures were subsequently energy-minimized using the steepest descent method for 50,000 steps. Energy-minimized structures were taken for the production phase. MD simulations without any con-straints were carried out using a constant number of particles (N), pressure (P), and temperature (T), i.e. NPT ensemble, which is slightly above the phase transition temperature of the DPPC lipid layer. The SETTLE algorithm was used to constrain the bond length and bond angle of the water molecules,.29 while the LINCS algorithm was used to constrain the bond length of the peptide.30 Long-range electrostatic interactions were calculated by the particle-mesh Ewald method.31 A constant pressure of 1 bar was applied with a coupling constant of 1.0 ps and water molecules/chloride ions were coupled separately to a bath at 323 K with a coupling constant of 0.1 ps. This temperature was above the phase transition temperature of DPPC. The equation of motion was integrated at 2 fs time steps using a leap-frog algorithm.32 The tools available in the GROMACS
program package and VMD software were used to analyze the MD trajectories. Structures of ligands were optimized by using YASARA software with YAMBER force field.33,34 Parameters for the ligands, RIM and AMA, were obtained from the PRODRG server.35
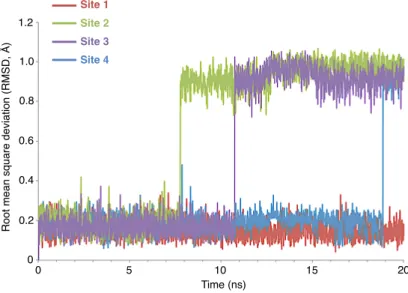
The production run for ligand-free (APO) M2 protein lasted for 50 ns. MD simulations of ligands in different binding pockets, obtained from molecular docking simulations, were run for 20 ns to ensure the stability of ligands in the binding pockets. Root mean square deviation (RMSD) graphs for RIM and AMA ligands in binding pockets, which revealed stable binding of the ligands, are provided in Figures 7 and 8, respectively.
0 5 10 15 20 0 0.2 0.4 0.6 0.8 1.0 1.2 R o o t me a n sq u a re d e vi a ti o n (R MSD , Å ) Time (ns) Site 1 Site 2 Site 3 Site 4
Figure 7. RMSD values for RIM ligands bound at each binding site. RMSD values lower than 3.0 Å and straight graphs
proved that ligands were stable at binding sites.
0 5 10 15 20 0 0.1 0.2 0.3 0.4 0.5 0.6 R o o t me a n sq u a re d e vi a ti o n (R MSD , Å ) Time (ns) Site 1 Site 2 Site 3 Site 4 0.7 0.8
Figure 8. RMSD values for AMA ligands bound at each binding site. RMSD values lower than 3.0 Å and straight
graphs proved that ligands were stable at binding sites.
Ligand binding energies were calculated by utilizing YASARA Dynamics md_analyzebindingenergy macro.36 In order to use this module, MD simulations of 500 ps long were run with the same parameters
d
2
d
1
1
2
3
4
Val27
His37
Trp41
Lys49
Figure 9. Four different regions, Val 27, His 37, Trp 41, and Lys 49, where distances between C α atoms were calculated
and are provided in Table 3 and Table 6. These distances reveal the channel diameter for different regions of the channel.
utilized in production runs. Ligands were found to be stable in their binding sites. As details can be found in the YASARA manual, this module calculates free energy without the entropy term from normal mode analysis.
G = Ebind+ Eel+ EvdW+ Gpolar+ Gnonpolar− T S (1) Here, the first three terms are molecular mechanics (MM) terms of binding, electrostatic, and van der Waals interactions, respectively. Gpolar and Gnonpolar are polar and nonpolar contributions of solvation free energies, respectively. TS is the entropy effect, which is neglected. Then binding free energy is calculated by the following equation.
Binding energy = (GReceptor+ GLigand) + (GsolvReceptor+ GsolvLigand)− (GComplex+ GsolvComplex) (2) Here, the first two terms are potential energies of the receptor and ligand, the next two terms are solvation energies of the receptor and ligand, and the last terms are potential and solvation energies of the complex.
YASARA, as explained in its manual, provides positive binding energies (http://www.yasara.org/macros.htm). A more positive value indicates a better binding, whereas a negative number indicates very weak binding, but not nonbinding. Similar data utilizing YASARA can also be found in the studies by Dulebo et al.37 and Ozalp et al.38
Thus, it is very similar to the MM/PBSA method,39,40 except for the entropy term, which can be neglected in the context of the main goal of these calculations, where we compare ligand binding affinities for the same ligand in different binding sites and any error will be carried through all numbers.
3.2. Constant pH MD simulations
In classical MD simulations, protonation states of titratable amino acids are predetermined. However, in constant pH MD (CPHMD) simulations, the pH of the environment is kept fixed and predefined titratable amino acids are allowed to change their protonation states according to alteration in the microenvironment. There are many models nowadays to choose from for CPHMD simulations; in this study, the method by Donnini et al. was chosen.41 All free energy and CPHMD calculations were done utilizing the GROMACS
implementation GROMACS 3.3.3-CPHMD. This method will be briefly described now. First, the deprotonation free energy of each individual amino acid was calculated. In this study, deprotonation free energies of His and Asp amino acids that lay in the proton channel formed by four monomers were calculated by utilizing a thermodynamic integration method.42 For the His residue, only one protonation site, the NE2 atom, was allowed to change its protonation state. Although theoretically there can be four different protonation states, protonation/deprotonation of the NE2 atom are the most commonly observed states for His amino acid in large proteins in biological systems.43 For the Asp residue, only the OD2 atom was allowed to change its protonation state. Again, four different protonation states were possible, but in this study only OD2 was chosen to change its protonation state because of its proximity to neighboring Arg amino acid, which should affect its protonation state. These energies were in agreement with experimental values,44,45 which confirmed the method used, and are shown in Table 8. Then these energies were included in the Hamiltonian of the λ -particle system, whose Hamiltonian was defined as:
Table 8. Calculated deprotonation free energies for free His, Asp, and Glu amino acids in water together with comparison
of calculated and experimental pKa values.
Amino acid Calculated deprotonation
free energy (kcal/mol) Reference pKa Calculated pKa
His-NE 32.09 6.53 6.52 His-ND 37.79 6.92 6.94 Asp –63.51 3.94 5.12 Glu –53.68 4.25 4.50 H (λ) = (1− λ) H0 + λ H1 + HEnv +m 2 λ 2+U∗(λ), (3)
and V( λ) , the potential energy part of the Hamiltonian, was defined as:
V (λ) = (1− λ) V 0 + λ V 1 + V Env +U∗(λ). (4)
λ was allowed to change between 0 and 1, defining protonated and deprotonated states, respectively. Upon
calculating free energies of protonation, pKa values of free His and Asp amino acids were calculated through titration experiments at pH values ranging from 1.0 to 7.0. For each amino acid the fraction of deprotonated acid (Sdeprot) was calculated, and the Henderson–Hasselbalch equation was fitted to the obtained titration curve:
Sdeprot= 1
10(pKa−pH) + 1. (5)
The fraction of deprotonated states was calculated from λ values; steps with λ > 0.9 were counted as deprotonated while steps with λ < 0.1 were counted as protonated. Then this graph was fitted and the pH value at which Sdeprot was 0.5 was taken as pKa. To validate these calculations, pKa values for free His and Asp residues as well as His and Asp residues in hen egg-white lysozyme (HEWL), which was widely accepted as a reference system for pKa calculations,46,47 were calculated. Calculations on HEWL were made on the X-ray structure by Walsh et al. (PDB ID: 4LZT).48 Computed pKa values for free amino acids and residues in HEWL protein were within ± 1 pKa value error interval compared to experimental values and are shown in Table 9.
These calculations validated the method used in this study. For ligand-free M2 protein calculations, the most representative structure was obtained from classical MD simulations of 50 ns and pKa values for each of four His 37 and Asp 44 residues were calculated. Table 10 shows these values. For His 37 residues on monomers 1 and 3, pKa values could not be calculated, owing to pKa values of < 0.1. For monomers 2 and 4 extremely low values of 0.66 and 1.06 were calculated, respectively. Although these values are low for His residues, they reveal that the protein is in the deprotonated 0 state. Here it should be mentioned that this study deals with the closed (inactive) state of the proton channel. Thus, His residues are less exposed to solvent and their more likely protonated states could not be sampled. In the constant pH MD method applied in this study, it is stated by the developers that even with the biasing potential applied, only one protonation state can be sampled more dominantly for His.41 For Asp 44 residues the protonation/deprotonation picture was more clear and all pKa values were similar, and all Asp residues were clearly in the deprotonated state. For ligand (RIM and AMA)-bound M2 protein calculations, the most representative structures from classical MD simulations of 20 ns with ligands bound on the corresponding binding pockets were utilized. Proteins were placed in rectangular water boxes with dimensions of 5.0 × 6.0 × 8.2 nm, which were filled with SPC water molecules. Parameters were kept the same as in classical MD simulations, which were described thoroughly in the previous section. Temperature was set to 300 K. For M2 proteins, Sdeprot for each His 37 and Asp 44 were calculated at physiological pH 7.0. Sdeprot values were given in percentages as the ratio of deprotonated states to total number of states.
Table 9. Comparison of experimental and calculated pKa values for His 15 and Asp 18 residues in HEWL protein. Amino acid Reference pKa Calculated pKa
His 15 5.36 4.60
Asp 18 2.66 1.92
Table 10. Calculated pKa values for His 37 and Asp 44 residues in M2 protein. Residue pKavalue Residue pKavalue
His 371 NA Asp 441 2.96 His 372 0.66 Asp 442 3.39 His 373 NA Asp 443 2.80 His 374 1.06 Asp 444 3.29
3.3. Molecular docking simulations
All docking simulations were performed utilizing AutoDock Vina 1.1.2 software.49 M2 protein structures were obtained by taking snapshots of each 1 ns of the last 20 ns of classical MD simulations of ligand-free M2 protein. Twenty protein structures were put into a grid box to occupy the whole ligand–M2 protein system and the spacing was kept at 1.00 Å, a standard value for AutoDock Vina. Each docking trial produced 20 poses with the exhaustiveness value of 20. Rigid docking with this methodology made sure that flexibility of protein side chains were included in docking simulations, which was performed previously by the author.50 Structures of ligands were optimized by using YASARA software with YAMBER force field.33,34 Binding poses were clustered and four binding pockets for each ligand were assessed. Criteria for clusters were bearing the
highest binding affinity and the highest population of hits. Docking simulations for each ligand were repeated twice as AutoDock Vina uses a stochastic optimization algorithm. These repeated simulations produced very similar binding results with very similar binding affinities.
Acknowledgments
This work was funded by the Scientific and Technological Research Council of Turkey (TÜBİTAK) and the grant number was 115C123. The MD simulations were run at supercomputing facility TRUBA, hosted by TÜBİTAK ULAKBİM.
References
1. Skehel, J. J.; Bayley, P. M.; Brown, E. B.; Martin, S. R.; Waterfield, M. D.; White, J. M.; Wilson, I. A.; Wiley, D. C. P. Natl. Acad. Sci. USA 1982, 79, 968-972.
2. Lamb, R. A.; Zebedee, S. L.; Richardson, C. D. Cell 1985, 40, 627-633.
3. Tang, Y.; Zaitseva, F.; Lamb, R. A.; Pinto, L. H. J. Biol. Chem. 2002, 277, 39880-39886.
4. Chizhmakov, I. V.; Ogden, D. C.; Geraghty, F. M.; Hayhurst, A.; Skinner, A.; Betakova, T.; Hay, A. J. J. Physiol.
2003, 546, 427-438.
5. Ma, C.; Fiorin, G.; Carnevale, V.; Wang, J.; Lamb, R. A.; Klein, M. L.; Wu, Y.; Pinto, L. H.; DeGrado, W. F.
Structure 2013, 21, 2033-2041.
6. Cady, S. D.; Schmidt-Rohr, K.; Wang, J.; Soto, C. S.; DeGrado, W. F.; Hong, M. Nature 2010, 463, 689-692. 7. Leonov, H.; Arkin, I. T. Eur. Biophys. J. 2010, 39, 1043-1049.
8. Hong, M.; DeGrado, W. F. Protein Sci. 2012, 21, 1620-1633. 9. Takeuchi, H.; Okada, A.; Miura, T. FEBS Lett. 2003, 552, 35-38.
10. 10. Zhong, Q.; Newns, D. M.; Pattnaik, P.; Lear, J. D.; Klein, M. L. FEBS Lett. 2000, 473, 195-198.
11. Acharya, R.; Carnevale, V.; Fiorin, G.; Levine, B. G.; Polishchuk, A. L.; Balannik, V.; Samish, I.; Lamb, R. A.; Pinto, L. H.; DeGrado, W. F. et al. P. Natl. Acad. Sci. USA 2010, 107, 15075-15080.
12. Deyde, V. M.; Xu, X.; Bright, R. A.; Shaw, M.; Smith, C. B.; Zhang, Y.; Shu, Y.; Gubareva, L. V.; Cox, N. J.; Klimov, A. I. J. Infect. Dis. 2007, 196, 249-257.
13. Skehel, J. J. Nature 1992, 358, 110-111.
14. Stouffer, A. L.; Acharya, R.; Salom, D.; Levine, A. S.; Di Costanzo, L.; Soto, C. S.; Tereshko, V.; Nanda, V.; Stayrook, S.; DeGrado, W. F. Nature 2008, 451, 596-599.
15. Schnell, J. R.; Chou, J. J. Nature 2008, 451, 591-595. 16. Hu, J.; Fu, R.; Cross, T. A. Biophys. J. 2007, 93, 276-283.
17. Hu, F.; Schmidt-Rohr, K.; Hong, M. J. Am. Chem. Soc. 2012, 134, 3703-3713.
18. Chuang, G. Y.; Kozakov, D.; Brenke, R.; Beglov, D.; Guarnieri, F.; Vajda, S., Biophys. J. 2009, 97, 2846-2853. 19. Betts, M. J.; Russel, R. B. In Bioinformatics for Geneticists, Barnes, M. R.; Gray, I. C., Eds. Wiley: Hoboken,
NJ, USA, 2003, pp. 289-316.
20. Chew, C. F.; Guy, A.; Biggin, P. C. Biophys. J. 2008, 95, 5627-5636.
21. Berendsen, H. J. C.; van der Spoel, D.; van Drunen, D. Comput. Phys. Commun. 1995, 91, 43-56. 22. Lindahl, E.; Hess, B.; van der Spoel, D. J. Mol. Model. 2001, 7, 306-317.
23. Van Der Spoel, D.; Lindahl, E.; Hess, B.; Groenhof, G.; Mark, A. E.; Berendsen, H. J. C. J. Comput. Chem. 2005,
24. Oostenbrink, C.; Soares, T. A.; van der Vegt, N. F. A.; van Gunsteren, W. F. Eur. Biophys. J. 2005, 34, 273-284. 25. Pielak, R. M.; Schnell, J. R.; Chou, J. J. P. Natl. Acad. Sci. USA 2009, 106, 7379-7384.
26. Humphrey, W.; Dalke, A.; Schulten, K. J. Mol. Graphics 1996, 14, 33-38. 27. Tieleman, D. P.; Berendsen, H. J. C. J. Chem. Phys. 1996, 105, 4871-4880.
28. Berendsen, H. J. C.; Postma, J. P. M.; van Gunsteren, W. F.; Hermans, J. Interaction Models for Water in Relation
to Protein Hydration; D. Reidel Publishing: Dordrecht, the Netherlands, 1981.
29. Miyamoto, S.; Kollman, P. A. J. Comput. Chem. 1992, 13, 952-962.
30. Hess, B.; Bekker, H.; Berendsen, H.J.C.; Fraaije, J. G. E. M. J. Comput. Chem. 1997, 18, 1463-1472. 31. Darden, T. A.; York, D.; Pedersen, L. J. Chem. Phys. 1993, 98, 10089-10092.
32. Hockney, R. W.; Goel, S. P.; Eastwood, J. W. J. Comput. Phys. 1974, 14, 148-158. 33. Krieger, E.; Vriend, G. Bioinformatics 2002, 18, 315-318.
34. Krieger, E.; Darden, T.; Nabuurs, S. B.; Finkelstein, A.; Vriend, G. Proteins 2004, 57, 678-683. 35. Schüttelkopf, A. W.; van Aalten, D. M. F. Acta Crystallogr. 2004, D60, 1355-1363.
36. Krieger, E.; Koraimann, G.; Vriend, G. Proteins 2002, 47, 393-402.
37. Dulebo, A.; Ettrich, R.; Lucas, R.; Kaftan, D. Curr. Pharm. Design 2012, 18, 4236-4243.
38. Ozalp, L.; Sağ Erdem, S.; Yüce-Dursun, B.; Mutlu, Ö.; Özbil, M. Comput. Biol. Chem. 2018, 77, 87-96.
39. Srinivasan, J.; Cheatham, T. E.; Cieplak, P.; Kollman, P. A.; Case, D. A. J. Am. Chem. Soc. 1998, 120, 9401-9409. 40. Swanson, J. M. J.; Henchman, R. H.; McCammon, J. A. Biophys. J. 2004, 86, 67-74.
41. Donnini, S.; Tegeler, F.; Groenhof, G.; Grubmüller, H. J. Chem. Theory Comput. 2011, 7, 1962-1978. 42. Kirkwood, J. G. J. Chem. Phys. 1935, 3, 300-313.
43. Malinska, M.; Dauter, M.; Kowiel, M.; Jaskolski, M.; Dauter, Z. Acta Crystallogr. D 2015, 71, 1444-1454. 44. Arno, B.; Kurt, W. Biopolymers 1979, 18, 285-297.
45. Tanokura, M. Biochim. Biophys. Acta 1983, 742, 576-585.
46. Mongan, J.; Case, D. A.; McCammon, J. A. J. Comput. Chem. 2004, 25, 2038-2048. 47. Goh, G. B.; Hulbert, B. S.; Zhou, H.; Brooks, C. L. Proteins 2014, 82, 1319-1331.
48. Walsh, M. A.; Schneider, T. R.; Sieker, L. C.; Dauter, Z.; Lamzin, V. S.; Wilson, K. S. Acta Crystallogr. D 1998,
54, 522-546.
49. Trott, O.; Olson, A. J. J. Comput. Chem. 2010, 31, 455-461.