3
Application of Periodogram-Based Cointegration Test for the Analysis of the Services and Goods Sector Inflations
Yilmaz Akdi Koray Kalafatcilar Kivilcim Metin-Ozcan
Ankara University The Central Bank of Turkey Bilkent University ABSTRACT
The differing dynamics of the inflations of the services and goods sectors has been of major concern in Turkey. The persistence of the services sector inflation during disinflation periods hampered the efforts of the Central Bank of Turkey of hitting inflation targets in a country with long-lasting high inflation experience. In search of a possible long-run relationship between the services and goods sectors’ inflations, this paper employs a method based on periodograms of the series in addition to time series tools. A periodogram-based test has pros over conventional tests; this test is model-free, seasonally robust and mean invariant. Empirical findings obtained from the methods employed in this study, Engle-Granger’s and Johansen’s conventional long-run time series tools as well as periodogram based test, suggest that services and goods sector inflations in Turkey are not cointegrated.
Key words: Cointegration, Periodogram, Time-Series Analysis, Inflation, Services Sector
JEL Classifications: E31, E58, C13
1. INTRODUCTION
Over the last decade, many developing countries have adopted inflation-targeting regimes. Inflation, however, is not under perfect control of the central banks; impediments in transmission mechanisms and current and future shocks to the economy, for example, may hinder the central bank from hitting its targets. In practice, inflation-targeting central banks use inflation forecasts as intermediate targets, and by doing so they take into account all the available information that directly or indirectly affects inflation (Svensson, 1999). Agents in the economy form their expectations, which shape their pricing behaviors and their consumption and investment preferences, by considering inflation targets of the central bank (King, 2000). A central bank constantly missing its targets may find itself with limited or marginal credibility, which leads inflation expectations away from the target level, further weakening the odds of hitting the target. As a consequence of these developments, it is obvious that forecasting inflation accurately is vital for an inflation-targeting central bank. A central bank, employing either large macro-economic models or parsimonious ones, may prefer modeling only headline inflation if it believes that all the sub-items respond to monetary policy actions or shocks in accordance with each other. Yet, if inharmonious movements exist between groups such as tradable and non-tradable or between
Yilmaz Akdi, Department of Statistics, Faculty of Science, Ankara University, 06100, Tandogan-Ankara, Turkey.
Koray Kalafatcilar, Monetary Policy and Research Department, The Central Bank of Turkey, 06100, Ulus-Ankara, Turkey.
Kivilcim Metin-Ozcan, corresponding author, Department of Economics, Bilkent University, 06800, Bilkent-Ankara, .turkey, (email: [email protected]), Tel. +90-312-290-2006, Fax: +90-312-266-5140.
4
sectors such as goods and services sectors, the central bank may have to focus on these sub-items and then attain a forecast for headline inflation.
Inflation of the services sector, especially in the developed world, has constantly been exceeding that of the goods sector. The gap between the inflation rates of the two sectors is 1.6 percent in the USA, 0.9 percent in Canada and 0.7 percent in the Eurozone for the 1990-2007 period in annual average terms1. The large gap between inflation rates of the two sub-sectors of the consumer price index (CPI) basket, in other words, the deterioration in relative prices, underscores the fact that sub-sectors are susceptible to sector-specific factors and they display unlike pricing behaviors.
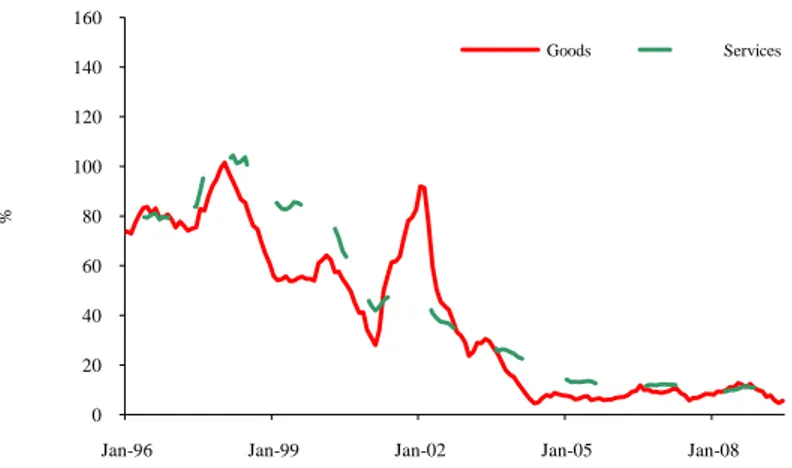
As the inflation-gap has become apparent, monetary policy makers and researchers have been attracted by the issue and have conducted empirical work in order to explain the dynamics. Using the US data, Peach et al. (2004) employed the Johansen cointegration method (Johansen, 1988) and Esteve et al. (2006) employed the threshold cointegration method proposed by Balke and Fomby (1997) to analyze the long-term relationship between the two series. Both studies have revealed a long-term relationship between the series, and estimated that services inflation would decline and goods inflation would increase to restore the equilibrium value. To our knowledge, no such study has been conducted for a developing country. Structural differences between the developing and the developed world as well as country-specific factors encouraged us to investigate the subject for the Turkish case. In fact, while the gap between the two sectors’ inflation is observed mostly in industrialized countries, it has been a major concern in Turkey as well. Services inflation in Turkey has almost always hovered above goods inflation, with the only exceptions the aftermath of the 2001 crisis, when the goods sector inflation surged with the devaluation of the Turkish lira and a short period in 2008 when commodity prices skyrocketed. Across the analysis period (1996-mid-2009), average annual inflation was 39.4 percent for the goods sector and 44.1 percent for the services sector. The foremost finding obtained from a quick analysis of the data is that the gap between the inflation rates of the sectors becomes more pronounced in disinflation periods. For instance, in June 1999, the difference between the inflation rates of the two sectors rose to 31.7 percent, while the annual CPI inflation was 64.3 percent (Figure 1.1).
Figure 1.1 Annual Inflation Rates of the Goods and Services Sectors
Source: Turkish Statistical Institute, Central Bank of Turkey.
1
Data from Bloomberg.
0 20 40 60 80 100 120 140 160
Jan-96 Jan-99 Jan-02 Jan-05 Jan-08
%
5
The 2001 financial crisis in Turkey brought about the collapse of the stability program based on the crawling-peg regime implemented by the International Monetary Fund (IMF), the end of the disinflation process and the re-acceleration of inflation. Following the re-establishment of stability, Turkey joined the inflation-targeting countries and resumed her struggle against inflation. As a country with a long history of high inflation, Turkey had little room then and had to hit inflation targets she had set in order to gain credibility and anchor the expectations of the agents. As an inflation-targeting country, setting targets during the disinflation period and appropriate policy responses to the shocks necessitated a good understanding of the dynamics of inflation as well as tools to forecast it meticulously. By early 2002, as the effects of the crisis disappeared, headline inflation started to fall in Turkey. However, the persistence of the services sector inflation impeded the disinflation process and led the central bank to take a more conservative approach by keeping the interest rates higher, which brought about severe outcomes in other aspects of the economy.
Motivated by the different dynamics of the sectoral inflations in Turkey during the disinflation period, this research aimed to analyze the long-run relationships between the goods and services sector inflations using periodogram-based cointegration test developed by Akdi (1995)2. In Akdi et al. (2006), authors investigate a long-run relationship between the wholesale and consumer prices indices of Turkey. On the other hand, for convenience, we employ the Engle-Granger two-step procedure and the multivariate cointegration technique in the study as well. In a similar fashion, we investigated whether series have unit root by frequency-domain based unit root test developed by Akdi and Dickey (1998) as well as a conventional time-series tool, namely Augmented Dickey-Fuller test. All the findings suggest similar results. Both unit root tests indicate that series are not cointegrated and cointegration tests fail to reveal long-run relationship between the series.
What motivated us to base our study on findings from frequency-domain based tests are the advantages of these tools over standard time-series tools. Firstly, this test is seasonally robust and mean invariant. The mean-invariance property means that periodograms eliminate any deterministic trend in the series. Moreover, since periodograms are obtained by trigonometric transformation, any probable periodicity in the series, such as cycles, is also taken into account. The second advantage is that these tests are model free, do not necessitate lag selection, and the only parameter to be estimated is the variance of the error term. Finally, in a periodogram-based unit root test the power can be calculated analytically, yet in conventional time series analysis the power of the tests is not exact.
The organization of this paper is as follows: Section II describes the periodogram-based unit root and cointegration tests. While the third section introduces the data, the fourth section presents the unit root and co-integration tests results and evaluates them. Finally, the last section concludes.
2. PERIODOGRAM-BASED UNIT ROOT AND COINTEGRATION TESTS
Periodogram-based unit root and cointegration tests, although not widely employed, have advantages over standard time series tools, as mentioned above. In this section, these tests are introduced.
2
6 2.1. Unit Root Test
The periodogram-based unit root test employed here was introduced by Akdi and Dickey (1998). The authors also developed the distribution of the test statistic and critical values. The periodogram ordinate of a given time series such as
Y1,Y2,...,Yn
is) ( 2 ) ( k k2 k2 n a b n w I (2.1)
here a ,k bk are the Fourier frequencies and they are defined as
n t k t k Y Y w t n a 1 ) cos( ) ( 2 and
n t k t k Y Y w t n b 1 ) sin( ) ( 2 (2.2)It is important to note in the analysis that when
n k wk2 , the equality
n t n t k kt w t w 1 1 0 ) sin( ) cos(arises and this leads Fourier coefficients, the periodogram ordinate and hence the periodogram-based unit root test statistic to be invariant to the mean. The test statistic to check the unit root in the series is
) ( ˆ ) cos( 1 ( 2 ) (wk 2 wk In wk T (2.3)
where ˆ2 is the variance of the error term.
This test statistic is seasonally robust and model free from the selection of the lag lengths. This test statistic is distributed as a mixture of chi-squares exactly for AR(1) series, while for higher-order series distribution it is obtained only asymptotically:
2 2 2 1 3 ) (w Z Z
T k d , where Z1 and Z2 are standard normal random variables. Another advantage of this unit root test compared to standard time series tools is that power can be calculated analytically, while the power is never exact in conventional tests.
2.1. Cointegration Test
Two given I(1) time series, say Xt , Yt, are called to be cointegrated, i.e. share a common trend,
if their linear combination yields a I(0) series. Algebraically, t
t
t a U a S
Y 11 12 and Xt a21Ut a22St (2.4)
where Ut and St represent, respectively, the unit root and stationary component of the series.
t t t S a a a a Y a a X ( ) ( ) 11 12 21 22 11 21 (2.5)
The linear combination of the two series yields a stationary series with the cointegrating vector a((a21 a11),1).
The periodogram-based cointegration test developed by Akdi (1995), depends on the regression of the real part of the cross-periodogram ordinates of the two series (xt , yt,).
, k k
k x
7
The estimate of β, ˆ, obtained here is a consistent estimator of (a21 a11). In order to decide
whether Xt , Yt are cointegrated or not, we firstly derive
t t
t Y X
Z ˆ (2.7)
by using the estimated coefficient from the regression of cross-periodogram ordinates (2.6), regress Zt on Zt1 and apply usual t-statistics.
3. DATA
Data used in the analysis are the sub-items of the Consumer Prices Index (CPI) issued by the Turkish Statistical Institute (TURKSTAT). Inflation series, however, are not officially made public for goods and services sectors separately in Turkey. To overcome this issue, the Central Bank of the Republic of Turkey (CBT) Research and Monetary Policy Department formed sectoral inflation series by aggregating five-digit items in the basket. After the introduction of the 2003=100-based series, this new inflation series linked to the 1994=100-based series. Since the homeowner’s equivalent rent item was excluded from the new CPI basket, we also dismissed that item from the old basket in order to attain a consistent series. Yet the combined series could not be run further to cover the 1987=100-based series due to considerable changes both in the items of the index and the weights within. The empirical analysis in this study covers the 1996 – mid-2009 period and has been made on a monthly basis with annual inflation figures3 in log terms.
4. EMPIRICAL WORK 4.1. Unit Root Test Results
The Dickey-Fuller unit root test and its extensions are among the standard tools used to decide whether a sequence exhibits unit root property. In its simplest form, without trend and intercept components, the t-value of ˆ1, which is obtained by the estimation of equation (4.8), is compared to critical values that are derived from simulations by Dickey and Fuller (1979).
t t
t X
X
1 1 (4.8)
According to the Augmented Dickey-Fuller (ADF) test, we can conclude that both inflation series have unit root property at a conventional 5 percent level with the specification including time and intercept (Table 4.1).
intercept with trend 13 lags Test statistics Critical value (0.05)
Goods -1.77
-3.44
Services -2.98
Table 4.1 Augmented Dickey-Fuller Test
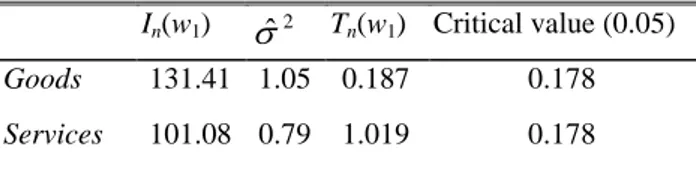
The unit root test, based on the frequency domain, suggests parallel results to the ADF test. Its application to the series in question and estimates of periodogram ordinate, variance and test statistic are presented in Table 4.2. The periodogram-based test developed by (Akdi and
3
8
Dickey, 1998) suggests that both goods and services sector inflation series have unit root at a 5 percent level.
In(w1) ˆ2 Tn(w1) Critical value (0.05)
Goods 131.41 1.05 0.187 0.178
Services 101.08 0.79 1.019 0.178
Table 4.2 Periodogram-based Unit Root Test
4.1. Cointegration
Before reporting the results of the periodogram-based cointegration test, we present the findings from the well-known and frequently used time series techniques, namely the Engle-Granger two-step procedure and the multivariate Johansen technique.
The Engle-Granger method is based on the unit root analysis of residuals obtained from the ordinary least squares (OLS) regression of two I(1) variables. In order to apply this methodology, the services sector inflation is first regressed on the goods sector inflation. The estimated coefficient is approximately 0.82. To test the stationarity of the residuals, the Augmented Dickey-Fuller test is applied with the specification including neither time nor intercept. The ADF test statistic, -1.82, cannot surpass the 5 percent critical value, -3.17, suggesting that the residual sequence is not stationary and hence the services and goods sectors’ inflations in Turkey are not cointegrated.
The Johansen method, basically, is the generalization of the Dickey-Fuller test to a multivariate case by estimating an unrestricted VAR model. Before we run an unrestricted VAR model, as a first step we have to decide on the appropriate lag length by running unrestricted VAR (Table 4.3).
Lag 0 1 2 3 4 5 6 7 8 9 10 11 12 13
AIC 3.29 -5.20 -5.46 -5.46 -5.42 -5.42 -5.39 -5.38 -5.34 -5.36 -5.35 -5.32 -5.29 -5.48*
SC 3.33 -5.08 -5.26* -5.18 -5.06 -4.98 -4.86 -4.77 -4.65 -4.59 -4.50 -4.39 -4.28 -4.39
HQ 3.31 -5.15 -5.38* -5.34 -5.28 -5.24 -5.17 -5.13 -5.06 -5.05 -5.00 -4.94 -4.88 -5.04
Table 4.3 VAR Lag Order Selection Criteria
intercept in CE intercept in CE intercept and trend in CE
no intercept, trend in VAR intercept in VAR intercept in VAR
statistic CV (0.05) probability statistic CV (0.05) probability statistic CV (0.05) probability
trace test
None 17.36 20.26 0.12 12.55 15.89 0.16 19.18 25.87 0.27
At most 1 4.81 9.16 0.30 4.81 9.16 0.30 8.63 12.52 0.20
max eigenvalue test
None 12.55 15.89 0.16 9.49 14.26 0.25 10.54 19.39 0.56
At most 1 4.81 9.16 0.30 0.27 3.84 0.60 8.63 12.52 0.20
Table 4.4 Johansen Cointegration Test Results
Since we have limited observations, we stick to the Schwarz Information (SC) and Hannan-Quinn (HQ) criteria and neglect the Akaike Information Criterion (AIC). Both SC and HQ suggest two lags as the optimum lag structure. Then, we run the VAR model with two lags and test for cointegration between variables by the Johansen method. For convenience, all three model specifications that are widely used in time series analysis are reported in Table 4.4. Both trace and maximum eigenvalue tests for all three specifications, suggest that there is
9
no cointegration between goods and services sectors inflation series. Test statistics obtained are far below the critical values at 5 percent. Although not reported here, the same conclusions stand at the 10 percent level as well (see Table 4.4).
After reporting findings of conventional time-series tools, we can now perform periodogram-based cointegration test. As introduced at the introduction section, this test has advantages over well-known time series tools. To carry out the periodogram-based cointegration test, we first estimate the equation given in (2.6) and obtain ˆ coefficient. Then, since the test depends on whether the residuals derived in equation (2.7) are stationary or not, we apply the usual t-tests. The estimation of (2.6) yields that according to the periodogram-based test, ˆ is 0.87. Because the estimated t-value -1.87 is far above the critical values, which are –3.44 and –3.13 for 5 percent and 10 percent respectively, we clearly fail to reject the null hypothesis of no co-integration at a 5 percent confidence level.
ˆ ˆ Critical value (% 5)
Critical Value (%10)
Decision
0.872 -1.867 -3.436 -3.129 Fails to reject the null hypothesis of no cointegration
Table 4.5 Periodogram-Based Cointegration Test
In our study, all the methods employed reveal no cointegrating relationship between the variables. This might be explained by factors discussed in the literature as the determinants of the gap between goods and services sector prices Clark (2004) and Gagnon et al. (2004): i.) higher productivity gains in the goods sector, ii.) lower degree of transmission from exchange rate to the services sector than the goods sector, iii.) less exposure of the services sector to foreign competition and iv.) the higher income elasticity of demand of the services sector. In fact, after including these factors in addition to relative price of goods and services sectors in their model, Metin-Ozcan and Kalafatcilar (2009) found a cointegration relationship for the Turkish data in their recent work.
5. CONCLUSION
The gap between the courses of the goods and services sectors’ inflations in developed countries has become apparent in Turkey as well. This study aimed to analyze the long-run relationship between inflations of the goods and services sectors by use of the Engle-Granger two-step procedure, the Johansen multivariate cointegration technique and finally Akdi’s periodogram-based cointegration test to extract some information for an inflation-targeting central bank. According to the empirical results, all the methods carried out in the study suggest that the goods and services sectors’ inflations in Turkey are not cointegrated. These findings lead us to conclude that no long-term relationship exists between the sub-sectors of the CPI basket. The sectoral inflations are influenced by sector-specific factors and shocks are permanent. Hence, it would be wise for an inflation-targeting central bank to take this finding into consideration, pay attention to economic factors mentioned above and focus on sub-indices in the CPI basket when forecasting. Although we did not have any intention to forecast in this paper, we believe our findings provide some insight for those who forecast inflation for Turkey and for other developing countries with which Turkey is assessed together.
10 REFERENCES
Akdi, Y. (1995). Periodogram analysis for unit roots. Ph.D. diss., NCSU.
Akdi, Y. and D.A. Dickey (1998). Periodograms of unit root time series: Distributions and tests, Communications in Statistics : Theory and Methods, 27(1), 69-87.
Akdi, Y., H. Berument and S.Y. Cilasun (2006). The relationship between different price indices: Evidence from Turkey. Physica A, Statistical Mechanics and its Applications, 360, 483-492.
Balke, N.S. and T.B. Fomby (1997). Threshold cointegration. International Economic
Review, 38, 627-45.
Berument, H. , Y. Akdi and C. Atakan (2005). An empirical analysis of Istanbul Stock Exchange sub-indexes. Studies in Nonlinear Dynamics and Econometrics, 9(3), 1-12.
Clark T. (2004). An evaluation of the decline in goods inflation. Federal Reserve Bank of
Kansas City Economic Review, 2nd Quarter, 19-51. http://www.kc.frb.org/PUBLICAT
/ECONREV/PDF/2Q04Clar.pdf (accessed June 16, 2010).
Dickey, D. and W.A. Fuller (1979). Distribution of the estimates for autoregressive time series with a unit root. Journal of the American Statistical Association, 74, 427-31. Esteve, V., S. Gil-Pareja, J.A. Martinez-Serrano and R. Llorca-Vivero (2006). Threshold
cointegration and nonlinear adjustment between goods and services inflation in the United States. Economic Modelling, 23, 1033-39
Gagnon, E., P. Sabourin and S. Lavoie (2004). The comparative growth of goods and services prices. Bank of Canada Review, 2003-2004 Winter, 3-10. http://www.bankofcanada.ca/
en/review/winter03-04/gagnone1.pdf (accessed June 16, 2010).
Johansen, S. (1988). Statistical analysis of cointegration vectors. Journal of Economic
Dynamics and Control, 12, 231-254.
King, R.G. (2000). The new IS-LM model: Language, logic, and limits. Federal Reserve
Bank of Richmond Economic Quarterly, 86(3), 45-103.
Metin-Ozcan, K. and K. Kalafatcilar (2009). Factors influencing relative price of goods and services sectors in Turkey: An econometric analysis. Bilkent University, Department of
Economics, Discussion Paper No.09-01. http://www.bilkent.edu.tr/~economics/papers /09-01 DP_KivilcimMetin-Ozcan.doc
Peach, R.W., R. Rich and A. Antoniades (2004). The historical and recent behavior of goods and services inflation. FRBNY Economic Policy Review. December, 19-31.
http://www.newyorkfed.org/research/epr/04v10n3/0412peac.html (accessed June 16,
2010).
Svensson, L.E.O. (1999). Inflation targeting as a monetary policy rule. Journal of Monetary