© 2002 WILEY-VCH Verlag GmbH & Co. KGaA, Weinheim 0232-1300/02/1212-1303 $ 17.50+.50/0
A.AYDINLI*1,N.M.GASANLY2,A.UKA2,H.EFEOGLU3 1 Physics Department, Bilkent University, Ankara, Turkey
2 Physics Department, Middle East Technical University, Ankara, Turkey 3 Physics Department, Atatürk University, Erzurum, Turkey
Anharmonicity in GaTe layered crystals
The temperature dependencies (10-300 K) of seven Raman-active mode frequencies in layered semiconductor gallium telluride have been measured in the frequency range from 25 to 300 cm-1. Softening and broadening of the optical phonon lines are observed with increasing temperature. Comparison between the experimental data and theories of the shift of the phonon lines during heating of the crystal showed that the experimental dependencies can be explained by contributions from thermal expansion and lattice anharmonicity. Lattice anharmonicity is determined to be due to three-phonon processes.
Keywords: chalcogenides, semiconductors, Raman spectroscopy, optical properties (Received August 1, 2002; Accepted September 18, 2002)
1. Introduction
GaTe is a AIIIBVI-type semiconducting compound like GaSe, GaS, and InSe, which crystallize in a layered structure. Mainly, due to the difficulties in growing good quality large size crystals it is one of the less investigated materials. In the case of GaTe, atomic planes are in the Te-Ga-Ga-Te sequence, grouped in layers of four atomic planes where portions of each layer are joined together by regions in which the Ga-Ga bonds are approximately at right angles to the usual Ga-Ga bonds (EVANS). Anisotropic bonding forces characterize
these layered compounds. The anisotropy arises from the fact that the bonding within the layers is considerably stronger than those perpendicular to them. In GaTe, van der Waals forces contribute predominantly to the interlayer interaction, while the bonding forces within the layers are primarily ionic-covalent.
The lattice vibrational spectra of GaTe crystal have been studied using room temperature Raman scattering (CERDEIRA et al., IRWIN et al., ABDULLAEV et al.) and infrared reflectivity
(GASANLY et al. 1980). Room temperature Raman scattering spectra of GaTe crystals are
measured under pressure up to 1.125 GPa and Gruneisen parameters for 14 Raman-active modes are obtained (ALLAKHVERDIEV et al.).
The influence of anharmonic interactions on the lattice vibrations can be experimentally studied by measuring changes of phonon frequency and linewidth with temperature and pressure. The study of the temperature dependence of the frequency shift and linewidth of the first-order Raman scattering in the semiconductors has long been of interest with a large number of articles in the literature (MENENDEZ, CARDONA; VERMA et al., ANAND et al., GONZALEZ et al.). The fact that Raman frequency shift can be successfully modeled by
phonons in GaTe layered crystals in the temperature range from 10 to 300 K using Raman scattering as the probe. Softening and broadening of the optical phonon lines at the Brillouin zone center has been revealed with increase of temperature as is observed in some other semiconductors. The analysis of the observed frequency shifts suggest that the purely anharmonic contribution to the phonon frequency shift is due to interaction with phonons of other branches.
2. Experimental
Gallium telluride single crystals were grown using stoichiometric proportions of high-purity 6N Ga and 5N Te from Alfa Aesar. A directional freezing method with constant temperature gradient at 6.6 K/cm in a two zone furnace was used for crystal growth. Starting materials were sealed in a carbon coated quartz tube with a tip at the bottom and evacuated down to a pressure of 4x10⁻⁴ Pa. Synthesization and the growth procedure were carried out in the same tube without breaking vacuum to minimize contamination. The analysis of X-ray diffraction data show that they crystallize in monoclinic structure with the space group 3
2h
C (IRWIN et
al., ABDULLAEV et al.). As-grown GaTe is a direct band gap semiconductor with an energy
of 1.65 eV at room temperature.
Unpolarized Raman scattering measurements in GaTe layered crystal were performed in the backscattering geometry in the frequency range 25 to 300 cm-1. 514.5 nm line of an Ar+ laser was used as the exciting light source. The scattered light was analyzed using a double grating spectrometer with a focal length of 1 m and detected by a cooled GaAs photomultiplier supplied with necessary photon counting electronics. The Raman line positions were determined within an accuracy of ± 0.1 cm-1. A closed-cycle helium cryostat was used to cool the crystals from room temperature down to 10 K. The temperature was controlled within an accuracy of ± 0.5 K.
Due to large absorption coefficient of GaTe at the wavelength of interest only a small volume at the surface of the crystal was excited leading to weak Raman signals. Spectrometer slits and integration times were chosen so as to achieve a signal-to-noise ratio of at least a 100, at the best possible resolution.
3. Results and discussion
Unit cell of GaTe has one layer with six molecular units (IRWIN et al., ABDULLAEV et al.).
For GaTe, the long-wavelength optical phonons are described by the irreducible representations of the C2h point group as
Γ≡12 Ag + 6 Au + 6 Bg + 12 Bu
among which (Au + 2 Bu) are acoustic, (10 Bu + 5 Au) are IR active and (12 Ag + 6 Bg) are Raman active modes. 14 of the 18 expected Raman-active modes have so far been observed (IRWIN et al., ABDULLAEV et al., ALLAKHVERDIEV et al.).
Fig. 1: Raman spectra of GaTe crystal at T = 10 K. The peak that represents the most frequency shift is shown at 10 and 220 K at the inset.
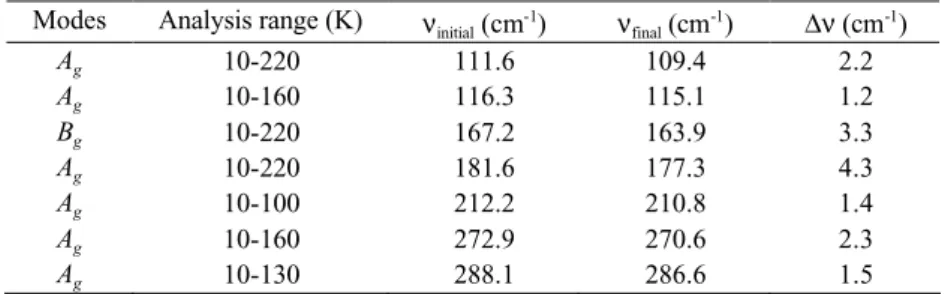
Table 1: Analysis range and the frequency shifts for seven modes of GaTe crystal.
Modes Analysis range (K) νinitial (cm-1) ν
final (cm-1) ∆ν (cm-1) Ag 10-220 111.6 109.4 2.2 Ag 10-160 116.3 115.1 1.2 Bg 10-220 167.2 163.9 3.3 Ag 10-220 181.6 177.3 4.3 Ag 10-100 212.2 210.8 1.4 Ag 10-160 272.9 270.6 2.3 Ag 10-130 288.1 286.6 1.5
Figure 1 shows a typical Raman spectrum of GaTe at 10 K. Twelve of the eighteen modes are immediately observed. In addition to eleven relatively strong peaks, a shoulder on the high frequency side of the mode at 52.9 cm-1 is also clearly observable at 57.5 cm-1. However, the peaks expected at 41 and 153 cm-1 are extremely weak. This is most probably because of the short wavelength of the exciting light and the associated short absorption depth. Smaller Raman cross section of these modes compared those that are observed is also a possibility. Previous observations of fourteen modes out of the eighteen expected were all obtained at an excitation wavelength of 1060 nm where the sampling depth is much longer (band gap of GaTe is 1.65 eV). The observed peaks in our work are at 52.9, 57.5, 67.4, 76.7, 111.6, 116.3, 167.2, 172.0, 181.6, 212.2 , 272.9, and 288.1 cm-1 at 10 K. The shift and
The present assignment of the observed modes is in excellent agreement with that of Ref. (IRWIN et al., ABDULLAEV et al., ALLAKHVERDIEV et al.). A summary of the analysis range
and the total frequency shift in this range is given in Table 1. The smallest frequency shift is 1.2 cm-1 which occurs for the A
g peak at 116.3 cm-1 and the largest frequency shift is 4.3 cm-1 for the Ag peak at 181.6 cm-1.
Temperature dependence of Raman modes has contributions from lattice expansion and anharmonicity in vibrational potential energy. Anharmonicity leads to decay of the phonons to two, three or more lower energy phonons represented by cubic, quartic or higher order terms. In consideration of a specific decay process, initially all possible interactions with different decay processes should be included. Frequency shift of the normal modes of a semiconductor with temperature can described by the expression (MENENDEZ, CARDONA;
ANAND et al., DEBERNARDI) :
ν(T) = ν0 + ∆1(T) + ∆2(T), (1)
where ν0 + ∆2(0) is the Raman shift as T approaches 0 K, ∆1(T) represents the volume dependence of the frequency due to the thermal expansion of the crystals and ∆2(T) specifies the contribution of anharmonic coupling to phonons of other branches.
∆1(T) can be written as:
∆1(T) = ν0 [exp (-3γ ' ' 0 ( ) ) T T dT α
∫
-1] , (2)where γ is Gruneisen parameter and α(T) is the coefficient of linear thermal expansion. The purely anharmonic contribution to the frequency shift can be modeled as:
∆2(T) = A 1 2 1 1 1 1 1 x x e e + + − − (3)
which represents the coupling of the optical phonon to two different phonons (three-phonon processes). Here x1 = hcν1 / kBT and x2 = hcν2 / kBT . The experiments in the present study
were carried out at temperatures below the Debye temperature of GaTe crystal (θ D = 265 K) (MAMEDOV et al.), thus the three-phonon process is dominant and the higher order processes
can be neglected.
Using the experimental values of γ (ALLAKHVERDIEV et al.) and α(T) (KERIMOV et al.),
the frequency shifts for the most intensive seven modes were fitted by means of Eqs. (1)-(3) with A, ν0 , ν1 , and ν2 as adjustable parameters, with keeping the sum of ν1 +ν2 = ν0 constant (energy conservation). Other peaks became too weak for analysis as the temperature increased. The parameters used for the temperature dependencies of Raman frequencies of GaTe and the resulting values A , ν0 , ν1 , and ν2 are given in Table 2.
Table 2: Parameters for fitting temperature dependencies of Raman frequencies of GaTe crystal. Modes γ ν0 (cm-1) ν 1 (cm-1) ν2 (cm-1) A (cm -1) Ag 2.6 111.6 84.2 27.4 -0.082 Ag 2.3 116.4 76.5 39.9 -0.10 Bg 2.1 167.3 109.5 57.8 -0.348 Ag 2.6 181.9 120.0 61.9 -0.517 Ag 1.0 212.8 178.7 34.1 -0.629 Ag 1.1 273.9 180.3 93.6 -1.195 Ag 1.3 289.0 192.0 97.0 -0.894
Fig. 2: Temperature dependence of the Ag mode frequency at 181.6 cm-1 (open circles) for GaTe is shown. The solid curve gives the theoretical fit using Eqs. (1)-(3).
It should be noted that the Grüneisen parameters of all analyzed modes are of the same order of magnitude, unlike those of GaSe (GAUTHIER et al.), where the Grüneisen parameter of the
interlayer mode E'(2) has a value of 22.1 while it is in the range 1.3-3.9 for the intralayer
modes. For all modes, the agreement between the theoretical and experimental dependencies was found to be good. An example of the frequency shift data as a function of temperature is given in Fig. 2 for the Ag peak at 181.6 cm-1 as well as the fit obtained using Eqs. (1)-(3).
From the Fig. 2 it is clear that a three-phonon decay process fits the data well. Using Eqs. (2) and (3), individual contributions of ∆1(T) and ∆2(T) were also calculated, examples of which are given in Fig.3 for two peaks at 181.6 and 272.9 cm-1. For both modes, the contributions to the experimentally measured frequency shift from ∆1(T) and ∆2(T) have the same sign. This is in contrast with some other layered semiconductors such as GaSe-GaS
(GASANLY et al. 2002) where some of the modes have thermal expansion and anharmonicity
contributions with different signs.
4. Conclusions
The analysis of the temperature dependence of the optical modes in GaTe crystal shows that the Raman frequency shift is well described by considering the thermal-expansion and
pure-determined. Unfortunately, the phonon dispersion curves and the two-phonon density of
states of GaTe are not available in the literature and which, therefore, do not allow us to confirm the frequencies of the decay phonons.
Fig. 3: Calculated contributions of [∆1(T)] (1) and [∆2(T)] (2) to the frequency shift as well as the experimental data (3) are shown for peaks at 181.6 cm-1(a) and 272.9 cm-1 (b).
References
ABDULLAEV, G. B., VODOPYANOV, L. K., ALLAKHVERDIEV, K. R., GOLUBEV, L. V., BABAEV, S. S., SALAEV, E. Y.: Solid State Commun. 31 (1979) 851.
ALLAKHVERDIEV, K. R., BABAEV, S. S., SALAEV, E. Y., TAGIEV, M. M., VINOGRADOV, E. A., GONCHAROV, A. F., MELNIK, N. N., SUBBOTIN, S. I., PANFILOV, V. V.: Solid State Commun. 35 (1980) 705.
ANAND, S., VERMA, P., JAIN, K.P., ABBI, S. C.: Physica B 226 (1996) 331. CERDEIRA, F., MENESES, E. A., GOUSKOV, A.: Phys. Rev. B 16 (1977) 1648. DEBERNARDI, A.: Solid State Commun. 113 (2000) 1.
EVANS, B. L.: Optical Properties of Layer Compounds, Ed. P. A. Lee, D. Reidel Publishing Company, Dordrecht-Holland (1976) p. 1.
GASANLY, N. M., DZHAVADOV, B. M., TAGIROV, V. I., VINOGRADOV, E. A.: Phys. Stat. Sol. (b) 100 (1980) K53.
GASANLY, N. M., AYDINLI, A., KOCABAS, C., OZKAN, H.: Phys. Scripta 65 (2002) 534. GAUTHIER, M., POLIAN, A., BESSON, J. M., CHEVY, A.: Phys . Rev. B 40 (1989) 3837. GONZALEZ, J., MOYA, E., CHERVIN, J. C.: Phys. Rev. B 54 (1996) 4707.
IRWIN, J. C., CLAYMAN, B. P., MEAD, D. G.: Phys. Rev. B 19 (1979) 2099.
KERIMOV, I. G., ALIEV, N/ G., KURBANOV, M. M.: Sov.Phys.Semicond. 7 (1973) 1575.
MAMEDOV, K. K., ALDZHANOV, M. A., KERIMOV, I. G., MEKHTIEV, M. I.: Sov. Phys. Solid State 20 (1978) 22.
MENENDEZ, J., CARDONA, M.: Phys. Rev. B 29 (1984) 2051. VERMA, P., ABBI, S. C., JAIN, K.P.: Phys. Rev. 51 (1995) 16660.
VINOGRADOV, E. A., GONCHAROV, A. F., MELNIK, N. N., SUBBOTIN, S. I., PANFILOV, V. V.: Solid State Commun. 35 (1980) 705.
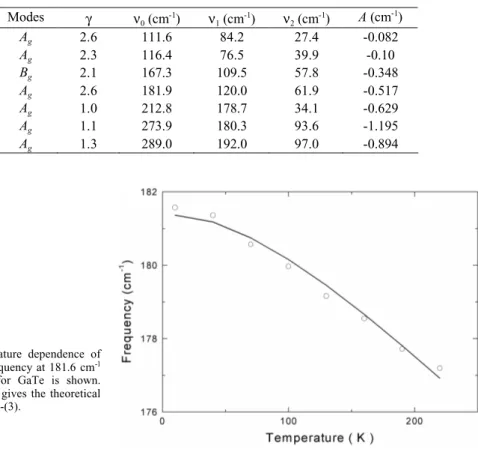
![Fig. 3: Calculated contributions of [∆ 1 (T)] (1) and [∆ 2 (T)] (2) to the frequency shift as well as the experimental data (3) are shown for peaks at 181.6 cm -1 (a) and 272.9 cm -1 (b)](https://thumb-eu.123doks.com/thumbv2/9libnet/5566362.108699/6.718.80.404.235.738/fig-calculated-contributions-frequency-shift-experimental-shown-peaks.webp)
