Turkish Journal of Fisheries and Aquatic Sciences 14: 403-411 (2014)
www.trjfas.org ISSN 1303-2712 DOI: 10.4194/1303-2712-v14_2_10
© Published by Central Fisheries Research Institute (CFRI) Trabzon, Turkey in cooperation with Japan International Cooperation Agency (JICA), Japan
Seasonal Changes of Ichthyoplankton Assemblages of Sinop Coasts in
Southern of the Black Sea, Turkey
Introduction
Black sea is the most important fishing area throughout Turkey that more than half of the fishery yield comes from (TUIK, 2012). The Black Sea Ecosystem has an economic value, especially in respect of Turkish fishery together with its necessity for protecting the natural system. Continual
monitoring the Black Sea oceanography and revealing the possible changes gain importance at this point. Appropriate management plans are necessary for sustain fish stocks. Reliable data on fish stocks are crucial to planning of stock management.
Spawning intensity, area and time is one of the most important data for managing the Black Sea fish stocks effectively (Yuksek and Ince, 2011). For this
Hasan Hüseyin Satılmış
1,*, Sinan Mavruk
2, Levent Bat
1, Dursun Avşar
2 1Sinop University, Fisheries Faculty, Department of Hydrobiology, Sinop, Turkey.
2
Cukurova University, Fisheries Faculty, 01330, Balcalı, Adana, Turkey.
* Corresponding Author: Tel.: +90.368 2876254; Fax: +90 368 2876255; E-mail: [email protected]
Received 18 February 2014 Accepted 15 April 2014
Abstract
The Black Sea is an important ecosystem in Turkish marine fisheries. The early stages of economical fishes of the Black Sea can be considered well known; however, there are significant data deficiencies on ichthyoplankton assemblages and their structures. Therefore, seasonal changes of structure and dynamics of ichthyoplankton assemblages of Sinop coasts (South-Central of the Black Sea, Turkey) were investigated in this study. For this purpose monthly vertical and horizontal standard plankton net tows had been conducted at six sampling stations from two different regions (Inner and Outer Harbours) between 2002 and 2005. Species richness, diversity, abundance and similarity structures were used as ecological indicators to investigate ichthyoplankton assemblages. Planktonic stages of 27 fish species were collected during the studying period. The maximum species richness expectancy was 34 species. Seasonal changes of richness were significant (P<0.05). The groupings of similarity matrices were also explained by seasonal effects for both embryonic and larval stages (P<0.05). In conclusion, the ichthyoplankton assemblage structures of the studying area were generally shaped by seasonal spawning patterns of adult populations.
Keywords: Early life stages, fish eggs, fish larvae, spawning.
Güney Karadeniz’deki Sinop Kıyılarında İhtiyoplankton Topluluklarının Mevsimsel Değişimleri
Özet
Türkiye’de deniz balıkçılığı açısından son derece yüksek öneme haiz olan Karadeniz ekosisteminde, özellikle ticari değere sahip balık türlerinin erken yaşam evreleri üzerine yapılmış birçok çalışma bulunmasına karşın, ihtiyoplankton toplulukları ve bunların yapısal özelliklerinin tümüyle açığa kavuşturulduğu söylenemez. Bu çalışmanın konusunu Sinop kıyısındaki ihtiyoplankton dağılımının yapısı ve mevsimsel değişimleridir. Bu amaçla 2002-2005 yılları arasında standart plankton ağı kullanılmak suretiyle, iç ve dış liman bölgelerindeki altı istasyondan aylık olarak yatay ve dikey plankton örneklemeleri gerçekleştirilmiştir. İhtiyoplankton topluluklarının yapısını analiz etmek için tür zenginliği, çeşitliliği, bolluğu ve toplulukların benzerliği ekolojik belirteçler olarak ele alınmıştır. Çalışma süresince 27 türe ait erken evrelerle karşılaşılmış, bölge için beklenen maksimum tür zenginliği 34 tür olarak bulunmuştur. Tür zenginliğinin mevsimsel değişimi istatistik açıdan önemli bulunmuştur (P<0,05). Ayrıca, hem embriyonik hem de larval aşamalar için benzerlik matrislerinde gözlenen gruplaşmalar önemli ölçüde mevsimlerle açıklanmıştır (P<0,05). Sonuç olarak çalışma alanındaki ihtiyoplankton topluluklarının yapısal özelliklerinin büyük ölçüde ergin popülasyonların üreme davranışlarıyla açıklanabileceği neticesine varılmıştır.
404
purpose, detailed data about the area and ecosystem should be collected for obtaining profit from ichthyoplankton studies (Yuksek, 1993). For this reason, the studies about dynamic features such as species composition of ichthyoplankton assemblages, their diversity, the changes of their assemblage structure gain big importance. With the monitoring studies on ichthyoplankton, the effects of both fishing and ecological changes on the reproductive activities of fishes and their early life stages can be researched with more realistic approaches. Besides, the studies on adult stages cost relatively higher than early stage approach (Yuksek, 1993).
The Black Sea form one of the most densely studied areas among Turkish seas in respect of ichthyoplankton studies. Ichthyoplankton studies in the Black Sea coasts of Turkey were started by Arim (1957). Since then abundance and distribution of larvae (Mater and Cihangir, 1990; Mater and Cihangir, 1997; Niermann et al., 1994; Basar and
Okumus, 1997; Ak, 2009; Sahin and
Hacimurtezaoglu, 2013) and their relations to the environmental conditions (Kideys et al., 1999) were researched.
In Sinop coasts which constitutes the studying area small pelagic fishes; sprat (Sprattus sprattus), anchovy (Engraulis encrasicolus) and mackerel (Trachurus mediterraneus) were investigated between November 2002 and November 2003 and gave data on their abundance structure (Satilmis, 2005). Satilmis et al. (2006) identified 8 species from 8 families in Sinop coast of the Black Sea, Turkey. Satilmis et al. (2009) reported instances belonging to 14 families in their study in Sinop coastal zone ichthyoplankton.
Although there are considerable data on
Ichthyoplankton of the Black Sea, the dynamics of ichthyoplankton assemblages are still unknown especially those of Sinop coasts. Therefore, the aim of this study is to evaluate the ichthyoplankton assemblages in an ecological perspective. For this purpose, seasonal changes of the species composition, richness and diversity of ichthyoplankton assemblages were investigated by using horizontal and vertical ichthyoplankton samplings.
Material
s
and Methods
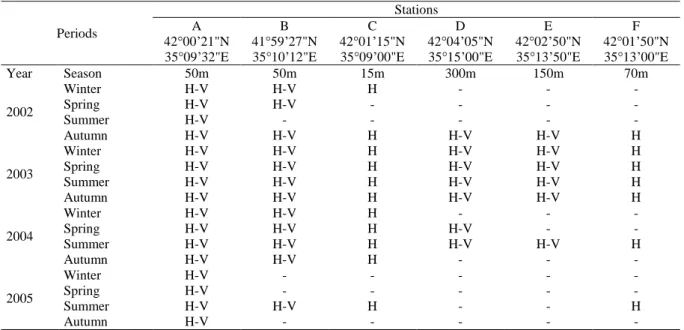
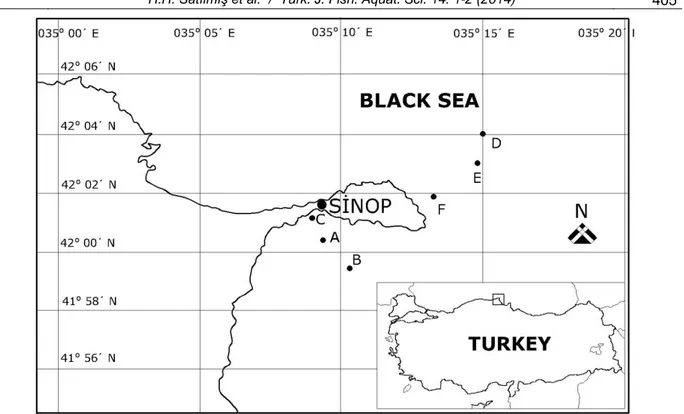
Ichthyoplankton was collected from 2 sites (Inner and Outer Harbours) and 6 different locations (Table 1) towing a standard plankton net vertically and horizontally (Figure 1). The Inner Harbour region is closed to the North winds which are dominant in the Black Sea and has specific flow regimes. Outer Harbour is in four miles northeast of Sinop Adabasi and in an area that is exposed to all conditions of oceanic water. Both regions were divided into three stations in order to provide a better representation. The stations are determined by dividing the line between the marginal station and coast by one mile intervals. During 2002-2005, surveys have been carried out in Sinop coastal waters by R/V Arastirma-1 to study the species composition and abundance of ichthyoplankton. The ichthyoplankton samples have been collected by horizontally and vertically towing with a standard-plankton net (frame diameter 50 cm, length 250 cm, mesh size 0.21 mm for vertical tows and 0.50mm for horizontal tows). Horizontal tows have been conducted at the sea surface with a towing speed 2.5 mile/h for each sampling station. Horizontal tows have lasted for 10 minute. Vertical hauls have been performed from deep to sea surface except for
Table 1. Sampling design of study and depth and coordinates of stations
Periods
Stations
A B C D E F
42°00’21"N 41°59’27"N 42°01’15"N 42°04’05"N 42°02’50"N 42°01’50"N 35°09’32"E 35°10’12"E 35°09’00"E 35°15’00"E 35°13’50"E 35°13’00"E
Year Season 50m 50m 15m 300m 150m 70m 2002 Winter H-V H-V H - - - Spring H-V H-V - - - - Summer H-V - - - - - Autumn H-V H-V H H-V H-V H 2003 Winter H-V H-V H H-V H-V H Spring H-V H-V H H-V H-V H Summer H-V H-V H H-V H-V H Autumn H-V H-V H H-V H-V H 2004 Winter H-V H-V H - - - Spring H-V H-V H H-V - - Summer H-V H-V H H-V H-V H Autumn H-V H-V H - - - 2005 Winter H-V - - - - - Spring H-V - - - - - Summer H-V H-V H - - H Autumn H-V - - - - -
405
the station “D” which was from anoxic zone (180 m; Kideys et al., 1997) to the surface. After sampling of each station, environmental factors including temperature and salinity were measured by YSI Probe 6600. Samples were washed with seawater through a 100 µm sieve and transferred into 330 ml glass jars with 4% formaldehyde with sodium borate buffered. Samples were transferred into distilled water, where ichthyoplankton and zooplankton were separated. The ichthyoplankton were then enumerated and identified in the lowest possible taxon, using taxonomic keys by Dekhnik (1976).
The evaluation of raw data was started with data exploration as suggested by (Zuur et al., 2010). Due to unbalanced structure, raw data was grouped for seasons and years. The groups that might express more than one species such as “Family spp.” were subtracted from the richness and abundance community matrices.
The embryonic (egg stages) and larval presence-absence data, obtained from both of the tows were combined as species richness community matrix. Species richness is a concept directly depending on sampling effort (Krebs, 1999). Therefore the first order jack-knife estimates of maximum species richness were calculated as suggested by (Hortalet al., 2006) due to the robust structure of this statistics for different sampling strategies. Seasonal and inter-annual changes of the observed and expected species richness values were tested by using non-parametric one way variance analysis, Kruskal-Wallis test. The relationship among environmental parameters and richness were evaluated with non-parametric Spearman Rank Correlation (Gamgam, 1989). Species
accumulation curves were used as other tools to evaluate species richness. These curves indicate the cumulative number of species by sampling effort. Due to the nature of richness concept, species accumulation curves were expected to turn a horizontal line by increasing number of samples, in a representative survey (Kindt and Coe, 2005).
The community matrices for abundance analysis were formed by considering only vertical tows separately for embryonic and larval stages. Pre and post larval stages were evaluated under the same group. The abundance values were calculated by standardizing the individual numbers to square meter surface area. The abundance community matrices were used for forward analysis. Species diversity were calculated with natural logarithmic based Shannon-Wiener Diversity index (H’) and its evenness component Pielou’s (J) evenness index (Magurran, 2004).
The similarity was evaluated by using Bray-Curtis distances calculated by log (x+1) transformed abundance community matrices. The transformation had down-weighted the effect of dominant species on distances. The non-metric multi-dimensional scaling (NMDS) was selected as ordination method for the distance matrices. The inter-annual and seasonal patterns of distance matrices were evaluated by using ANOSIM (Kindt and Coe, 2005).
All statistical evaluations and visualizations were conducted by using R 3.0 language and environment for statistical computing (R Core Team, 2013) with R-Commander and BiodiversityR (Fox, 2005; Kindt and Coe, 2005)graphical user interfaces and lattice and gplots libraries (Sarkar, 2008; Warnes
406
et al., 2013).
Results
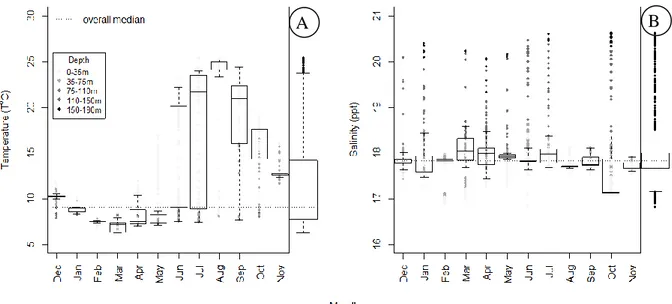
The temperature was measured between 6.24 and 25.41°C with an overall median 11.00°C at the surface water and 7.12 and 9.27°C below the 75m depth. The minimum temperature values occurred between February and March, whereas the maximum ones were between June and September. The temperature variations were much higher in warmer months in which clear temperature decrement in depth gradient was observed. Similarly, depth dependence was also observed in salinity measurements. Salinity was measured between 16.81 and 20.63‰ with an overall median 17.90‰. There were not clear temporal differences; however, it increased with depth (Figure 2). The median salinity below 75 m was 18.5‰. The temperature and salinity changes of the studying area clearly indicated a strong stratification patterns in warmer months. The stratification tendency started in May and lasted in October.
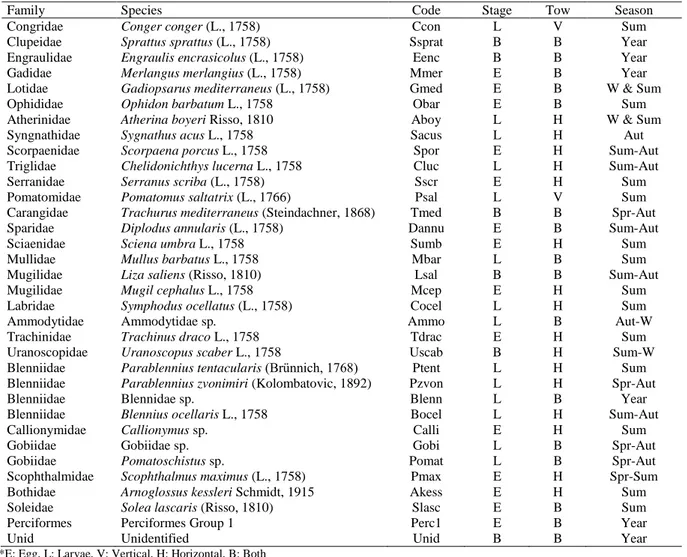
Early life stages of 27 teleost fish species were determined during the studying period. 6 groups were identified in higher than species level. The group named “Unidentified” contained the mechanically damaged early stages that had inaccurately identification risk (Table 2). The overall jack-knife estimate of maximum species richness was calculated as 33.8 for the studying area. Embryonic stages of 17 species and larval stages of 15 species were identified. 5 species were represented in samples with both of the embryonic and larval stages (Table 2).
The seasonal changes of observed species richness were significant (Kruskall-Wallis χ2=8.28, P=0.04); however, the maximum expected species richness changes were slightly insignificant (Kruskall-Wallis χ2=7.51, P=0.06). During winter and spring
months, observed species richness was 6 and
expectancies were 9.67 and 7.8 respectively. The species accumulation in winter had an increasing trend. In contrast, sampling effort seemed to be adequate to reach maximum species richness in spring. High species richness was determined in summer and autumn months with an increasing trend of species accumulation curves that showed richness expectancy was relatively higher. Observed species numbers were 26 and 12 and their expectancies were 33.2 and 20.1 respectively (Figure 3). In the temporal perspective, a relatively high correlation coefficient was significant between surface temperatures and expected maximum species richness (Spearman’s Rho=0.59; S=117; P=0.04); however, the salinity effect was not clear (Spearman’s Rho=-0.34; S=382; P=0.29).
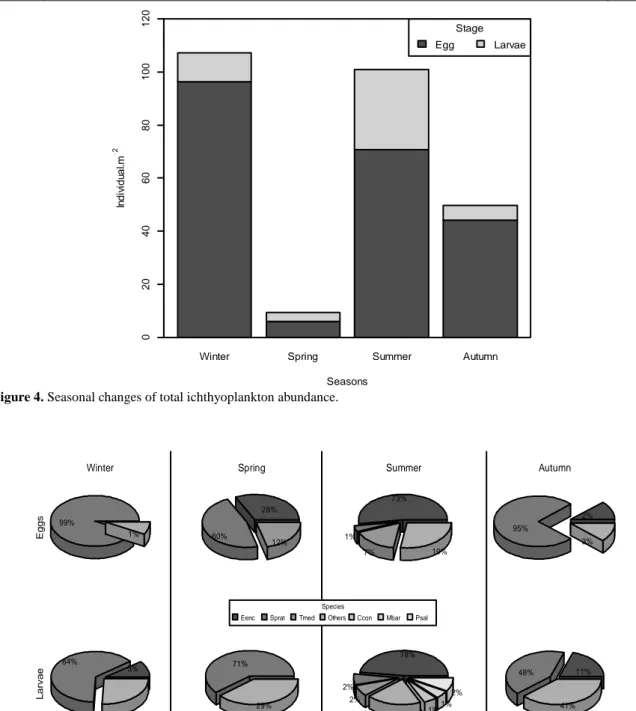
The highest total embryonic abundances were in winter with 96 individual eggs per m2 surface area, followed by 71 individual eggs per m2 surface areas in summer. Embryonic abundances were relatively low in spring and autumn months and detected as 44 and 6 eggs per m2 surface area. General abundance trend of larval stages had some differences with embryonic stages. Larval abundances were the highest in summer months with 31 individual larvae per m2 surface area. In the rest of the years, they showed similar tendencies. The values were 11, 4 and 6 larvae per m2 surface areas in winter, spring and autumn respectively (Figure 4).
E. encrasicolus was the dominant species in
summer among the embryonic and larval stages with 52 and 24 individuals per m2 surface areas, respectively. A clear dominancy of S. sprattus was observed in rest of the year. Other species were mostly below 15% of total abundance (Figure 5).
The overall embryonic and larval species diversity and evenness were quite low for both embryonic and larval stages. The highest diversity
Figure 2. Annual temperature (A) and salinity (B) distribution changes of the studying area by referring the depth gradient
(Marginal boxplots show the overall distribution; the colour of dots shows measurement depth).
407
Table 2. Detected species and spawning seasons during the studying period
Family Species Code Stage Tow Season
Congridae Conger conger (L., 1758) Ccon L V Sum
Clupeidae Sprattus sprattus (L., 1758) Ssprat B B Year
Engraulidae Engraulis encrasicolus (L., 1758) Eenc B B Year
Gadidae Merlangus merlangius (L., 1758) Mmer E B Year
Lotidae Gadiopsarus mediterraneus (L., 1758) Gmed E B W & Sum
Ophididae Ophidon barbatum L., 1758 Obar E B Sum
Atherinidae Atherina boyeri Risso, 1810 Aboy L H W & Sum
Syngnathidae Sygnathus acus L., 1758 Sacus L H Aut
Scorpaenidae Scorpaena porcus L., 1758 Spor E H Sum-Aut
Triglidae Chelidonichthys lucerna L., 1758 Cluc L H Sum-Aut
Serranidae Serranus scriba (L., 1758) Sscr E H Sum
Pomatomidae Pomatomus saltatrix (L., 1766) Psal L V Sum
Carangidae Trachurus mediterraneus (Steindachner, 1868) Tmed B B Spr-Aut
Sparidae Diplodus annularis (L., 1758) Dannu E B Sum-Aut
Sciaenidae Sciena umbra L., 1758 Sumb E H Sum
Mullidae Mullus barbatus L., 1758 Mbar L B Sum
Mugilidae Liza saliens (Risso, 1810) Lsal B B Sum-Aut
Mugilidae Mugil cephalus L., 1758 Mcep E H Sum
Labridae Symphodus ocellatus (L., 1758) Cocel L H Sum
Ammodytidae Ammodytidae sp. Ammo L B Aut-W
Trachinidae Trachinus draco L., 1758 Tdrac E H Sum
Uranoscopidae Uranoscopus scaber L., 1758 Uscab B H Sum-W
Blenniidae Parablennius tentacularis (Brünnich, 1768) Ptent L H Sum
Blenniidae Parablennius zvonimiri (Kolombatovic, 1892) Pzvon L H Spr-Aut
Blenniidae Blennidae sp. Blenn L B Year
Blenniidae Blennius ocellaris L., 1758 Bocel L H Sum-Aut
Callionymidae Callionymus sp. Calli E H Sum
Gobiidae Gobiidae sp. Gobi L B Spr-Aut
Gobiidae Pomatoschistus sp. Pomat L B Spr-Aut
Scophthalmidae Scophthalmus maximus (L., 1758) Pmax E H Spr-Sum
Bothidae Arnoglossus kessleri Schmidt, 1915 Akess E H Sum
Soleidae Solea lascaris (Risso, 1810) Slasc E B Sum
Perciformes Perciformes Group 1 Perc1 E B Year
Unid Unidentified Unid B B Year
*E: Egg, L: Larvae, V: Vertical, H: Horizontal, B: Both
Figure 3. Seasonal changes of observed and expected species richness (A) and seasonal species accumulation curves (B).
408
was detected in spring in quantitative egg samples (H’=0.917, J=0.835). Embryonic diversity was considerably higher in summer months (H’= 0.559, J=0.393) than those of the rest of the year (H’= 0.018, J=0.04 in winter; H’= 0.114, J= 0.206 in autumn). Larval diversities had quite different tendencies compared to the embryonic diversity. The highest diversity existed in summer (H’= 0.426, J= 0.238) and autumn (H’= 0.483, J= 0.696). Larval diversity was quite low in winter (H’= 0.122, J= 0.196). Due to the only larval stages of S. Sprattus identified at species level in the quantitative samples in spring, the diversity was measured zero (Figure 6).
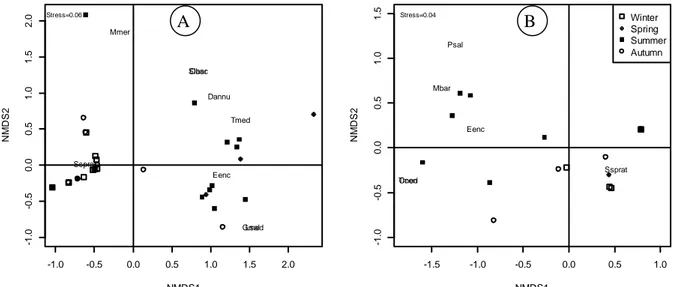
Non-metric multidimensional scaling ordination
was found to be representative for distance matrix in embryonic stages (Mantel R=0.93, P<0.01). The seasonal patterns in distance matrix were highly significant (ANOSIM R= 0.41, P<0.01), whereas the inter-annual patterns not. Two main groups were noticed directly depending on seasons in the ordination space. The summer group was mostly shaped by E. encrasicolus, T. mediterraneus and
Diplodus annularis eggs, whereas the characteristic
embryonic stage was S. sprattus in winter group (Figure 7A.).
Similar to the embryonic stages the non-metric multidimensional scaling was the best ordination technique also for larval stages (Mantel R= 0.88,
Winter Spring Summer Autumn
Seasons In d iv id u a l.m 2 0 20 40 60 80 100 120 Stage Egg Larvae
Figure 4. Seasonal changes of total ichthyoplankton abundance.
99% 1% Eg g s Winter 28% 60% 12% Spring 73% 1% 7% 19% Summer 2% 95% 3% Autumn 3% 84% 13% L a rva e 71% 29% 78% 2% 2% 14% 1% 1% 2% 11% 48% 41% Species
Eenc Sprat Tmed Others Ccon Mbar Psal
Figure 5. Seasonal changes of dominant species among embryonic and larval stages (The square root transformed
409
P<0.01). The seasonal patterns in distance matrix were highly significant (ANOSIM R= 0.33, P<0.01), whereas the inter-annual patterns were not. Two main groups could be noticed depending on the seasonal patterns also in larval stages. The summer group was dominated by E. encrasicolus, Mullus barbatus and
Trachurus mediterraneus. The dominant species for
winter assemblage was S. sprattus (Figure 7B).
Discussion
Throughout the studying period, early stages of 27 teleost fish species were sampled; however, the overall richness expectancy was 34 species (Jack-knife estimate of species richness). Embryonic stages of 17 and larval stages of 15 species were detected. The increasing trends of the species accumulation curves especially in winter, summer and autumn also
indicated that the early stage assemblages of the area might have been richer than those of observed in this study for Sinop coasts. Dekhnik (1973) mentioned about 56 teleost fish species that had pelagic early life stages for Black Sea. Among them, 28 fish species were producing pelagic eggs and larvae and other 28 species having pelagic larvae only. Gordina et al. (1998) observed eggs of 28 and larvae of 44 fish species in the Black Sea during their surveying period of 1986-1996. Satilmis et al. (2003), during their studies, either the eggs or larvae of 23 fish species were found in samples obtained from both vertical and horizontal tows. Thus, eggs of 13 fish species and larvae of 13 fish species were found off Sinop respectively. Basar and Okumus (1997) detected early stages of 18 fish species off Surmene coasts.
The dynamics of ichthyoplankton assemblages are complicated cases which depend on a lot of
Figure 6. Seasonal changes of Embryonic (A) and Larval (B) Shannon-Wiener Diversity (H’; ln based) and Pielou Evenness
(J) Indices. -1.0 -0.5 0.0 0.5 1.0 1.5 2.0 -1 .0 -0 .5 0 .0 0 .5 1 .0 1 .5 2 .0 (A) NMDS1 N M D S 2 Stress=0.06 Dannu Eenc GmedLsal Mmer Obar Slasc Ssprat Tmed -1.5 -1.0 -0.5 0.0 0.5 1.0 -1 .0 -0 .5 0 .0 0 .5 1 .0 1 .5 (B) NMDS1 N M D S 2 Winter Spring Summer Autumn Ccon Eenc Mbar Psal Ssprat Tmed Stress=0.04
Figure 7. Non-metric multi-dimensional scaling ordination for embryonic (A) and larval (B) stages.
A
A
B
410
physicochemical and biological factors. Among the physicochemical factors, temperature and salinity influence early life stages of fishes directly and indirectly (Avsar, 2005). For instance, while the direct effect of temperature on ichthyoplankton assemblages is mostly related with poikilothermic nature of fishes, the indirect effects are about a lot of factors such as timing of spawning and matching the optimal food conditions for larval survival and growth (Peck et al., 2012). The fish individually has to acclimate all of these dynamics to sustain its population. One of the most important strategies that the fish populations overcome the extinction risk is timing of spawning especially in sub-tropical seas (Potts and Wootton, 1984).
The structure and composition of an ichthyoplankton assemblage directly depend on the spawning periods of existed species (Mavruk, 2009). A strong seasonal structure has been observed also in the studying area. The similarity matrices of embryonic and larval stages were found to be highly correlated with seasons and the seasonal changes of species richness were also significant. A clear increment has been observed in species richness during summer and autumn when temperature is also high. So, the strong correlation between monthly temperature values and expected species richness was significant and the number of spawning species was higher in warmer months than that of cold months. Therefore, the significant seasonal effect could be considered as a proxy of environmental conditions such as temperature and food availability in the studying area (Moser et al., 1983). So, the seasonally grouped structure of ichthyoplankton assemblage of Sinop coasts may also be explained by the timing of spawning and match-mismatch dynamics.
The seasonal differences of abundance, dominancy and diversity were also related to seasonal spawning dynamics. The egg abundance was highest in winter though the species number was the lowest. Extremely high dominancy of S. sprattus caused very low biodiversity values for winter. Spring embryonic diversity was also quite high in spite of low abundance and species richness. The diversity is a coexisting result of dominance and richness (Magurran, 2004). The reason of high diversity of the poorest month was the low dominancy and high evenness for embryonic stages. In contrast to egg stages, the larval diversity was quite low in spring; however, this value probably did not show the actual diversity because the 29% of larval stages could not be identified at species level and were removed from abundance community matrix. Sumer diversity was quite high in comparison with the other seasons in spite of heterogeneous species composition for both embryonic and larval stages. The high species richness increased the biodiversity in spite of the dominancy of E. encrasicolus. S. sprattus dominancy caused a low diversity in autumn for embryonic stages. However, a more homogenous composition
caused more diversity in larval assemblages.
S. sprattus and E. encrasicolus were the key
early stages of the studying area. Both of the species were found in ichthyoplankton samples throughout year. However, E. encrasicolus was dominant in summer. S. sprattus was dominant in rest of the year. Satilmis et al. (2003) also found the highest species richness during spring and summer. They observed that especially anchovy (E. encrasicolus) eggs and larvae were highly abundant during this period. Additionally, beginning from May, the eggs and larvae of species, such as Mullus barbatus, Solea
lascaris, Trachurus mediterraneus, Ctenolabrus sp.,
Blennidae and Gobiidae were represented in samples. In the colder period of the year, early life stages of sprat (S. sprattus) were dominant in ichthyoplankton. According to overall quantitative evaluation, anchovy (87%) had superiority in abundance among egg samples and Gobius sp. (35%) among larvae samples. Satilmis et al. (2003)’s results were consistent with those of this study.
The inter-annual changes of maximum expected species richness were insignificant. The species diversity and abundance were not been interpreted with statistical analysis. However, both of them did not show any meaningful trend in the annual scale. Moreover, groups in Bray-Curtis similarity matrices were not correlated with inter-annual differences. The inter-annual species richness changes seemed to be directly depending on the sampling effort (Table 1, Figure 3B). The years in which low species richness values were obtained also sampled to have a low effort. Therefore the sampling intensity of this study was not considered properly for evaluating inter-annual trends of ichthyoplankton assemblage dynamics.
Acknowledgements
This study was supported by the contribution of State Planning Organisation under project number 2002 KI20500 (TAP-S013) “Monitoring of basic pelagic ecosystem Parameters in the Central Black Sea” and contribution to Ondokuz Mayis University for Scientific Research Project, project number OMÜ-S090 “The composition of phytoplankton, zooplankton, ichthyoplankton and mesoplankton of Sinop coast and its impact on the Black Sea ecosystem and fisheries”.
References
Ak, O. 2009. Trabzon kıyılarında balık yumurta ve larvalarının dağılımı ile ekonomik demersal balıklardan mezgit (Merlangius merlangus euxinus, Nordmann, 1840) ve barbunya (Mullus barbatus ponticus, Ess. 1927)’nın yumurta uretiminin incelenmesi. PhD thesis, Erzurum: Atatürk University, 133 pp.
Arim, N. 1957. Marmara ve Karadeniz’deki bazı kemikli balıkların (Teleostların) yumurta ve larvalarının
411
morfolojileri ile ekolojileri. Hidrobiyoloji Mecmuası, 5(1-2): 7-55.
Avsar, D. 2005. Balıkçılık Biyolojisi ve Populasyon Dinamiği. Nobel Kitabevi. Adana, 332 pp.
Basar, E. and Okumus, I. 1997. Sürmene (Doğu Karadeniz) Koyu’nda bazı teleost balıkların pelajik yumurta ve larvalarının mevsimsel dağılımı. In: B. Hossu (Ed.), Uluslar Arası Akdeniz Balıkçılık Kongresi; 9–11 April 1997; Izmir, Turkey (in Turkish).
Dekhnik, T.V. 1973. Ichthyoplankton of the Black Sea, Cernova Moria Haukova, Kiev, 234 pp.
Fox, J. 2005. The R Commander: A basic statistics graphical user interface to R. Journal of Statistical Software, 14(9): 1–42.
Gamgam, H. 1989. Parametrik Olmayan İstatistik Teknikler. Gazi Üniversitesi Fen-Edebiyat Fakültesi Yayınları. Ankara, 289 pp.
Gordina, A.D., Niermann, U., Kideys, A.E., Subbotin, A.A., Artyomov, Y.G. and Bingel, F. 1998. State of Summer Ichthyoplankton in The Black Sea. In: L. Ivanov and T. Oguz (Eds.), NATO TU-Black Sea Project: Ecosystem Modeling as a Management Tool For The Black Sea, Symposium on Scientific Results, Kluwer Academic Publishers, London: 367-380. Hortal, J., Borges, P.A.V. and Gaspar, C. 2006. Evaluating
the performance of species richness estimators: sensitivity to sample grain size. Journal of Animal Ecology, 75(1): 274–287.
doi:10.1111/j.1365-2656.2006.01048.x
Kideys A.E., Uysal, Z., Bingel, F., Gucu, A.C. and Eker, E. 1997. Karadeniz'in Ekolojisi. YDABÇAG 446/G No’lu Tübitak Projesi, ODTÜ Deniz Bilimleri Enst. 45 pp. (in Turkish).
Kideys, A.E., Gordina, A.D., Bingel, F. and Niermann, U. 1999. The efect environmental conditions on the distribution of eggs and larvae of anchovy (Engraulis Encrasicolus L.) in the Black Sea. ICES Journal of Marine Science, 56: 58-64.
Kindt, R. and Coe, R. 2005. Tree diversity analysis: A manual and software for common statistical methods for ecological and biodiversity studies. Nairobi: World Agroforestry Centre (ICRAF) 196 pp. Krebs, C. 1999. Ecological Methodology. Addison-Wesley
Educational Publishers Inc., Melbourne, 654 pp. Mavruk, S. 2009. Yumurtalik Kiyisal Zonu (İskenderun
Körfezi) İhtiyoplanktonunda Mevsimsel Değişimler. MSc thesis. Adana: Çukurova Üniversity, 198 pp. (in Turkish).
Magurran, A. 2004. Measuring Biological Diversity. Blackwell Publishing, London, 256 pp
Mater, S. ve Cihangir, B. 1990. Karadeniz, İstanbul Boğazı girişinde balık yumurta-larva dağılımı üzerine bir çalışma. X. Ulusal Biyoloji Kong. 18-20 Temmuz 1990, Erzurum: 209-216. (in Turkish).
Mater, S. ve Cihangir, B. 1997. Güney-Batı Karadeniz’de hamsi (Engraulis encrasicolus (L, 1758)) ve istavrit (Trachurus mediterraneus (Steindachner, 1868)) yumurtalarının bolluk ve dağılımı, Tr. J. Zoology, 21: 417- 420.
Moser, H.G., Richards, W.J., Cohen, D.M., Fahay, M.P., Kendall, A.W. and Richardson, S.L. 1983. Ontogeny and systematics of fishes, based on an International Symposium dedicated to the Memory of Elbert Halvor Ahlstrom. American Society of Ichthyologists and Herpetologists. Special Publication Number: 1. USA, 725 pp.
Niermann, U., Bingel, F., Gorban, A., Gordina, A.D., Gucu,
A.C., Kideys, A.E., Konsulov, A., Radu, G., Subbotin, A.A. and Zaika, V.E. 1994. Distirubution of anchovy eggs and larvae (Engraulis encrasicolus Cuv.) in the Black Sea in 1991 and 1992 in Comparison to Former Survey. ICES Journal of Marine Science, 51: 395-406p.
Peck, M., Huebert, K. and Llopiz, J. 2012. Intrinsic and extrinsic factors driving match-mismatch dynamics during the early life history of marine fishes. Advances in Ecological Research, 47: 177–302. doi:10.1016/B978-0-12-398315-2.00003-X
Potts, G.W. and Wootton, R.J. 1984. (Eds.), Fish Reproduction Strategies and Tactics. Academic Press, London, 410 pp.
R. Core Team, 2013. R: A Language and Environment for Statistical Computing. Vienna, Austria: R Foundation for Statistical Computing. http://www.r-project.org/ (accessed at December 18, 2013)
Sahin, C. and Hacimurtazeoglu, N. 2013. Abundance and distribution of eggs and larvae of anchovy (Engraulis encrasicolus, Linnaeus, 1758) and horse mackerel (Trachurus mediterraneus, Steindachner, 1868) on the coasts of the eastern Black Sea, Turk. J. Zool., 37: 773-781. DOI: 10.3906/zoo-1212-31
Sarkar, D. 2008. Lattice: multivariate data visualization with R. Springer. New York, 268 pp.
Satilmis, H. H., Gordina, A.D., Bat, L., Bircan, R., Culha, M, Akbulut, M. and Kideys, A.E. 2003. Seasonal distribution of fish eggs and larvae off Sinop (The Southern Black Sea) In 1999-2000, Acta Oecologica, 24(1): 275-280.
Satilmis, H.H. 2005. Sinop Kıyılarında Küçük Pelajik Balıkların Yumurta Üretimi ile Yumurta ve Larvalarının Dağılımı. PhD thesis, Samsun: O.M.Ü. Fen Bilimleri Enstitüsü, Samsun, 160 pp.
Satilmis, H.H., Bat, L., Birinci-Ozdemir, Z., Ustun, F, Sahin, F., Kideys, A.E. and Erdem, Y. 2006. Composition of eggs and larvae of fish and macrogelatinious zooplankton in Sinop Region (The Central Black Sea) during 2002 Ege Üniversitesi Su Ürünleri Dergisi, 23(1-1): 135-140.
Satilmis, H.H., Bat, L., Ustün, F, Birinci-Ozdemir, Z. and Sahin, F. 2009. Orta Karadeniz’in Sinop Bölgesi Balık Yumurta ve Larvalarının Tür Kompozisyonu. 15. Ulusal Su Ürünleri Sempozyumu, 01‐04 Temmuz 2009, Rize (in Turkish).
TUIK 2012. Türkiye İstatistik Kurumu. Su Ürünleri Istatistikleri. www.tuik.gov.tr. (accessed at December 18, 2013).
Warnes, G. R., Bolker, B., Bonebakker, L., Huber, W., Liaw, A., Lumley, T. and Venables, B. 2013. gplots: Various R programming tools for plotting data. R package Retrieved from http://cran.r-project.org/ package=gplots
Yuksek, A. 1993. Marmara Denizi’nin kuzey bölgesinde teleostat balıkların pelajik yumurta ve larvalarının dağılımı ve bolluğu (Bakırköy Marmara Ereğlisi), PhD thesis, İstanbul: İstanbul University (in Turkish). Yuksek, A. and Ince, S. 2011. Batı Karadeniz (iğneada-İstanbul Boğazı) yaz Dönemi İhtiyoplankton Kompozisyonu. X. Ulusal Ekoloji ve Çevre Kongresi 04-07 Ekim 2011, Çanakkale. (in Turkish).
Zuur, A.F., Ieno, E.N. and Elphick, C.S. 2010. A protocol for data exploration to avoid common statistical problems. Methods in Ecology and Evolution, 1(1): 3–14. doi:10.1111/j.2041-210X.2009.00001.x