THE EFFECT OF TASK ON CUE
USEFULNESS FOR VISUAL SCENE
CLASSIFICATION
a thesis submitted to
the graduate school of engineering and science
of bilkent university
in partial fulfillment of the requirements for
the degree of
master of science
in
neuroscience
By
Meltem Karaca
May 2017
THE EFFECT OF TASK ON CUE USEFULNESS FOR VISUAL SCENE CLASSIFICATION
By Meltem Karaca May 2017
We certify that we have read this thesis and that in our opinion it is fully adequate, in scope and in quality, as a thesis for the degree of Master of Science.
Aaron Michael Clarke(Advisor)
Hacı Hulusi Kafalıgönül
Mine Mısırlısoy
Approved for the Graduate School of Engineering and Science:
Ezhan Karaşan
ABSTRACT
THE EFFECT OF TASK ON CUE USEFULNESS FOR
VISUAL SCENE CLASSIFICATION
Meltem Karaca M.S. in NEUROSCIENCE Advisor: Aaron Michael Clarke
May 2017
Detecting objects in the environment is one of the most fundamental functions of the visual system. Humans are highly effective at this, and past studies have shown that we can process things like whether or not an animal is present in a scene within 150 msec. Different lines of research have also examined possible cues that may be useful for rapid object detection and scene classification, and have found things like color, luminance, shape and texture to be diagnostic. Studies examining the degree to which different cues are effective for detecting objects have found that shape and texture are the most important. However, it is unclear whether cue effectiveness depends on the task being employed. The discriminative information contained in different cues may vary depending on the task. This master’s thesis examines the effects of task-relevant information on which cues are most useful for visual detection. In order to investigate the impact of task type on visual cue usefulness, participants were asked to do animal and water detection tasks. They were presented with natural scenes that contain animals or water. We found significant differences in cue usefulness depending on the task. Corresponding differences were also found for reaction times based on the different cues. The results indicated that effectiveness of visual cues depends on the nature of the task, and different cues might be more or less useful when individuals are instructed to do different kinds of tasks.
Keywords: object recognition, scene classification, natural scenes, signal detection theory, visual cues.
ÖZET
GÖRSEL GÖRÜNTÜ SINIFLANDIRMASINDA
GÖREV TÜRÜNÜN İPUCU KULLANIŞLILIĞI
ÜZERİNE ETKİSİ
Meltem Karaca
Nörobilim Lisansüstü Programı, Yüksek Lisans Tez Danışmanı: Aaron Michael Clarke
Mayıs 2017
Çevredeki nesneleri algılama, görsel sistemin en temel işlevlerinden biridir. Geçmiş çalışmalar, insanların 150 ms boyunca sunulan bir resme baktığında, res-imde hayvan bulunup bulunmadığını algılayabildiğini göstermiştir. Bu demek oluyor ki, insanlar görsel olarak sunulan bir uyaranı etkin bir şekilde işleyebilir. Farklı araştırmalar ise, hızlı nesne algılama ve görüntü sınıflandırması için yararlı olabilecek olası ipuçlarını inceleyip; renk, parlaklık, şekil ve doku gibi ipuçlarının görsel algılamada etkili oldugunu bulmuştur. Nesneleri tespit etmek için farklı ipuçlarının etkili olma derecelerini inceleyen araştırmalar, şekil ve dokunun en önemli ipuçları olduğunu göstermiştir. Fakat geçmiş çalışmalar, ipucu etkilil-iğinin yapılan göreve ne kadar bağlı olduğunu göz önünde bulundurmamıştır. Literatürdeki bu eksiği gidermek amacıyla, kullanılan ipucu ve yapılan görev arasındaki ilişkiyi bu yüksek lisans tezinde inceledik. Çünkü farklı ipuçlarında bulunan ayırt edici bilgiler, göreve göre değişebilir. Bu nedenle, görev türünün görsel ipucu kullanışlılığı üzerindeki etkisini araştırmak istedik. Bu doğrultuda, katılımcılara içerisinde hayvan veya su bulunan resimler sunularak, resimlerdeki hayvanı ve suyu algılama görevi yapmaları istenmiştir. Araştırma bulgularına göre göreve bağlı ipucu kullanışlılığında önemli farklılıklar bulunmuştur. Ayrıca farklı ipuçlarına dayanan tepki süresinde de farklılıklar gözlenmiştir. Bu sonuçlar, görsel ipuçlarının etkililiğinin görevin niteliğine bağlı olduğunu ve bireylere farklı görev türü talimatı verildiğinde etkin olan ipuçlarının değişebileceğini göster-miştir.
Anahtar sözcükler : Nesne tanıma, görüntü sınıflandırması, doğal görüntüler, sinyal algılama teorisi, görsel ipuçları.
Acknowledgement
First of all, I would like to express my deepest gratitude to my advisor, Asst. Prof. Dr. Aaron Clarke, for his sincere support and continuous guidance throughout the entire project. His experience and knowledge in the field of vision science kept me on the right track. I am going to miss his delicious oatmeal cookies and our fruitful meetings which were also full of fun.
I would like to thank Asst. Prof. Dr. Hulusi Kafalıgönül and Assoc. Prof. Dr. Mine Mısırlısoy for serving on my thesis committee and their useful feedback. I would also like to express my appreciation to Asst. Prof. Dr. Miri Besken for the inspiration and the safe haven that she provided to me whenever I needed.
With great pleasure, I would like to thank my colleagues and friends Nilsu, Öykü, Bilge and Betül. They made my undergraduate and graduate experience so much cheerful. I always smile when I think of our memorable moments. I would also like to thank all my other friends with whom I have shared memories during the past two years and with some even more. I am lucky to have such amazing friendships on my life journey.
Special thanks to Berkcan. I sincerely believe that we have become a better version of ourselves since the first day we met. His support during my graduate degree helped me to survive the hardships of thesis writing.
I would like to thank my dear family who directed me to academia. Mürüvvet, my mother, was always there for me with her unconditional love and infinite support. I am thankful for the excellent example she has provided as a successful working woman. Muammer, my father, encouraged me throughout this phase of my life. Mert, my brother, motivated me with his valuable comments. He was always there anytime I needed advice on my academic path. Damla, my sister-in-law, encouraged me to enroll the Psychology at Bilkent University and helped me to adapt the college life. I would like to thank my whole family again for always being by my side. I feel grateful for the joy you bring into my life.
Contents
List of Figures viii
List of Tables xii
1 Introduction 1
1.1 Neurophysiology . . . 4
1.2 Behavioural Studies . . . 5
1.2.1 Role of Spatial Frequency . . . 5
1.2.2 Role of Color . . . 7
1.2.3 Role of Luminance . . . 9
1.2.4 Role of Texture . . . 10
1.2.5 Role of Shape . . . 11
1.3 The Present Study . . . 13
CONTENTS vii
2.1 Participants . . . 16
2.2 Apparatus and Stimuli . . . 17
2.3 Procedure . . . 20
3 Results 23 3.1 Signal Detection Theory . . . 23
3.2 Statistical Results on Detection Sensitivity . . . 26
3.3 Inferred Cue Sensitivities . . . 29
3.3.1 Results on Inferred Cue Statistics . . . 33
3.4 Statistical Results on Reaction Time . . . 34
4 Discussion 36
5 Future Directions 42
6 Conclusion 44
Bibliography 49
List of Figures
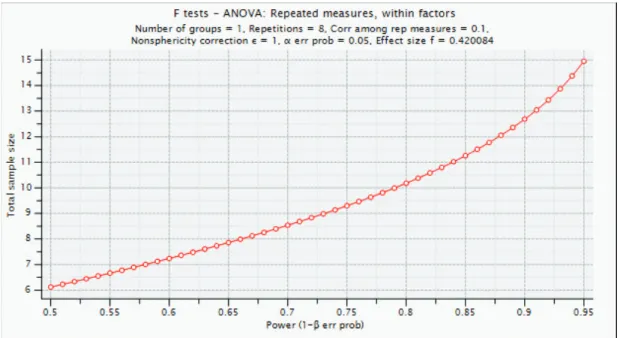
2.1 Sample size versus power for an effect size of f = 0.42. . . 17
2.2 Examples of images containing water: LC, LCS, LCSO, LCTS, LCTSO, LTS, LTSO, SO respectively. . . 19
2.3 Examples of images containing animals: LC, LCS, LCSO, LCTS, LCTSO, LTS, LTSO, SO respectively. . . 20
2.4 Trial sequence for the animal classification task. The procedure was identical for the water classification task. . . 22
3.1 Comparison of signal and noise distributions for µS = 4 and µN = 6
in units of standard deviations. Z-normalized distributions are shown in the bottom graph. The green and red regions are the hit and false alarm regions respectively. The blue lines mark the decision criterion – below this line the subject classifies the signal as target and above it they classify the signal as noise. . . 25
3.2 Comparison of signal and noise distributions for µS = 4 and µN = 5
in units of standard deviations. Z-normalized distributions are shown in the bottom graph. Green and red regions as well as the blue criterion line denote the same things as in Figure 3.1. Note here that the distributions are closer together than they are in Figure 3.1, indicating a lower d0. . . 26
LIST OF FIGURES ix
3.3 Sensitivity (d0) as a function of cue type and task type. ∗’s indicate significant differences between the water and animal tasks (p < 0.05). Examples of images corresponding to the different cue types are shown below the data. . . 28
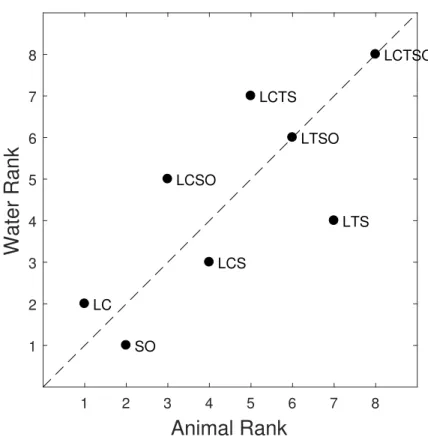
3.4 Sensitivity ranks for the water task plotted against those for the animal task. If the ranks were the same for the two tasks, then all points would fall exactly on the diagonal. Here, it can clearly be seen that this is not the case. . . 29
3.5 Signal detection theoretic multidimensional distributions of the cues. In both plots, iso-probability contours for the noise distri-butions are plotted in red, and the signal distridistri-butions are plotted in green. The diagonal blue lines connecting the means of the sig-nal and noise distributions denotes sensitivity (d0). The straight blue lines projecting to the axes denote the marginal sensitivities. Left: two-dimensional joint distributions for the luminance and colour cues. Right: three-dimensional joint distributions for the luminance, colour, and shape cues. . . 30
3.6 Mean marginal cue sensitivity (d0) as a function of cue type (C = colour, T = texture, L = Luminance, and S = shape). The left two subplots are for the animal/no animal task and the right two are for the water/no water task. The top two subplots are for the cases where the images had no outlines and the bottom two subplots are for the cases where the images had outlines. In each subplot, the cues are sorted in ascending order of sensitivity. . . 32
3.7 Reaction time plotted as a function of cue type and task. . . 35
3.8 Reaction time without outliers plotted as a function of cue type and task. . . 35
LIST OF FIGURES x
A.1 Mean Table for Detection Sensitivity. Task 1 = Animal/No Ani-mal, Task 2 = Water/No Water, Cue 1 = Luminance and Colour, Cue 2 = Luminance, Colour and Shape, Cue 3 = Luminance, Colour, Shape and Outline, Cue 4 = Luminance, Colour, Texture and Shape, Cue 5 = Luminance, Colour, Texture, Shape and Out-line, Cue 6 = Luminance, Texture and Shape, Cue 7 = Luminance, Texture, Shape and Outline, Cue 8 = Shape and Outline. . . 50
A.2 Full ANOVA Results for Detection Sensitivity. Due to violations of the sphericity assumption, we adopted the Greenhouse-Geisser correction for all of our reported statistics. . . 51
A.3 Mean Table for Inferred Cue Sensitivites.Task 1 = Animal/No An-imal, Task 2 = Water/No Water, Cue 1 = Luminance and Colour, Cue 2 = Luminance, Colour and Shape, Cue 3 = Luminance, Colour, Shape and Outline, Cue 4 = Luminance, Colour, Texture and Shape, Cue 5 = Luminance, Colour, Texture, Shape and Out-line, Cue 6 = Luminance, Texture and Shape, Cue 7 = Luminance, Texture, Shape and Outline, Cue 8 = Shape and Outline. . . 52
A.4 Full ANOVA Results for Inferred Cue Sensitivites. Due to vio-lations of the sphericity assumption, we adopted the Greenhouse-Geisser correction for all of our reported statistics. . . 53
A.5 Mean Table for Reaction Time. Task 1 = Animal/No Animal, Task 2 = Water/No Water, Cue 1 = Luminance and Colour, Cue 2 = Luminance, Colour and Shape, Cue 3 = Luminance, Colour, Shape and Outline, Cue 4 = Luminance, Colour, Texture and Shape, Cue 5 = Luminance, Colour, Texture, Shape and Outline, Cue 6 = Luminance, Texture and Shape, Cue 7 = Luminance, Texture, Shape and Outline, Cue 8 = Shape and Outline. . . 54
LIST OF FIGURES xi
A.6 Full ANOVA results for Reaction Time. Due to violations of the sphericity assumption, we adopted the Greenhouse-Geisser correc-tion for all of our reported statistics. . . 55
A.7 Mean Table for Reaction Time without Outliers. Task 1 = Ani-mal/No Animal, Task 2 = Water/No Water, Cue 1 = Luminance and Colour, Cue 2 = Luminance, Colour and Shape, Cue 3 = Lu-minance, Colour, Shape and Outline, Cue 4 = LuLu-minance, Colour, Texture and Shape, Cue 5 = Luminance, Colour, Texture, Shape and Outline, Cue 6 = Luminance, Texture and Shape, Cue 7 = Luminance, Texture, Shape and Outline, Cue 8 = Shape and Out-line. . . 56
A.8 Full ANOVA results for Reaction Time without Outliers. Due to violations of the sphericity assumption, we adopted the Greenhouse-Geisser correction for all of our reported statistics. . . 57
List of Tables
Chapter 1
Introduction
Recognizing the objects around us has great survival value. Organisms who are unable to detect water risk dying of thirst, and if they are unable to find food, they risk dying of starvation. In primitive times, detecting whether or not there was an animal in the vicinity was crucial for survival. Human beings can protect themselves from predators by quickly and accurately detecting if there is a threat in their close environment. For this reason, our visual system must be adapted for rapid animal detection. In modern times, a person who is unable to detect cars will have a perilous time crossing the road. Moreover, car detection needs to happen quickly and efficiently in order to reduce the risk of an accident. Thus, recognizing a natural scene rapidly and accurately can be very useful in our everyday lives. Natural scene detection, however, is made more difficult by the fact that individuals encounter very different types of scenes throughout their lives (e.g. forests, beaches, and mountains).
Even though natural scene detection might be a challenging task which requires small distinctions among large numbers of complex scenes, the human visual system is highly skilled at this task. For example, human observers are efficient in comprehending the gist of a novel scene rapidly even when they see a blurred image. This was demonstrated in [1]’s study where participants were administered a yes/no matching task. Stimuli were grayscale images of a highway, a valley, a
city or a living room. The reason why these images were selected was their similarity in overall contrast. In other words, the Fourier amplitude spectra of these images were highly correlated. The images were presented in four different conditions: normal (un-filtered), low-pass filtered, high-pass filtered and hybrid images of scenes. A hybrid image could match either the low- or high-spatial frequency content of the target image. The target image was always a normal image. Participants were asked to press “yes” if the presented sample matched the target and press “no” if the sample did not match the target. Although low-pass, high-pass and hybrid images looked blurry, participants were able to correctly recognize the scenes.
Moreover, it was shown that in the course of a rapid presentation of a series of photographs including a variety of scenes and objects, human observers were able to accurately recognize the semantic category of the photographs, a couple of the objects, and their characteristics [2]. In this experiment, participants were rapidly presented with a stream of 16 images. Participants were asked to look for a certain kind of real-world scene. If they saw it, then they were to press a lever which made the projector stop. There were two groups of participants. In the first group, participants were shown the target image before viewing the image stream. In the second group, participants were solely given the name of the image that they were to look for. These were, however, very brief explanations of events or objects in the picture. Participants were given no information about the colours or shapes of the objects or events. For instance, participants might be asked to look for a beach scene. In the first group, participants were shown the beach scene before they started the experiment. On the other hand, in the second group, participants were only given the name of the scene that they were going to view (e.g. “a beach”). The image presentation duration varied across participants. There were four different presentation durations: 125, 167, 250, and 333 msec. Results revealed that detection rates were high for both target conditions across all presentation durations. This means that people were able to accurately identify the image categories with very short presentation times even if they shifted their glances very briefly.
roughly five times per second, implying that we parse the visual scene on a very short time scale [3]. These raise the question - how quickly can we rec-ognize/classify a visual scene, and what cues are useful for doing this?
[4] measured how fast observers are able to detect animals in natural scenes. Their results indicate that people can do scene classification in as little as 150 msec. In this ERP study, participants were asked to perform a go/no-go cat-egorization task. During the task, participants were presented with coloured photographs of natural scenes containing animals in their natural environments. These images with animals were target images. In addition, there were distrac-tor images in which participants were presented with images including forests, mountains, buildings or fruit with no animals in them. Participants viewed each image only once in order to preclude any stimulus-specific learning effect. The images were presented very briefly (20 msec). After participants had seen each image, they had to determine whether or not the image contained an animal. The participants showed high accuracy in spite of the extremely brief viewing times. An analysis of concomitantly recorded ERPs showed that frontal negativ-ity was observed for no-go trials and that this activation developed within 150 msec after participants had seen the image. In other words, cortical activation differences between the animal and no-animal conditions were present within 150 msec of the stimulus onset, implicating rapid mechanisms for this kind of scene classification. Therefore, this ERP study suggests that our visual system is quite effective in rapid animal detection tasks, and that human observes can rapidly detect animals in natural scenes. Since participants were asked to detect animals in their natural environments, this experiment also implies that human observers are skilled in rapidly parsing natural scenes. In short, this study is important because it shows that human observes are able to detect animals in a shorter time frame than had been previously thought, and it puts strong limits on the cortical processing mechanisms that could be responsible – implicating fast, feedforward mechanisms.
In summary, these studies show that the visual system is highly effective at rapidly detecting objects in natural scenes, and at rapid scene classification, even when the images are blurred or when they shift very quickly. The question of
relevance, then, is that of what cues people are using for these classifications?
1.1
Neurophysiology
How are people able to successfully recognize their environment in spite of its variability?
There are several cues that can help people perceive the world efficiently. Based on findings from neurophysiological studies, we have identified several cues that the brain encodes and these are likely to be useful for scene classification and object recognition. For instance, V1 contains cells that are sensitive to bars, edges, and gratings [5, 6]. These cells also respond to different spatial frequencies [7, 8]. Some of these cells prefer single bars or edges while others prefer gratings. In addition, V2 region is sensitive to illusory contours. Some cells in V2 area respond to real contours and their illusory counterparts [9].
Moreover, according to experiments with monkeys, it is found that V4 extracts information about colour and simple shapes. For example, there are some cells in V4 which respond to contours having a particular curvature. These cells were found to have a bias in responding to contours with convexities. In addition, some cells in V4 are tuned to vertices with a certain angle. These cells can even be selective for the position of the contour in relation to the center of the shape. This selectivity implies that there is an object-centered representation of shape. Additionally, recent evidence suggest that there are individual neurons in V4 which represent different contours by firing at different times [10]. This allows the signals from the two contours to be temporally multiplexed, so that two contours which overlap in space may still be represented separately.
Furthermore, area TEO seems to encode higher-level object categories. It was demonstrated that cells in TEO represent simple shape elements. In particular, TEO neurons respond to medium-complexity features. Additionally, TEO inte-grates the information from contour elements with a higher degree of complexity
together with area V4. Thus, TEO works with V4 to make sense of contour information [11].
To sum up, there are particular regions in the brain that are responsible for encoding different cues types such as bars, edges, gratings, shape and colour. Although different regions respond to certain kinds of cues, it is not clear to what extent the different cues are useful for scene classification and rapid object detection. In order to more completely understand the usefulness of these cues, behavioural studies are helpful.
1.2
Behavioural Studies
Behavioural studies have tried to evaluate which cues are useful for scene classi-fication and rapid object detection. These studies have found varied results.
1.2.1
Role of Spatial Frequency
Although [4] demonstrated that people are able to rapidly discriminate whether or not there is an animal in the image, it is still not clear what kinds of image features support this rapid visual processing. A study by [12] showed that the relevant information for animal detection exists in simple image statistics that can be processed quickly and with moderate computational work (cost) without any need for image segmentation and re-current processing. According to this study, a certain amount of high spatial-frequency energy extracted over different orientations can be used to reach conclusions about the presence or absence of objects in natural scenes. In their study, they demonstrated that the statistical information which was contained in a small number of spectral principal com-ponents (roughly 16) was sufficient for a classifier to make approximately 80% correct animal classifications in natural scenes. This means that second-order statistics of images are closely linked with scene category and scene scale, and thus, this kind of information can enable people to perform fast and reliable
object and scene categorization. Therefore, statistical knowledge can be an es-sential resource for top-down processing and contextual priming. In other words, visual categorization may proceed based on low-level features without any need for grouping and segmentation processes. For this reason, simple kinds of im-age statistics extracted during early visual processing can be useful for detecting the presence or absence of a particular object, or for classifying a scene before exploiting higher-level visual processing resources.
The spatial frequency-based scene-gist experiments of [12] are not sufficient to demonstrate that different amounts of high-spatial frequency energy over different orientations are what people use to accurately classify scenes containing animals or not without any need for a thorough feature-based analysis. This is because their study lacked any psychophysical assessment of human classification accuracy pertaining to animals. For instance, [13] suggested that motion segmentation can be influenced by the amount of high-spatial frequency information. Even though high-spatial frequency information is a cue for motion segmentation, it has been revealed that human observers do not use this kind of information for visual motion perception. Hence, the visual system does not have to use this type of information, even though there is an obvious difference in terms of image statistics. For this reason, it is necessary to verify the spatial frequency-based scene-gist hypothesis with the help of psychophysiological evidence.
Further assessment of the spatial frequency-based scene-gist hypothesis using animal detection in natural scenes was tested in a study using psychophysiological measures [14]. In this study, they tested whether human observers take advantage of power spectra differences when rapidly categorizing natural scenes as contain-ing an animal or not. Durcontain-ing the experiment, participants were presented with animal and no-animal images from the Corel Stock Photo Library. The images used in the experiment were equated in terms of their power spectra. If human observer’s success rates depend on the power spectra, then the stimulus presenta-tion time period which is required for accurate classificapresenta-tion would change for the original images and images which have equal power spectra. According to the re-sults, the stimulus presentation time required for correct animal detection was not significantly different between original and spectrum-equalized images. Although
participants’ performance was better for spectrum-equalized images compared to original images for longer stimulus presentation times, this difference does not imply that the spatial-frequency content plays a significant role. In fact, if [12]’s hypothesis was correct, one would have expected the opposite pattern of results (i.e., that performance would be better with the original images than the energy-normalized images). Therefore, the findings of this study refute the hypothesis of [12] in which they concluded that high-spatial frequency difference between animal and no-animal images facilitates rapid animal detection.
1.2.2
Role of Color
Although colour cues may provide essential information for image segmentation, the role of colour in human vision is still controversial. There are some studies which suggest that colour differences and colour contours may be important for object recognition. For instance, [15] asked participants to name fruits and veg-etables that they presented. While half of the images were colourful, the rest of them were black and white. They assessed participants’ reaction time difference for these images. The findings showed that participants could name colourful im-ages faster than black and white imim-ages. In a more recent study, it was concluded that colour is effective for object recognition [16]. In this study, the reaction time difference between coloured and achromatic images was compared. The results indicated that reaction times for coloured images were reduced relative to those for achromatic images.
Moreover, a body of literature suggests that colour diagnosticity is critical for object and scene recognition. One of the studies, in which a fast identifica-tion task was used, investigated whether colour was effective in real-world scene recognition [17]. In the study, 160 coloured images of scenes drawn from the Corel CD Photo library were used. There were four types of colour-diagnostic scene categories which were canyon, coastline, desert and forest and four types of colour-nondiagnostic scene categories which were road, city, room and shopping area. There were 20 images from each category. The images were similar in their
luminance. During the experiment, three different forms of scenes were used. These were normally coloured, luminance only, and abnormally coloured scenes. In the normally coloured scenes, the original pictures were used. In the lumi-nance only scenes, colour components were removed. In the abnormally coloured scenes, the original colours of the normally coloured scenes were transformed, for example, red-green pixels were substituted with blue-yellow pixels. The ex-periment consisted of 160 normally coloured scenes, 160 luminance only scenes and 160 abnormally coloured scenes. Participants were presented with images for 120 msec. Participants were asked to verbally name the category of each image from the eight categories that they had been given at the beginning of the experiment as accurately and as quickly possible. The results indicated that colour cues have an impact on recognition when it is diagnostic of a particular category. Participants were faster at making a decision about an item’s category when colour cues were present. However, the enhancement of speed was valid only for congruent colours. In other words, colour differences had no significant effect on the recognition of colour-nondiagnostic scenes but they have an effect for colour-diagnostic scenes. In addition, neurophysiological studies also support the effectiveness of diagnostic colours in scene categorization. It is found that the latency of differential activation in Inferior Temporal Cortex (IT) is related to colour diagnosticity [18]. Furthermore, colour diagnosticity is also important for object recognition. According to the results, participants were quicker in recog-nizing colourful version of high colour diagnostic objects compared to achromatic versions or incongruent colourful versions [19]. These results were observed in classification, naming and verification experiments. Thus, colour may be a useful cue for object recognition.
On the other hand, a study conducted by [20] suggests that colour differences are not effective for either object naming or object verification tasks. In their study, participants were presented colour photographs or black and white (BW) drawings. According to the results, participants’ performance was not influenced by the removal of colour from the photographs or BW drawings. In addition to this study, a few other studies suggested that colour vision is only important to a certain extent. For example, [21] demonstrated that colour cues are not
informative for the initial processing of natural scenes. Consistently, it is found that colour cues can help participants at longer timescales when they are given a detection task that is attentionally demanding [22]. Moreover, a study by [23] showed that rapid natural scene categorization does not require colour informa-tion. In short, there are inconsistent findings regarding the utility of color cues object and scene recognition.
1.2.3
Role of Luminance
A large body of psychophysical literature suggests that luminance cues help peo-ple to recognize scenes [24, 25]. Luminance differences can be quite important for the recognition of scenes since they provide diagnostic information. Image con-trast in particular, can make the items in images more or less discernable. Visual illusions such as simultaneous contrast or the Hermann grid demonstrate how contrast might be crucial for our percepts of the external world. For instance, the Hermann grid is an optical illusion which consists of many black squares sur-rounded by white areas [26]. When individuals look at this pattern, they see gray circles at each intersection. Even though there are only black and white colours, the high contrast difference between the black and white areas results in the illusory effect. Another example demonstrating contrast’s importance can be seen in the simultaneous brightness contrast illusion. In this illusion, there are two gray squares. These squares have exactly the same colour. The only difference is their background colour. The background color of one of the squares is lighter than the other. Specifically, one of the square’s background colour is blackish while the other one’s background is whitish. As a result, the square whose background is lighter appears darker. In this case, although these two squares are physically identical, the contrast difference causes them to appear to have different brightness levels [27]. Thus, the simultaneous brightness contrast illusion illustrates how differences in luminance can alter how people perceive the world. These visual illusions underlie the influence of luminance cues as we try to extract meaning from the external world.
Furthermore, the importance of contrast sensitivity (i.e. sensitivity to local differences in luminance) was attested to in flight simulations. In one study, the link between complex visual tasks and the contrast sensitivity function was examined [28]. Before the experimental manipulation started, the participants’ visual acuity was measured. In order to assess their contrast sensitivity functions, the participants were presented with vertical gratings on a video display. Each trial began with a grating having a random sub-threshold contrast. The contrast of the grating was incremented gradually, and the observers pressed a button at the point where the contrast was just barely detectable. In order to assess participants’ performance in complex visual tasks, an air-to ground detection task was used. This task was administered using two panoramic video-based flight simulators. The correlation between participants’ visual detection performance and contrast sensitivity revealed that contrast sensitivity was predictive of air-to ground target detection. Visual acuity, on the other hand, did not predict the participants’ air-to-ground target detection. These findings indicate the critical role of contrast sensitivity in visual detection.
1.2.4
Role of Texture
Texture cues can be quite important for our percepts of the world. If we look in our environment, we can see that all of the surfaces have a certain type of texture, whether they be glossy and uniform, or patchy and matt, stippled or smooth, each surface has its own texture.
The reasons why texture cues are useful in object and scene recognition might originate from their function of providing information for visual segmentation. For instance, pure luminance information in natural images is moderately corre-lated with texture information. Therefore, it is possible that texture cues provide additional visual segmentation information [29]. The second reason why texture is useful might be due to the holistic nature of this cue. Being a holistic cue means that texture can be processed over the entire visual field, and processing
texture does not require attention for local feature analysis. Since texture fea-tures can be processed in a very short amount of time and also in parallel over the entire visual field, it can be concluded that texture is holistic in a similar way that colour is holistic [17, 30, 31]. For these reasons, texture cues are diagnostic for object detection and scene recognition.
Furthermore, the role of texture cues in scene classification was assessed in a study by [32]. In the study, participants were presented with images consisting of different kinds of scenes such as beaches, mountains, forests, cities, farms, streets, bathrooms, bedrooms, kitchens and livingrooms. The participants had limited time to respond and they did not view the images for a second time. The results from human subjects showed that the human visual system can identify the gist of a scene very quickly. The authors showed that an algorithm that picked out “universal textons” and used them for scene classification reached comparable per-formance to the human observers under rapid scene viewing conditions. In other words, the similar performance between humans and computer vision algorithms indicates that texture cues are sufficient for scene classification.
1.2.5
Role of Shape
In the context of object recognition, the recognition-by-components theory im-plies that shape cues are important. According to the recognition-by-components theory, there are 36 geons such as cylinders, rectangles and circles. In order to create the objects that people see in everyday life, these geons are combined. As one may imagine, an infinite number of objects can be created by combin-ing different kinds of geons. People are able to recognize objects by separatcombin-ing those objects into their geons [33]. Thus, there are two fundamental implications of recognition-by components theory. Firstly, edges plays a significant role for object recognition since they provide information about the object independent from its viewing position. Secondly, concavities play an important role in object recognition because they are often places where two edges intersect. Therefore, concavities provide information about the separation among geons.
Considering the fact that edges and concavities are crucial for us to perceive our external world, the significance of shape cues on object recognition cannot be denied. In fact, [20] demonstrated the necessity of shape cues. In this study, participants were presented with either fully coloured photographs or simple line drawings. Hence, in the simplified line drawings condition, all visual cues except shape were removed. In other words, simple line drawings lacked colour, lumi-nance and texture cues. In the experiments, participants were asked to either name or verify the item they had viewed. According to the results, there were no significant differences in reaction times or error rates between the two conditions. In other words, participants were able to identify simple line drawings as quickly and accurately as detailed, coloured and textured images of the identical object. This means that rather than surface characteristics such as colour, luminance or texture, edge-based information is the mediator of object recognition processes.
[34] compared different cues to examine their utility for an animal/no animal classification task. They investigated the roles of four visual cues: shape, lumi-nance, texture and colour. During the experiment, participants were presented with coloured images from the Corel image database. Each image included at least one noticeable object. Participants were instructed to indicate whether the image that they had viewed contained an animal or not. Participants indicated their responses by pressing buttons on the computer keyboard. Their results in-dicated that colour and luminance cues had a minor influence on detection and that shape and texture cues were most useful. Indeed, the shape cue was found to be most relevant for rapid animal detection since it required a shorter time period for people to make their decision compared to the texture cue. These find-ings show that some visual cues are more effective than others for rapid animal detection.
1.3
The Present Study
Human observers can use different information for different types of tasks. While discrimination of darker gray from lighter gray is based on luminance cue in-formation, discrimination of red from blue is based on colour cue information. As another example, observers with the best colour vision cannot discriminate between red and green apples in grayscale images because there is no colour in-formation in the images. One’s ability to make accurate discriminations depends on two main factors. Firstly, successful discrimination depends on the internal sensitivity of the detector to the external signals. For instance, a light detector that requires one photon of light in order to make a detection will be able to make more accurate light/no-light discriminations than a detector that requires two photons of light. Secondly, making a discrimination depends on how external signals are distributed in the world. If the above mentioned detectors are only tested with either zero or two photons of light, then both detectors will have the same measured sensitivity. This means that task-relevant information influences measured detection sensitivity.
Visual cues such as colour, luminance, shape and texture are all distributed differently in the natural world. The different patterns of visual cues within each image determine what we see in the images. In other words, diverse distribu-tions of visual cues can help people to make meaning of a particular scene. For this reason, quantifying which cues are most useful for scene recognition can be important in understanding the mechanisms underlying rapid scene classification.
Recent studies, including several that were mentioned above, have started to examine what kind of mechanisms help with rapid scene classification. This research field largely stemmed from the pioneering research of [4]. The findings of this study revealed that humans can accurately classify scenes when asked if the scene contained an animal or not. Indeed, humans were able to accomplish this task with 20 msec stimulus presentation time, and this task required only 150 msec of cortical processing. This short amount of time to detect an animal in a natural scene suggested that rapid animal detection is based on feed-forward
processing rather than feed-back processing. In other words, humans are able to perceive fundamental image features in a very short time frame, which in turn helps them to build up more complex visual representations [35, 36]. The question, then, is what kind of image features are being used, and which ones are most important for rapid scene classification?
Studies by [12, 32, 34] suggest that the list of relevant cues includes Fourier components, texture, colour, luminance, shape, and object outlines. Based on the studies in the literature, however, it is unclear which cues are most important for rapid object recognition and scene classification. The common theme of these studies is that there are certain cues from which visual system absorbs information for visual detection tasks. Consistent with this idea, they ranked the usefulness of cues in rapid visual detection with respect to observers’ performance regarding particular scene classes. However, the effect of task-relevant information on visual detection was not considered. The present study aims to fill the gap in the literature and examine the influence of task-relevant information on rapid scene classification.
In order to do this we followed the paradigm of [34]. In their study, they ad-ministered an animal detection task and concluded that shape and texture are the most effective cues for rapid scene classification, followed by colour, and lu-minance cues. It is unclear, however, whether this ranking holds true over all types of image classifications, or whether it is specific for animal/no animal clas-sifications. To answer this question, we extended their study by adding another type of task − a water/no water task. By having participants perform two dif-ferent tasks with the same images, we are able to examine the influence of task on the cue usefulness ranks. If cue effectiveness depends on the task, then we hypothesize that the cue usefulness rankings should be task-dependent. For ex-ample, while shape might be the most useful cue for helping people to categorize animals, colour cues might be relatively more useful for categorizing water. This is because animals generally take on a variety of colours, and so colour might not be discriminative for categorizing animals. On the other hand, water tends to be more restricted to shades of blue and green. Therefore, colour information is likely to be much more diagnostic for water than it is for animals. Conversely, it
could be the case that within the class of natural images, the different cues for making classification decisions have relatively consistent usefulness across tasks. This result would indicate a nice generality of results from one study to another, as long as they employ natural images.
Chapter 2
Method
2.1
Participants
Participants were recruited through electronic advertisements sent by university e-mail. Participants were undergraduate students (N=25) aged 18 − 30 years old (Mean = 21.72, S.E. = 0.46) and were native Turkish speakers. All participants had normal or corrected-to-normal vision as assessed by the Freiburg Visual Acu-ity Test [37]. Participants were told that they could quit the experiment at any time they wished. Informed consent was obtained from all participants before their participation and at the end of the study they were remunerated for partic-ipation with 20 Turkish Liras (≈ $5 USD). This study was approved by Bilkent University Ethics Committee.
For our experiments, based on the results of [34] we estimated that the observed effect size for the effect of the different cues would be somewhere on the range of Cohen’s f = 0.42. Based on this effect size, we used G*Power to determine that the necessary sample size to detect an effect of cue type with 95% power was 15 (Figure 2.1).
Figure 2.1: Sample size versus power for an effect size of f = 0.42.
To be conservative, and to more closely replicate [34] (2009), who used 24 participants, we opted to use 25 participants.
2.2
Apparatus and Stimuli
Stimuli were presented on a Dell XPS 8700, with an Intel Core i7-4790 processor and an NVIDIA GeForce GTX 745 4GB DDR3 graphics card driving a Dell 22 – S2240L 54.5cm monitor and an HP D2828A 15’ CRT monitor. Experiments were scripted in Matlab R 2016b using sub-routines from the Psychophysics toolbox
[38, 39].
All images were presented at the screen’s center against a gray background. The images were taken from the Berkeley Segmentation Dataset [40]. This dataset includes 12000 hand-labeled segmentations of 1000 Corel dataset images, which
were collected from 30 different people. Therefore, this database provides mentations produced by human participants for each image. With regard to seg-mentation instructions, participants were asked to divide each image into pieces representing equal importance of distinguished things. While half of the segmen-tations were acquired by presenting coloured images, the other half of the images were acquired by presenting grayscale image. From this dataset, 300 grayscale and colour segmentations were made publicly available. We have selected our test images from the coloured Corel images. From the database, four different set of images were selected. The first set of images contained no animals and no water (N=20). The second set of images included animals but no water (N=20). The third set of images contained water but no animals (N=20). Lastly, the fourth set of images consisted of animals and water (N=20). Therefore, there were 80 images selected in total.
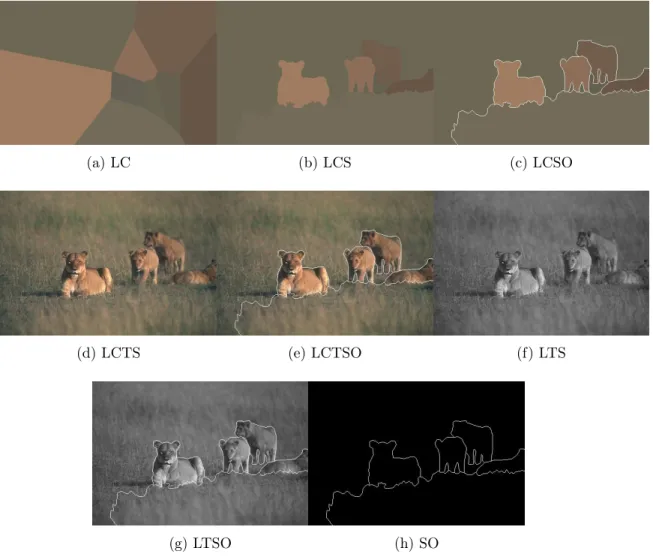
We used the segmented images that we had selected to create stimuli in which visual cues such as colour (C), luminance (L), shape (S), texture (T), and ob-ject outlines (O) were independently manipulated. In this way, we were able to separately assess the contribution of each of these visual cues to class discrim-inations. The methodology in the [34] paper was followed while manipulating the visual cues. There were eight different conditions in which different visual cues were presented (LC, LCS, LCSO, LCTS, LCTSO, LTS, LTSO, SO). Hence, our independent variables were the different cue conditions and the task (ani-mal/no animal, or water/no water), while our dependent variable was detection sensitivity and reaction time.
(a) LC (b) LCS (c) LCSO
(d) LCTS (e) LCTSO (f) LTS
(g) LTSO (h) SO
Figure 2.2: Examples of images containing water: LC, LCS, LCSO, LCTS, LCTSO, LTS, LTSO, SO respectively.
(a) LC (b) LCS (c) LCSO
(d) LCTS (e) LCTSO (f) LTS
(g) LTSO (h) SO
Figure 2.3: Examples of images containing animals: LC, LCS, LCSO, LCTS, LCTSO, LTS, LTSO, SO respectively.
2.3
Procedure
Participants were individually tested. In order to reduce any visual distractions, the only light source in the room was the computer screen. Participants placed their chins on a head-chin rest which was 55 cm away from the computer screen to maintain a stable viewing distance.
Freiburg Visual Acuity Test to confirm they had normal vision. This test uses a Landolt C task with an adaptive staircase to measure acuity. All individuals who participated in the experiment reached a visual acuity of at least 1.0. In addition, participants were also administered a colour blindness test to confirm that they have no colour vision deficiency.
After the visual acuity and colour blindness tests were over, the experimenter told the participants that they were going to view visual images and make judg-ments as to whether they have just seen an animal or not, in the case of the animal/no animal task, or if they have just seen water in the case of the wa-ter/no water task. The order of the two tasks was randomized across partici-pants. In total, there were two experimental conditions which were animal and water classification tasks. Between these two experimental conditions, there was a five minute break to give the participants some rest before the next session.
Participants were instructed to press “4” if they saw the target and press “6” if not. Participants were also told to make their responses as quickly and as accurately as possible. If participants gave incorrect responses, they received feedback in the form of a 250 msec, 400 Hz tone.
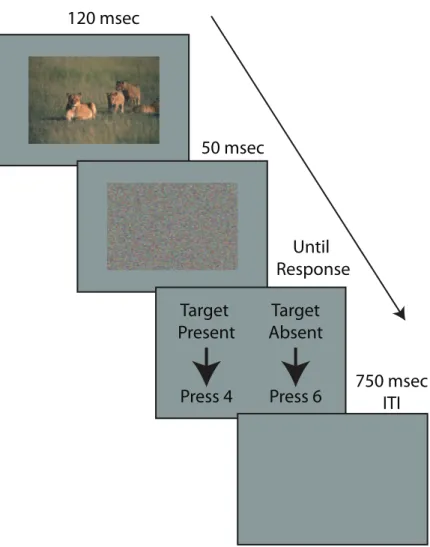
Each trial consisted of a test image (120 msec) and a mask image (50 msec). Immediately after the test image, there was a mask image where the pixels from the image for that trial were randomly re-arranged to disturb perceptual pro-cessing and limit test image availability to the exposure duration. The Intertrial Interval (ITI) was 0.75 msec.
120 msec Target Present Press 4 Target Absent Press 6 50 msec Until Response 750 msec ITI
Figure 2.4: Trial sequence for the animal classification task. The procedure was identical for the water classification task.
Chapter 3
Results
3.1
Signal Detection Theory
Signal detection theory provides a mathematical framework specifying how a sig-nal may be distinguished from noise [41]. The theory introduces two distributions. One of the distributions stems from the signal whereas the other one stems from the noise. For instance, in standard visual detection tasks, human observers are asked to make a decision as to whether or not they see a certain type of stimu-lus. This means that the observers are supposed to indicate whether the signal is present or not. However, making a decision becomes confusing with the presence of noise since the noise might be similar to the signal. Signal detection theory describes how we make decisions in the presence of uncertainty.
There are four possible outcomes depending on the observers’ response. The observers can indicate either that the signal is present or not. If the signal is actually present, then hits and misses are the possible outcomes. If the signal is absent, then correct rejections and false alarms are the possible outcomes. For instance, if the observers correctly guesses the signal’s presence, then their response is a hit. However, if they do not indicate that the signal is present when it is actually there, then their response is called miss. In addition, if there is no
signal and the observers say that there is one, then their response is called a false alarm. However, if they accurately decide that there is no signal, their response is called a correct rejection.
Table 3.1: Possible situations for different type of responses Signal
Present Absent
Subject’s decision Present Hit False Alarm Absent Miss Correct Rejection
The subject’s sensitivity is calculated using a dimensionless measure called d0. This sensitivity measure is not affected by the subject’s decision bias and it assumes that the standard deviations for the subject’s representations of the signal and the noise are equal. The sensitivity index or d0 compares the separation between the means of the signal and noise distributions to the standard deviations of the signal or noise distributions. Thus, the d0 value is defined as:
d0 = qµS− µN 1 2(σ 2 S+ σ2N) (3.1)
where µS, µN, σS and σN are means and standard deviations for normally
distributed signal and noise distributions. The d0 statistic can also be calculated using known values of hit and false alarm rates:
d0 = z(hits) − z(f alse alarms) (3.2)
where z(p), p ∈ [0, 1], is the inverse of the cumulative distribution function of the normal distribution and gives the z-score of the given probability. The d0 value is independent of the criterion line (or bias).
Figures 3.1 and 3.2 show examples where the d0 values are 2 and 1 respectively. The higher the difference between the z-scores for hits and false alarms on the
z-normalized distributions, the more readily detected the signal is (i.e. the error is smaller). The vertical blue line represents the criterion line. In the case of Figures 3.1 and 3.2, subjects rate the target as "Present" whenever the internal signal falls to the left of the criterion line and "Absent" when it falls on the right side of the criterion line, which remains same for both figures.
Figure 3.1: Comparison of signal and noise distributions for µS = 4 and µN = 6 in
units of standard deviations. Z-normalized distributions are shown in the bottom graph. The green and red regions are the hit and false alarm regions respectively. The blue lines mark the decision criterion – below this line the subject classifies the signal as target and above it they classify the signal as noise.
Figure 3.2: Comparison of signal and noise distributions for µS = 4 and µN = 5 in
units of standard deviations. Z-normalized distributions are shown in the bottom graph. Green and red regions as well as the blue criterion line denote the same things as in Figure 3.1. Note here that the distributions are closer together than they are in Figure 3.1, indicating a lower d0.
3.2
Statistical Results on Detection Sensitivity
A two-way repeated measures ANOVA was conducted to compare the ef-fects of cue and task type on classification accuracy (measured via d0). The first factor is cue type, and it has eight levels (colour, luminance-colour-shape, luminance-colour-shape-outline, luminance-colour-texture-shape, luminance-colour-texture-shape-outline, luminance-texture-shape, luminance-texture-shape-outline, shape-outline). The second factor is task type and it has two levels (animal/no animal, and water/no water).
Since Mauchly’s test of sphericity indicated significant violations of the spheric-ity assumption, we compensated by adopting the Greenhouse-Geisser correction for the degrees of freedom in all of our ANOVA’s.
Tests of within-subjects effects revealed that for the main effect of task, there was a significant effect on d0 (F (1, 24) = 5.325, M SE = 0.813, p = 0.030, η2
partial = 0.182, observed power = 0.60). Participants were significantly better
at the animal task than the water task. We also found a significant main effect of cue type (F (3.55, 85.13) = 110.026, M SE = 0.996, p < 0.01, η2partial = 0.821, observed power = 1.00). This indicates that at least one cue type yielded signif-icantly better sensitivity than the other cue types. There was also a significant interaction between task and cue type (F (3.79, 90.93) = 32.497, M SE = 0.883, p < 0.01, η2partial= 0.288, observed power = 0.99).
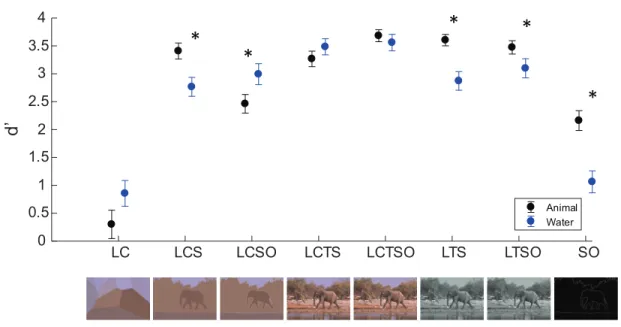
To understand the interaction, we conducted Sheffe post-hoc pairwise compar-isons. These revealed that participants were significantly more sensitive in the animal task than the water task for the LCS, LTS, LTSO and SO images, but that they were significantly more sensitive in the water task than the animal task for the LCSO images (all p < 0.05). No other comparisons reached significance.
LC LCS LCSO LCTS LCTSO LTS LTSO SO 0 0.5 1 1.5 2 2.5 3 3.5 4 d ’ Animal Water
*
*
*
*
*
Figure 3.3: Sensitivity (d0) as a function of cue type and task type. ∗’s indicate significant differences between the water and animal tasks (p < 0.05). Examples of images corresponding to the different cue types are shown below the data.
1 2 3 4 5 6 7 8
Animal Rank
1 2 3 4 5 6 7 8Water Rank
LC LCS LCSO LCTS LCTSO LTS LTSO SOFigure 3.4: Sensitivity ranks for the water task plotted against those for the animal task. If the ranks were the same for the two tasks, then all points would fall exactly on the diagonal. Here, it can clearly be seen that this is not the case.
3.3
Inferred Cue Sensitivities
It is difficult to measure sensitivity to individual cues. For the shape cue, for example, the best one can do is to present the shape with an outline alone and remove all colour, texture, and luminance information. This leaves the subject to make detection judgements based on only the shape and outline cues. Other image types use varying combinations of the cues. How can sensitivity to the individual cues be inferred based on the measured sensitivities for the various cue combinations? The answer comes from standard signal detection theory [42,
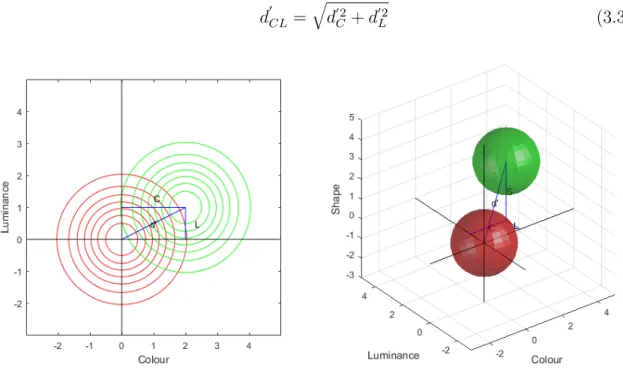
41]. Here, the signal and noise distributions under the different cues form multi-dimensional probability densities (Figure 3.5). Examination of the left panel of subplot in Figure 6 reveals that d0 for the joint distribution is related to the d0 scores for the marginal colour (C) and luminance (L) distributions. Joint d0 here may be calculated using the Pythagorean Theorem:
d0CL=qd02 C + d
02
L (3.3)
Figure 3.5: Signal detection theoretic multidimensional distributions of the cues. In both plots, iso-probability contours for the noise distributions are plotted in red, and the signal distributions are plotted in green. The diagonal blue lines connecting the means of the signal and noise distributions denotes sensitivity (d0). The straight blue lines projecting to the axes denote the marginal sensitivi-ties. Left: two-dimensional joint distributions for the luminance and colour cues. Right: three-dimensional joint distributions for the luminance, colour, and shape cues.
For the three dimensional joint distribution of colour, luminance, and shape, the calculation generalizes using the L2− norm:
d0CLS = q d02 C + d 02 L + d 02 S (3.4)
Thus, if we know d0CL and d0CLS then d0S may be calculated starting with:
d0CL2 = d0C2+ d0L2 (3.5) Substituting into the equation for d0CLS yields:
d0CLS = q d02 CL+ d 02 S (3.6)
Rearranging and solving for d0S yields:
d0S =qd02 CLS − d
02
CL (3.7)
Using these formulations, we are able to calculate the marginal d0 scores for each cue. For each subject, we applied Nelder-Mead unconstrained nonlinear minimization to find the least-squares set of marginal d0 scores that best fit the observed joint d0 scores when calculate as above.
Similar to the results of [34] we observed qualitative differences in sensitivity to the cues as a function of whether or not an outline was present. We subsequently followed their analysis and split our marginal sensitivity estimates as a function of whether or not an outline was present in the image. Results for both the animal and water tasks are presented in Figure 3.6.
C T L S
Cue
0 1 2 3 4Animal, No Outline
L C S TCue
0 1 2 34
Animal, With Outline
C L T S
Cue
0 1 2 3 4Water, No Outline
S C T LCue
0 1 2 34
Water, With Outline
S
e
n
si
ti
v
it
y
(
d
’)
S
e
n
si
ti
v
it
y
(
d
’)
S
e
n
si
ti
v
it
y
(
d
’)
S
e
n
si
ti
v
it
y
(
d
’)
*
*
*
*
*
*
*
*
*
*
*
*
*
*
*
*
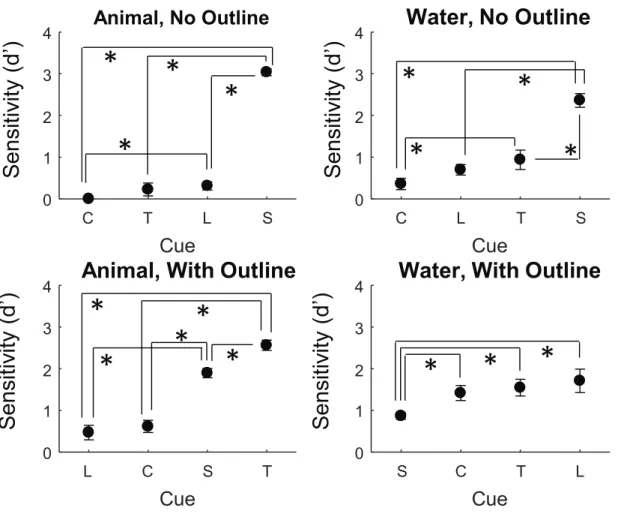
Figure 3.6: Mean marginal cue sensitivity (d0) as a function of cue type (C = colour, T = texture, L = Luminance, and S = shape). The left two subplots are for the animal/no animal task and the right two are for the water/no water task. The top two subplots are for the cases where the images had no outlines and the bottom two subplots are for the cases where the images had outlines. In each subplot, the cues are sorted in ascending order of sensitivity.
Asterisks (∗) indicate post-hoc pairwise comparisons that were found to be statistically significant (p < 0.05). Error bars denote ±1 S.E.M..
Here, again, it can be seen that the cue ranks vary as a function of task type, and also outline presence.
3.3.1
Results on Inferred Cue Statistics
For statistical analyses, the alpha level was set at .05.
A three-way repeated measures ANOVA was conducted to compare the effect of multiple levels of the three independent variables (cue type, task type, and outline presence) on the dependent variable (classification accuracy measured via d0).
Since Mauchly’s test of sphericity again indicated significant violations of the sphericity assumption, we compensated by adopting the Greenhouse-Geisser cor-rection for the degrees of freedom in all of our ANOVA’s.
We found no main effect of task on d0 (F (1, 24) = 3.271, M SE = 0.290, p > 0.05, η2
partial = 0.120, observed power = 0.412). However, we found a significant
main effect of cue type (F (3, 72) = 39.972, M SE = 0.165, p < 0.01, ηpartial2 = 0.625, observed power = 1.000). There was also a significant main effect of the outline’s presence or absence (F (1.000, 24) = 94.417, M SE = 0.1.607, p < 0.01, η2
partial = 0.797, observed power = 1.000). There was a significant interaction
between task and outline on d0 (F (1, 24) = 4.432, M SE = 0.216, p < 0.05, η2
partial = 0.156, observed power = 0.524). We found a significant interaction
between task and cue on d0 (F (1.391, 33.385) = 18.880, M SE = 1.625, p < 0.01, ηpartial2 = 0.440, observed power = 0.998). There was also a significant interaction between outline and cue on d0 (F (2.064, 49.529) = 74.264, M SE = 0.706, p < 0.01, η2
partial = 0.756, observed power = 1.000). Also, we found a three-way
interaction between task, outline and cue type on d0 (F (2.504, 60.098) = 13.293, M SE = 0.728, p < 0.01, η2
partial= 0.356, observed power = 0.999).
Since there was a 3-way significant interaction, we looked at the Sheffe post-hoc pairwise comparisons for the individual cue types as a function of task and outline presence. For the animal detection task without outlines, there was a significant difference between shape and colour, shape and luminance, luminance and colour, and texture and shape (all p < 0.01). For the animal detection task with outlines, there was a significant difference between shape and colour, shape
and texture, luminance and shape, luminance and texture, and colour and texture (all p < 0.01).
For the water detection task without outlines, there was a significant difference between shape and colour, shape and texture, shape and luminance, and colour and texture (all p < 0.01). Finally, for the water detection task with outlines, there was a significant difference between shape and colour, shape and texture, and shape and luminance (all p < 0.01).
3.4
Statistical Results on Reaction Time
A two-way repeated measures ANOVA was conducted to compare the effects of cue type and task type on reaction time. Since the significance values in the Mauchly’s Test of Sphericity table are smaller than 0.05, the spherecity assump-tion has again been violated. For this reason, we again applied the Greenhouse-Geisser correction.
Tests of within-subjects effects revealed a main effect of task on reaction time (F (1, 24) = 4.333, M SE = 0.027, p < 0.05, η2partial = 0.410, observed power = 1.000) where water was detected faster than animals; and a main effect of cue type on reaction time (F (3.12, 74.80) = 16.65, M SE = 0.016, p = 1.38 × 10⁻¹⁶, η2
partial = 0.41, observed power = 1). There was also a significant interaction
between task and cue type on reaction time (F (4.06, 97.42) = 4.059, M SE = 0.813, p < 0.009, ηpartial2 = 0.146, observed power = 0.907).
In order to understand the interaction, Sheffe post-hoc pairwise comparisons were conducted again. These indicated faster reaction times for the water task than the animal task for the LC, LSCO, LCTS and LCTSO cues (all p < 0.05). No other comparisons reached statistical significance.
In comparing the reaction time data with the d0 data, we note that faster reaction times are generally associated with higher sensitivity.
*
*
*
*
LC LCS LCSO LCTS LCTSO LTS LTSO SO 0.45 0.5 0.55 0.6 0.65 Animal Water
M
e
an
R
T
(
se
c.
)
Figure 3.7: Reaction time plotted as a function of cue type and task.
The results were the same after outlier rejection, except that there was no significant difference between the animal and water reaction times for the LCTSO cue.
LC LCS LCSO LCTS LCTSO LTS LTSO SO
0.45 0.5 0.55 0.6 0.65 M e a n R T (se c .) Animal Water
*
*
*
Figure 3.8: Reaction time without outliers plotted as a function of cue type and task.
Chapter 4
Discussion
The aim of the current study was to examine the effect of task on cue usefulness. Previous research has revealed several useful cues for object and scene classifica-tion [32, 12, 34] even ranked these cues, but no study has yet shown whether or not the type of classification task influences these cue ranks. In [34]’s animal/no animal task, for example, shape and texture were found to be the most useful cues, but the question remained as to whether these cues are universally more useful, or whether the cues’ usefulness depends on the specific classifications be-ing made. In our study, we tested the hypothesis that different cues are more or less relevant for different tasks.
In order to directly test our hypothesis, we had participants use the same images to make two different kinds of target classifications (animal or water). We conducted the animal/no animal task to replicate [34], and we added in the water/no water task reasoning that for water, cues like colour were likely to be more diagnostic, since water tends to fall into a more limited colour range than animals. In this way, we were able to explore whether cue usefulness depends on task type.
Our results demonstrate that there is an effect of task type on cue usefulness. If the task type had no impact on cue usefulness, then we would have expected
to see a perfectly linear relationship between the cue ranks for the animal and water tasks in Figure 3.4, and no differences in the orders of the cues in the different sub-plots of Figure 3.6. However, the cue ranks are scattered in the graph of Figure 3.4, and the individual cues vary in the order of their diagnostic sensitivity in Figure 3.6, indicating task-dependent differences. This implies that cue effectiveness depends on the task type and that people use different cues for different tasks. Our findings can be explained by a model which combines feedback, feedforward and recurrent processes. A body of evidence from a recent study by Wyatte suggests that in the course of a visual recognition task, recurrent visual processing can originate in striate and extrastriate cortex around 100 msec after stimulus was presented [43]. In our experiment, we used exact same images across two tasks. Thus, input was same for both animal and water detection task. If only feedforward mechanisms are responsible for visual detection, then we would expect to observe same performance for both tasks. However, different types of cues were useful depending on the tasks. Hence, this can be interpreted that feedback mechanisms were also active.
The findings of our study reveal that there is a significant difference in terms of detection sensitivity for several of the cues across cue conditions. Participants were more accurate while doing animal detection task in LCS, LTS, LTSO and SO conditions. However, they were more accurate with the water detection task in the LCSO condition. These results indicate that the shape cue is highly useful for the animal detection task. Participants tended to be more successful in the conditions in which the shape cue was not removed from the images. For the water task, the most important cues included both shape and colour cues. Arguably, the conditions which best isolate the colour and shape cues respectively, are the LC (luminance, and colour) and SO (shape and outline) conditions. Examining the pattern of sensitivity for these two conditions in Figure 3.3 shows a reversal of the pattern of cue usefulness for these two tasks, where for the LC cue, the water task had a higher d0 than the animal task, but for the SO condition the animal task yielded higher sensitivity than the water task (although only the latter comparison reached statistical significance). Several other cue condition showed similar reversals, which is what lead to the scattered pattern of ranks in
Figure 3.3.
The findings from our study are likely to be influenced by the participant’s past experiences at object and scene classification. In our study, we found that the usefulness of cues depends on the task. If cue usefulness is related with the task type, then how do people learn to use relevant cues? The effect of task-relevant information can be gained from prior experiences which people acquired through associations [44]. Thus, neural mechanisms about prior experiences and associations can be responsible for learning which cues are most useful for different types of tasks. Indeed, a study by Olshausen and Field (1996) showed that the relevant cue distributions are learned implicitly based on exposure to natural images [45].
In signal detection tasks, there is often a trade-off between speed and accuracy. In the current results, we found that in all cases, when sensitivity was higher for the animal task, reaction times were also faster for the animal task and simi-larly for the water task (except for LTSO). Moreover, overall reaction times were faster for the water task than the animal task, even in cases where there were no significant differences in d0. This is likely because colour is highly diagnostic for images containing water, and consistent with the results of [34], colour cues are processed and available for decision making earlier on than the shape, texture, and luminance cues.
Our results illustrate the key importance of the task for cue usefulness. Pre-vious studies, such as that by [17], showed similar results, but in their case, they showed that colour was a useful cue for some types of image classification, but not for others. For example, they found that colour was useful for discriminating canyons, forests, seashores, and deserts, but not for discriminating cities, shops, roads, and rooms. Our results add to this discussion showing that the relative usefulness of all tested cues varies depending on the target object or scene.
The prior literature examining the rankings of various cues for classification accuracy was working largely under the implicit assumption that the utility of