© Central Fisheries Research Institute (CFRI) Trabzon, Turkey and Japan International Cooperation Agency (JICA)
Conversions of Total, Fork and Standard Length Measurements Based on
42 Marine and Freshwater Fish Species (from Turkish Waters)
Introduction
A variety of morphological, physiological,
behavioral and biochemical characteristics are used to
identify and classify fishes. In practice though, it is
more common to use morphometric measurements
(i.e., body length, body depth, head length, eye
diameter, jaw length) and meristics (i.e., fin ray, scale,
teeth, gill raker, and lateral line pore counts). These
morphometric measurements are usually presented as
a proportion of standard, fork and total length (Howe,
2002). As many scientists have been using these
different length measurements of fish species, a lack
of standardized methods has hampered attempts to
synthesize the data (Echeverria and Lenarz, 1984). It
is very important especially in comparative studies
which little information seems to be available for fish
species (Froese and Pauly, 2005). The purpose of the
present study is to contribute to the knowledge of the
length - length relationships of some freshwater,
estuarine and marine fish species. To provide the
means to convert one of these length measurements to
another, it is reported here the linear regression
statistics necessary for conversions in 42 fish species.
Material and Methods
Samples were collected from various localities
(Figure 1) by using different fishing gears (Table 1).
Specimens were preserved in %5 solution of
formaldehyde and then identified. Length
measurements were taken to the nearest millimeter in
a straight line via meter board. Standard length was
measured from the anterior tip of the upper jaw to the
tip of the hypural bone (urostyle). Fork length was
measured from the anterior tip of the longest jaw to
the median point of the caudal fin and the total length
was measured from the anterior tip of the longest jaw
to the most posterior part of the tail (Laevastu, 1965).
Conversions among length measurements can
generally be accomplished with simple linear
regressions models. Therefore, length-length
relationships were determined by the method of least
squares to fit a simple linear regression model. Linear
regressions were run on all combinations of the length
measurements. The following relationships were
established using linear regression analysis; (a) TL vs.
FL; (b) TL vs. SL; (c) FL vs. SL.
The significance of the regression was assessed
by analysis of variance (ANOVA) testing the
hypothesis Ho:
ȕ = 0 against H
A:ȕ 0 (Zar, 1999).
We used analysis of covariance (ANCOVA) to test
between- locality differences of the slopes of the
length - length relationships (Zar, 1999).
Results and Discussion
The species, the taxonomic authority (Froese
and Pauly, 2005), sample size (n), size range (cm,
TL-FL-SL), parameters of length - length relationships (a
and b), the standard error (SE) and the correlation
coefficient (r
2) are given in Tables 2, 3 and 4.
During the course of the study, 6259 individuals
from 42 fish species representing 19 families were
captured. Among them, the members of the
Cyprinidae were the most abundant with the value of
43%. The sample size ranged from 10 for N.
melanostomus and P. marmoratus to 683 for C.
gibelio.
The length – length linear regressions were all
highly significant (P<0.001) with all r
2values being >
0.90. The high values of r
2indicate that the length
relationships are linear over the observed range of
values.
Abstract
Relationships between total (TL), fork (FL) and standard (SL) lengths belonging 19 families from Aegean and
Marmara coast of Turkey were presented for 42 fish species. The relationships between TL, FL and SL were all linear and
they were all highly significant (P<0.001) with all r
2values being >0.90. There were significant differences in the slope of
length – length relationships between some localities and type of length conversions for the fish species.
Key Words: Standard length; Fork length, Total length, length-length relationships.
Özcan Gaygusuz
1, Çi÷dem Gürsoy
2, Müfit Özulu÷
3, Ali Serhan Tarkan
1,*, Hasan Acıpınar
4,
Gökçen Bilge
5, Halit Filiz
61
østanbul University, Faculty of Fisheries, Ordu Cad. No: 200, 34470 Laleli, østanbul, Turkey.
2
Çanakkale Onsekiz Mart University, Natural and Applied Sciences Institute, 17100, Çanakkale, Turkey.
3
østanbul University, Faculty of Applied Science, Department of Biology, 34134, Vezneciler, østanbul, Turkey.
4
østanbul University, Natural and Applied Sciences Institute, 34850, Avcılar, østanbul, Turkey.
5
Mu
÷la University, Faculty of Fisheries, 48000, Kötekli, Mu÷la, Turkey.
6
Faculty of Fisheries, Ege University, Bornova, øzmir, Turkey.
* Corresponding Author: Tel.: +90. 212 4555700/16419; Fax: +90. 212 5140379; E-mail: [email protected]; [email protected]
Received 31 August 2005 Accepted 24 April 2006
80
Figure 1. Map of the study sites.
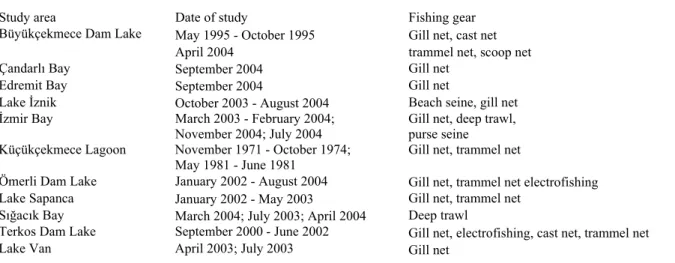
Table 1. Localities, dates and fishing gears of the fish species caught from Aegean and Marmara coast of Turkey
Study area
Date of study
Fishing gear
May 1995 - October 1995
Gill net, cast net
Büyükçekmece Dam Lake
April 2004
trammel net, scoop net
Çandarlı Bay
September 2004
Gill net
Edremit Bay
September 2004
Gill net
Lake
øznik
October 2003 - August 2004
Beach seine, gill net
øzmir Bay
March 2003 - February 2004;
November 2004; July 2004
Gill net, deep trawl,
purse seine
Küçükçekmece Lagoon
November 1971 - October 1974;
May 1981 - June 1981
Gill net, trammel net
Ömerli Dam Lake
January 2002 - August 2004
Gill net, trammel net electrofishing
Lake Sapanca
January 2002 - May 2003
Gill net, trammel net
Sı÷acık Bay
March 2004; July 2003; April 2004
Deep trawl
Terkos Dam Lake
September 2000 - June 2002
Gill net, electrofishing, cast net, trammel net
Lake Van
April 2003; July 2003
Gill net
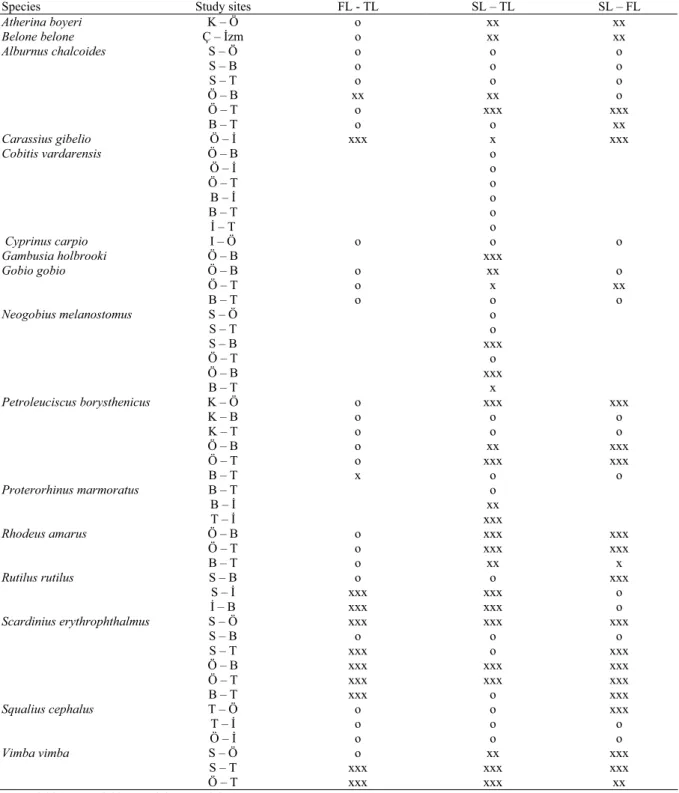
Analysis of covariance (ANCOVA) revealed
significant differences in the slope of length – length
relationships between some localities and type of
length conversions for the fish species (Table 5). A
number of factors might affect the proportion of
standard, fork and total length of fish including
growth phase, food availability and quality, size
range, health and general fish condition and
preservation techniques. The observed difference
could also be due to the sampling procedure, namely
sample size and length range. However, the sample of
the most studied fish was relatively large and covered
a reasonable size range, suggesting in slope could
reflect the influence of differences in environmental
or habitat factors. Hence, a further study about the
effect of these factors on the length – length
relationships in different places need to be conducted.
The equations for derivation of the different
lengths measurements of 42 fish species presented
above may enable researchers to gain helpful
information about length conversions especially when
the relevant equations are not suitable to establish for
rare species in a specific locality.
N
AEGEA
SEA
Hm Edrernit İunirBLACK SEA
~-Gemlik ~ -LakeJznik 5km81
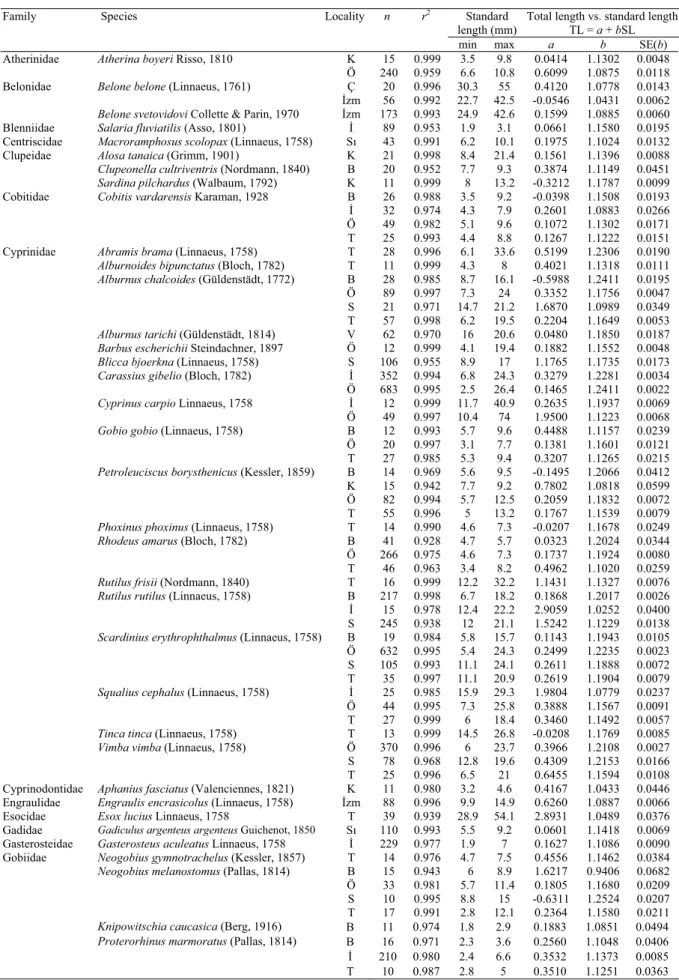
Table 2. Results of linear regressions of total length versus standard length for the fish species caught from several Turkish
waters
Family Species Locality n r2 Standard
length (mm)
Total length vs. standard length TL = a + bSL
min max a b SE(b)
Atherinidae Atherina boyeri Risso, 1810 K 15 0.999 3.5 9.8 0.0414 1.1302 0.0048 Ö 240 0.959 6.6 10.8 0.6099 1.0875 0.0118 Belonidae Belone belone (Linnaeus, 1761) Ç 20 0.996 30.3 55 0.4120 1.0778 0.0143
øzm 56 0.992 22.7 42.5 -0.0546 1.0431 0.0062
Belone svetovidovi Collette & Parin, 1970 øzm 173 0.993 24.9 42.6 0.1599 1.0885 0.0060
Blenniidae Salaria fluviatilis (Asso, 1801) ø 89 0.953 1.9 3.1 0.0661 1.1580 0.0195 Centriscidae Macroramphosus scolopax (Linnaeus, 1758) Sı 43 0.991 6.2 10.1 0.1975 1.1024 0.0132 Clupeidae Alosa tanaica (Grimm, 1901) K 21 0.998 8.4 21.4 0.1561 1.1396 0.0088
Clupeonella cultriventris (Nordmann, 1840) B 20 0.952 7.7 9.3 0.3874 1.1149 0.0451
Sardina pilchardus (Walbaum, 1792) K 11 0.999 8 13.2 -0.3212 1.1787 0.0099
Cobitidae Cobitis vardarensis Karaman, 1928 B 26 0.988 3.5 9.2 -0.0398 1.1508 0.0193 ø 32 0.974 4.3 7.9 0.2601 1.0883 0.0266
Ö 49 0.982 5.1 9.6 0.1072 1.1302 0.0171
T 25 0.993 4.4 8.8 0.1267 1.1222 0.0151 Cyprinidae Abramis brama (Linnaeus, 1758) T 28 0.996 6.1 33.6 0.5199 1.2306 0.0190
Alburnoides bipunctatus (Bloch, 1782) T 11 0.999 4.3 8 0.4021 1.1318 0.0111
Alburnus chalcoides (Güldenstädt, 1772) B 28 0.985 8.7 16.1 -0.5988 1.2411 0.0195
Ö 89 0.997 7.3 24 0.3352 1.1756 0.0047
S 21 0.971 14.7 21.2 1.6870 1.0989 0.0349
T 57 0.998 6.2 19.5 0.2204 1.1649 0.0053
Alburnus tarichi (Güldenstädt, 1814) V 62 0.970 16 20.6 0.0480 1.1850 0.0187
Barbus escherichii Steindachner, 1897 Ö 12 0.999 4.1 19.4 0.1882 1.1552 0.0048
Blicca bjoerkna (Linnaeus, 1758) S 106 0.955 8.9 17 1.1765 1.1735 0.0173
Carassius gibelio (Bloch, 1782) ø 352 0.994 6.8 24.3 0.3279 1.2281 0.0034
Ö 683 0.995 2.5 26.4 0.1465 1.2411 0.0022
Cyprinus carpio Linnaeus, 1758 ø 12 0.999 11.7 40.9 0.2635 1.1937 0.0069
Ö 49 0.997 10.4 74 1.9500 1.1223 0.0068
Gobio gobio (Linnaeus, 1758) B 12 0.993 5.7 9.6 0.4488 1.1157 0.0239
Ö 20 0.997 3.1 7.7 0.1381 1.1601 0.0121
T 27 0.985 5.3 9.4 0.3207 1.1265 0.0215
Petroleuciscus borysthenicus (Kessler, 1859) B 14 0.969 5.6 9.5 -0.1495 1.2066 0.0412
K 15 0.942 7.7 9.2 0.7802 1.0818 0.0599
Ö 82 0.994 5.7 12.5 0.2059 1.1832 0.0072
T 55 0.996 5 13.2 0.1767 1.1539 0.0079
Phoxinus phoxinus (Linnaeus, 1758) T 14 0.990 4.6 7.3 -0.0207 1.1678 0.0249
Rhodeus amarus (Bloch, 1782) B 41 0.928 4.7 5.7 0.0323 1.2024 0.0344
Ö 266 0.975 4.6 7.3 0.1737 1.1924 0.0080
T 46 0.963 3.4 8.2 0.4962 1.1020 0.0259
Rutilus frisii (Nordmann, 1840) T 16 0.999 12.2 32.2 1.1431 1.1327 0.0076
Rutilus rutilus (Linnaeus, 1758) B 217 0.998 6.7 18.2 0.1868 1.2017 0.0026
ø 15 0.978 12.4 22.2 2.9059 1.0252 0.0400
S 245 0.938 12 21.1 1.5242 1.1229 0.0138
Scardinius erythrophthalmus (Linnaeus, 1758) B 19 0.984 5.8 15.7 0.1143 1.1943 0.0105
Ö 632 0.995 5.4 24.3 0.2499 1.2235 0.0023
S 105 0.993 11.1 24.1 0.2611 1.1888 0.0072
T 35 0.997 11.1 20.9 0.2619 1.1904 0.0079
Squalius cephalus (Linnaeus, 1758) ø 25 0.985 15.9 29.3 1.9804 1.0779 0.0237
Ö 44 0.995 7.3 25.8 0.3888 1.1567 0.0091
T 27 0.999 6 18.4 0.3460 1.1492 0.0057
Tinca tinca (Linnaeus, 1758) T 13 0.999 14.5 26.8 -0.0208 1.1769 0.0085
Vimba vimba (Linnaeus, 1758) Ö 370 0.996 6 23.7 0.3966 1.2108 0.0027
S 78 0.968 12.8 19.6 0.4309 1.2153 0.0166
T 25 0.996 6.5 21 0.6455 1.1594 0.0108
Cyprinodontidae Aphanius fasciatus (Valenciennes, 1821) K 11 0.980 3.2 4.6 0.4167 1.0433 0.0446 Engraulidae Engraulis encrasicolus (Linnaeus, 1758) øzm 88 0.996 9.9 14.9 0.6260 1.0887 0.0066 Esocidae Esox lucius Linnaeus, 1758 T 39 0.939 28.9 54.1 2.8931 1.0489 0.0376 Gadidae Gadiculus argenteus argenteus Guichenot, 1850 Sı 110 0.993 5.5 9.2 0.0601 1.1418 0.0069 Gasterosteidae Gasterosteus aculeatus Linnaeus, 1758 ø 229 0.977 1.9 7 0.1627 1.1086 0.0090 Gobiidae Neogobius gymnotrachelus (Kessler, 1857) T 14 0.976 4.7 7.5 0.4556 1.1462 0.0384
Neogobius melanostomus (Pallas, 1814) B 15 0.943 6 8.9 1.6217 0.9406 0.0682
Ö 33 0.981 5.7 11.4 0.1805 1.1680 0.0209 S 10 0.995 8.8 15 -0.6311 1.2524 0.0207 T 17 0.991 2.8 12.1 0.2364 1.1580 0.0211
Knipowitschia caucasica (Berg, 1916) B 11 0.974 1.8 2.9 0.1883 1.0851 0.0494
Proterorhinus marmoratus (Pallas, 1814) B 16 0.971 2.3 3.6 0.2560 1.1048 0.0406
ø 210 0.980 2.4 6.6 0.3532 1.1373 0.0085 T 10 0.987 2.8 5 0.3510 1.1251 0.0363 B: Büyükçekmece Dam Lake, Ç: Çandarlı Bay, E: Edremit Bay, ø: Lake øznik, øzm: øzmir Bay, K: Küçükçekmece Lagoon, Ö: Ömerli Dam Lake, S: Lake Sapanca, Sı: Sı÷acık Bay, T: Terkos Dam Lake, V: Lake Van.
82
Table 2. (Continue)
Family Species Locality n r2 Standard
length (mm)
Total length vs. standard length TL = a + bSL
min max a b SE(b)
Phycidae Phycis blennoides (Brünnich, 1768) Sı 12 0.990 11 13.4 0.2913 1.1042 0.0285 Poeciliidae Gambusia holbrooki Girard, 1859 B 15 0.999 2.6 4 0.2145 1.1213 0.0246 Ö 19 0.992 1.6 3.7 0.1571 1.1380 0.0185 Pomacentridae Chromis chromis (Linnaeus, 1758) Ç 34 0.948 10.4 12.8 0.1946 1.3033 0.0302 Serranidae Serranus hepatus (Linnaeus, 1758) øzm 93 0.985 5.3 8.4 0.2975 1.1709 0.0109 Sparidae Boops boops (Linnaeus, 1758) E 27 0.971 14.3 23.6 -0.2633 1.1959 0.0279 Trachichthyidae Hoplostethus mediterraneus Cuvier, 1829 Sı 458 0.987 5.8 14 1.0753 1.2298 0.0043
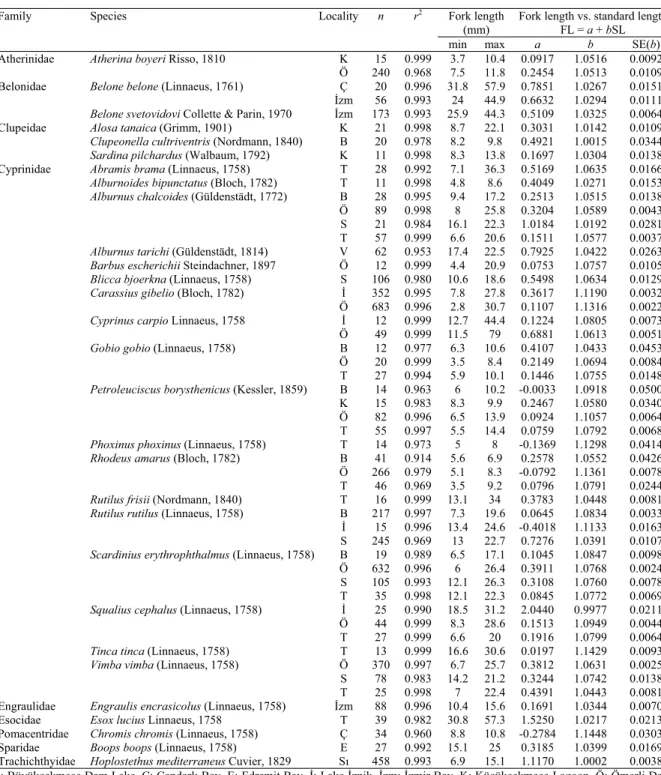
Table 3. Results of linear regressions of fork length versus standard length for the fish species caught from several Turkish
waters
Family Species Locality n r2 Fork length
(mm)
Fork length vs. standard length FL = a + bSL
min max a b SE(b)
Atherinidae Atherina boyeri Risso, 1810 K 15 0.999 3.7 10.4 0.0917 1.0516 0.0092 Ö 240 0.968 7.5 11.8 0.2454 1.0513 0.0109 Belonidae Belone belone (Linnaeus, 1761) Ç 20 0.996 31.8 57.9 0.7851 1.0267 0.0151
øzm 56 0.993 24 44.9 0.6632 1.0294 0.0111
Belone svetovidovi Collette & Parin, 1970 øzm 173 0.993 25.9 44.3 0.5109 1.0325 0.0064
Clupeidae Alosa tanaica (Grimm, 1901) K 21 0.998 8.7 22.1 0.3031 1.0142 0.0109
Clupeonella cultriventris (Nordmann, 1840) B 20 0.978 8.2 9.8 0.4921 1.0015 0.0344
Sardina pilchardus (Walbaum, 1792) K 11 0.998 8.3 13.8 0.1697 1.0304 0.0138
Cyprinidae Abramis brama (Linnaeus, 1758) T 28 0.992 7.1 36.3 0.5169 1.0635 0.0166
Alburnoides bipunctatus (Bloch, 1782) T 11 0.998 4.8 8.6 0.4049 1.0271 0.0153
Alburnus chalcoides (Güldenstädt, 1772) B 28 0.995 9.4 17.2 0.2513 1.0515 0.0138
Ö 89 0.998 8 25.8 0.3204 1.0589 0.0043
S 21 0.984 16.1 22.3 1.0184 1.0192 0.0281
T 57 0.999 6.6 20.6 0.1511 1.0577 0.0037
Alburnus tarichi (Güldenstädt, 1814) V 62 0.953 17.4 22.5 0.7925 1.0422 0.0263
Barbus escherichii Steindachner, 1897 Ö 12 0.999 4.4 20.9 0.0753 1.0757 0.0105
Blicca bjoerkna (Linnaeus, 1758) S 106 0.980 10.6 18.6 0.5498 1.0634 0.0129
Carassius gibelio (Bloch, 1782) ø 352 0.995 7.8 27.8 0.3617 1.1190 0.0032
Ö 683 0.996 2.8 30.7 0.1107 1.1316 0.0022
Cyprinus carpio Linnaeus, 1758 ø 12 0.999 12.7 44.4 0.1224 1.0805 0.0073
Ö 49 0.999 11.5 79 0.6881 1.0613 0.0051
Gobio gobio (Linnaeus, 1758) B 12 0.977 6.3 10.6 0.4107 1.0433 0.0453
Ö 20 0.999 3.5 8.4 0.2149 1.0694 0.0084
T 27 0.994 5.9 10.1 0.1446 1.0755 0.0148
Petroleuciscus borysthenicus (Kessler, 1859) B 14 0.963 6 10.2 -0.0033 1.0918 0.0500
K 15 0.983 8.3 9.9 0.2467 1.0580 0.0340
Ö 82 0.996 6.5 13.9 0.0924 1.1057 0.0064
T 55 0.997 5.5 14.4 0.0759 1.0792 0.0068
Phoxinus phoxinus (Linnaeus, 1758) T 14 0.973 5 8 -0.1369 1.1298 0.0414
Rhodeus amarus (Bloch, 1782) B 41 0.914 5.6 6.9 0.2578 1.0552 0.0426
Ö 266 0.979 5.1 8.3 -0.0792 1.1361 0.0078
T 46 0.969 3.5 9.2 0.0796 1.0791 0.0244
Rutilus frisii (Nordmann, 1840) T 16 0.999 13.1 34 0.3783 1.0448 0.0081
Rutilus rutilus (Linnaeus, 1758) B 217 0.997 7.3 19.6 0.0645 1.0834 0.0033
ø 15 0.996 13.4 24.6 -0.4018 1.1133 0.0163
S 245 0.969 13 22.7 0.7276 1.0391 0.0107
Scardinius erythrophthalmus (Linnaeus, 1758) B 19 0.989 6.5 17.1 0.1045 1.0847 0.0098
Ö 632 0.996 6 26.4 0.3911 1.0768 0.0024
S 105 0.993 12.1 26.3 0.3108 1.0760 0.0078
T 35 0.998 12.1 22.3 0.0845 1.0772 0.0069
Squalius cephalus (Linnaeus, 1758) ø 25 0.990 18.5 31.2 2.0440 0.9977 0.0211
Ö 44 0.999 8.3 28.6 0.1513 1.0949 0.0044
T 27 0.999 6.6 20 0.1916 1.0799 0.0064
Tinca tinca (Linnaeus, 1758) T 13 0.999 16.6 30.6 0.0197 1.1429 0.0093
Vimba vimba (Linnaeus, 1758) Ö 370 0.997 6.7 25.7 0.3812 1.0631 0.0025
S 78 0.983 14.2 21.2 0.3244 1.0742 0.0138
T 25 0.998 7 22.4 0.4391 1.0443 0.0081
Engraulidae Engraulis encrasicolus (Linnaeus, 1758) øzm 88 0.996 10.4 15.6 0.1691 1.0344 0.0070 Esocidae Esox lucius Linnaeus, 1758 T 39 0.982 30.8 57.3 1.5250 1.0217 0.0213 Pomacentridae Chromis chromis (Linnaeus, 1758) Ç 34 0.960 8.8 10.8 -0.2784 1.1448 0.0303 Sparidae Boops boops (Linnaeus, 1758) E 27 0.992 15.1 25 0.3185 1.0399 0.0169 Trachichthyidae Hoplostethus mediterraneus Cuvier, 1829 Sı 458 0.993 6.9 15.1 1.1170 1.0002 0.0038 B: Büyükçekmece Dam Lake, Ç: Çandarlı Bay, E: Edremit Bay, ø: Lake øznik, øzm: øzmir Bay, K: Küçükçekmece Lagoon, Ö: Ömerli Dam Lake, S: Lake Sapanca, Sı: Sı÷acık Bay, T: Terkos Dam Lake, V: Lake Van.
83
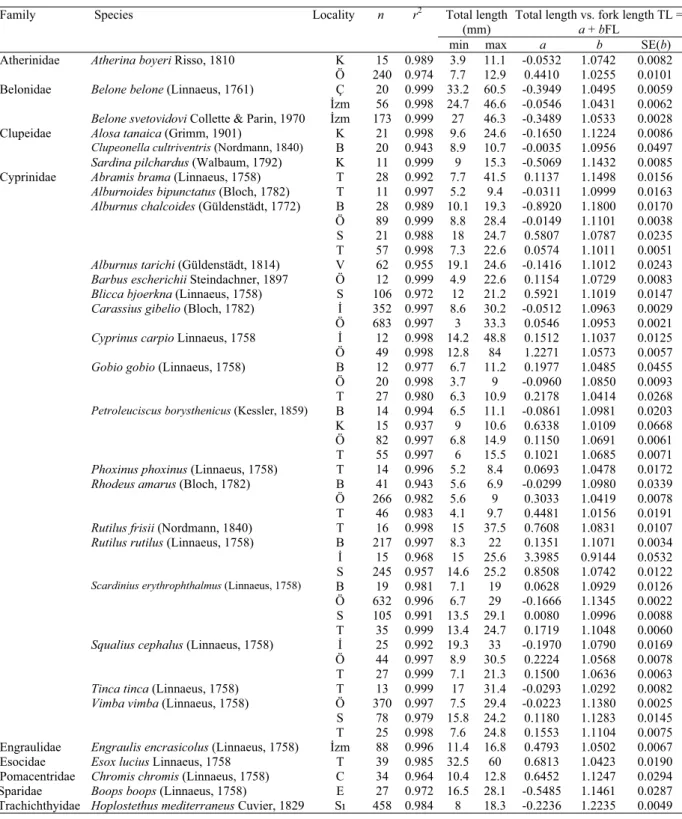
Table 4. Results of linear regressions of total length versus fork length for the fish species caught from several Turkish waters
Family Species Locality n r2 Total length
(mm)
Total length vs. fork length TL = a + bFL
min max a b SE(b)
Atherinidae Atherina boyeri Risso, 1810 K 15 0.989 3.9 11.1 -0.0532 1.0742 0.0082
Ö 240 0.974 7.7 12.9 0.4410 1.0255 0.0101
Belonidae Belone belone (Linnaeus, 1761) Ç 20 0.999 33.2 60.5 -0.3949 1.0495 0.0059
øzm 56 0.998 24.7 46.6 -0.0546 1.0431 0.0062
Belone svetovidovi Collette & Parin, 1970 øzm 173 0.999 27 46.3 -0.3489 1.0533 0.0028
Clupeidae Alosa tanaica (Grimm, 1901) K 21 0.998 9.6 24.6 -0.1650 1.1224 0.0086
Clupeonella cultriventris (Nordmann, 1840) B 20 0.943 8.9 10.7 -0.0035 1.0956 0.0497
Sardina pilchardus (Walbaum, 1792) K 11 0.999 9 15.3 -0.5069 1.1432 0.0085
Cyprinidae Abramis brama (Linnaeus, 1758) T 28 0.992 7.7 41.5 0.1137 1.1498 0.0156
Alburnoides bipunctatus (Bloch, 1782) T 11 0.997 5.2 9.4 -0.0311 1.0999 0.0163 Alburnus chalcoides (Güldenstädt, 1772) B 28 0.989 10.1 19.3 -0.8920 1.1800 0.0170
Ö 89 0.999 8.8 28.4 -0.0149 1.1101 0.0038
S 21 0.988 18 24.7 0.5807 1.0787 0.0235
T 57 0.998 7.3 22.6 0.0574 1.1011 0.0051
Alburnus tarichi (Güldenstädt, 1814) V 62 0.955 19.1 24.6 -0.1416 1.1012 0.0243 Barbus escherichii Steindachner, 1897 Ö 12 0.999 4.9 22.6 0.1154 1.0729 0.0083 Blicca bjoerkna (Linnaeus, 1758) S 106 0.972 12 21.2 0.5921 1.1019 0.0147
Carassius gibelio (Bloch, 1782) ø 352 0.997 8.6 30.2 -0.0512 1.0963 0.0029
Ö 683 0.997 3 33.3 0.0546 1.0953 0.0021
Cyprinus carpio Linnaeus, 1758 ø 12 0.998 14.2 48.8 0.1512 1.1037 0.0125
Ö 49 0.998 12.8 84 1.2271 1.0573 0.0057
Gobio gobio (Linnaeus, 1758) B 12 0.977 6.7 11.2 0.1977 1.0485 0.0455
Ö 20 0.998 3.7 9 -0.0960 1.0850 0.0093
T 27 0.980 6.3 10.9 0.2178 1.0414 0.0268
Petroleuciscus borysthenicus (Kessler, 1859) B 14 0.994 6.5 11.1 -0.0861 1.0981 0.0203
K 15 0.937 9 10.6 0.6338 1.0109 0.0668
Ö 82 0.997 6.8 14.9 0.1150 1.0691 0.0061
T 55 0.997 6 15.5 0.1021 1.0685 0.0071
Phoxinus phoxinus (Linnaeus, 1758) T 14 0.996 5.2 8.4 0.0693 1.0478 0.0172
Rhodeus amarus (Bloch, 1782) B 41 0.943 5.6 6.9 -0.0299 1.0980 0.0339
Ö 266 0.982 5.6 9 0.3033 1.0419 0.0078
T 46 0.983 4.1 9.7 0.4481 1.0156 0.0191
Rutilus frisii (Nordmann, 1840) T 16 0.998 15 37.5 0.7608 1.0831 0.0107 Rutilus rutilus (Linnaeus, 1758) B 217 0.997 8.3 22 0.1351 1.1071 0.0034
ø 15 0.968 15 25.6 3.3985 0.9144 0.0532
S 245 0.957 14.6 25.2 0.8508 1.0742 0.0122
Scardinius erythrophthalmus (Linnaeus, 1758) B 19 0.981 7.1 19 0.0628 1.0929 0.0126
Ö 632 0.996 6.7 29 -0.1666 1.1345 0.0022
S 105 0.991 13.5 29.1 0.0080 1.0996 0.0088
T 35 0.999 13.4 24.7 0.1719 1.1048 0.0060
Squalius cephalus (Linnaeus, 1758) ø 25 0.992 19.3 33 -0.1970 1.0790 0.0169
Ö 44 0.997 8.9 30.5 0.2224 1.0568 0.0078
T 27 0.999 7.1 21.3 0.1500 1.0636 0.0063
Tinca tinca (Linnaeus, 1758) T 13 0.999 17 31.4 -0.0293 1.0292 0.0082
Vimba vimba (Linnaeus, 1758) Ö 370 0.997 7.5 29.4 -0.0223 1.1380 0.0025
S 78 0.979 15.8 24.2 0.1180 1.1283 0.0145
T 25 0.998 7.6 24.8 0.1553 1.1104 0.0075
Engraulidae Engraulis encrasicolus (Linnaeus, 1758) øzm 88 0.996 11.4 16.8 0.4793 1.0502 0.0067
Esocidae Esox lucius Linnaeus, 1758 T 39 0.985 32.5 60 0.6813 1.0423 0.0190
Pomacentridae Chromis chromis (Linnaeus, 1758) C 34 0.964 10.4 12.8 0.6452 1.1247 0.0294
Sparidae Boops boops (Linnaeus, 1758) E 27 0.972 16.5 28.1 -0.5485 1.1461 0.0287
Trachichthyidae Hoplostethus mediterraneus Cuvier, 1829 Sı 458 0.984 8 18.3 -0.2236 1.2235 0.0049
B: Büyükçekmece Dam Lake, Ç: Çandarlı Bay, E: Edremit Bay, ø: Lake øznik, øzm: øzmir Bay, K: Küçükçekmece Lagoon, Ö: Ömerli Dam Lake, S: Lake Sapanca, Sı: Sı÷acık Bay, T: Terkos Dam Lake, V: Lake Van.
Acknowledgements
The authors wish to thank Prof. Dr. Nurettin
Meriç, Istanbul University, Faculty of Science,
Department of Biology, who provided the fish
samples from Küçükçekmece Lagoon. We also thank
several volunteers for their help in data collection,
namely Nadi Gökalp and his family, Adnan Sümer
and members of Ildeniz Fishery. We are grateful to
Zeynep Al who helped with preparation of the
manuscript.
84
Table 5. Results from ANCOVA for the slope of length – length relationships between areas and length conversions.
Species Study sites FL - TL SL – TL SL – FL
Atherina boyeri K – Ö o xx xx Belone belone Ç – øzm o xx xx Alburnus chalcoides S – Ö o o o S – B o o o S – T o o o Ö – B xx xx o Ö – T o xxx xxx B – T o o xx Carassius gibelio Ö – ø xxx x xxx Cobitis vardarensis Ö – B o Ö – ø o Ö – T o B – ø o B – T o ø – T o Cyprinus carpio I – Ö o o o Gambusia holbrooki Ö – B xxx Gobio gobio Ö – B o xx o Ö – T o x xx B – T o o o Neogobius melanostomus S – Ö o S – T o S – B xxx Ö – T o Ö – B xxx B – T x Petroleuciscus borysthenicus K – Ö o xxx xxx K – B o o o K – T o o o Ö – B o xx xxx Ö – T o xxx xxx B – T x o o Proterorhinus marmoratus B – T o B – ø xx T – ø xxx Rhodeus amarus Ö – B o xxx xxx Ö – T o xxx xxx B – T o xx x Rutilus rutilus S – B o o xxx S – ø xxx xxx o ø – B xxx xxx o Scardinius erythrophthalmus S – Ö xxx xxx xxx S – B o o o S – T xxx o xxx Ö – B xxx xxx xxx Ö – T xxx xxx xxx B – T xxx o xxx Squalius cephalus T – Ö o o xxx T – ø o o o Ö – ø o o o Vimba vimba S – Ö o xx xxx S – T xxx xxx xxx Ö – T xxx xxx xx xxx=P<0.001; xx=P<0.01; x=P<0.05; o=P>0.05.