c
⃝ T¨UB˙ITAK
doi:10.3906/elk-1401-18 h t t p : / / j o u r n a l s . t u b i t a k . g o v . t r / e l e k t r i k /
Research Article
A facial component-based system for emotion classification
Elena S ¨ONMEZ1,∗, Song¨ul ALBAYRAK21Department of Computer Engineering, Faculty of Engineering, ˙Istanbul Bilgi University, Ey¨up, ˙Istanbul, Turkey 2
Department of Computer Engineering, Faculty of Electric and Electronic Engineering, Yıldız Technical University, Esenler, ˙Istanbul, Turkey
Received: 03.01.2014 • Accepted/Published Online: 09.06.2014 • Final Version: 23.03.2016
Abstract: Smart environments with ubiquitous computers are the next generation of information technology, which requires improved human–computer interfaces. That is, the computer of the future must be aware of the people in its environment; it must know their identities and must understand their moods. Despite the great effort made in the past decades, the development of a system capable of automatic facial emotion recognition is still rather difficult. In this paper, we challenge the benchmark algorithm on emotion classification of the Extended Cohn-Kanade (CK +) database, and we present a facial component-based system for emotion classification, which beats the given benchmark performance: using a 2D emotional face, we searched for highly discriminative areas, we classified them independently, and we fused all results together to allow for facial emotion recognition. The use of the sparse-representation-based classifier allows for the automatic selection of the two most successful blocks and obtains the best results by beating the given benchmark performance by six percentage points. Finally, using the most promising algorithms for facial analysis, we created equivalent facial component-based systems and we made a fair comparison among them.
Key words: Facial expression recognition, affective computing, block-based technique, sparse representation-based classifier, local binary pattern
1. Introduction
The goal of an automatic facial expression recognition (FER) system is to teach the computer to recognize emotions; it is a challenging research field with many applications such as human–computer interactions, emotion analysis, image understanding, and synthetic face animation. The problem is particularly hard because it sums up all disturbance elements of faces, such as pose, occlusion, illumination changes, and low resolution, with those specific to emotion recognition, like intensity level and cultural variety of the emotion. Despite the great effort done in recent years, still there are unsolved issues that require further investigations [1,2].
In [3], Deng et al. introduced a local Gabor filter bank with the aim of decreasing the complexity of the original Gabor bank and compared its performance against Gabor features compressed with principal component analysis (PCA) and PCA plus linear discriminant analysis (LDA) on the Jaffe database. In [4], Bashyal and Venayagamoorthy used a Gabor filter in combination with learning vector quantization for recognition of the seven expressions of the Jaffe database. In [5], Shan et al. compared the performance of local binary patterns (LBPs) and the Gabor filter coupled with nearest neighbor (NN) and support vector machine (SVM) classifiers on the Cohn-Kanade database. In [6], Cotter applied the block-based sparse representation-based classifier ∗Correspondence: [email protected]
(SRC) algorithm to occluded faces of the Jaffe database and compared the obtained performance with the Gabor and NN approach. In [7], Huang et al. coupled the LBP feature with SRC and compared its performance against PCA, LDA, and Gabor histograms on the Jaffe database. In [8], Mahoor et al. used SRC with Gabor features for AU identification on the Cohn-Kanade database. In [9], Zavaschi et al. compared the performance of LBP and Gabor features when coupled together with the SVM classifier on FER experiments with the Jaffe and Cohn-Kanade databases. In [10], Zhang et al. used the Cohn-Kanade database to compare the performance of SRC with NN, SVM, and NS classifiers; in their experimental setup SRC gave better results when coupled together with Gabor and LBP features and showed stronger robustness to corruption and occlusion.
In this paper, we challenge the benchmark algorithm on emotion classification of the extended Cohn-Kanade database (CK +) , and we beat its best result by six percentage points by 1) dividing the original 2D faces into subblocks, such as mouth, nose, and eyes; 2) classifying all subimages independently with the SRC; and 3) reaching the final decision by merging only the scores of the most discriminative areas. That is, inspired by the results of psychological studies on saccadic eye movements [11], which suggest that humans use discriminative information to recognize objects, we increased our initial performance of the holistic SRC, presented in [12], by using a facial component-based system. Finally, we used the most promising feature extraction techniques, subspace projections, and classifiers to create novel facial component-based systems, and we made a fair comparison among them by running the same experiment on top of the same data.
Section 2 outlines the main algorithms used for FER; Section 3 details all experimental setups, with special attention to the fusing techniques used for achieving classification; and Section 4 presents the CK + database and the results. Conclusions are drawn in Section 5.
2. Algorithms for FER
In this section we give a brief description of the most popular feature extractions and classifier techniques used in FER, with particular attention to the LBP feature extraction method and the SRC, which are recently introduced very promising techniques. According to the literature, Gabor filters also produce very high performance for facial analysis [13,14]; however, their elevated computational costs make them impractical for real-time FER.
2.1. Feature extractions methods
PCA is an unsupervised approach for finding patterns in data of high dimension; it is a dimensionality reduction method that maps the data into the directions of maximum scatter. In our experiments, we implemented the PCA procedure as described by Turk and Pentland [15]: we normalized the training data, we calculated the eigenvectors of the covariance matrix, and we created the PCA subspace by selecting its biggest 60 eigenvectors; that is, knowing that the sum of all eigenvalues is the total energy of the class, in order to retain 90% of it, we fixed to 60 the PCA low dimension. Finally, both training and test samples were projected into the PCA subspace, where classification was performed with the NN algorithm [16].
LDA is a supervised approach for finding patterns in data of high dimension; it is a dimensionality reduction method that maps the data into the directions that maximize the interclass distances while minimizing the intraclass scatters. In our experiments, we implemented the LDA procedure as described by Belhumeur et al. [17]; that is, we partitioned the training set into classes; we calculated the between and the within scatter matrices of the data, SB and SW; and we maximized the ratio det|SB|/det|SW| by selecting the top
used as a preprocessing step. Having built the LDA subspace, both training and test samples were projected into it and classification was performed using the NN algorithm.
The LBP operator [18] was originally designed for texture description and then extended to various fields of application including FER [19,20]. The operator processes all pixels of the image by changing their gray-level values with the decimal representation of a threshold function applied to a fix neighborhood. That is, each neighbor pixel’s intensity is compared with the gray-level value of the processed pixel, which acts as a threshold; this comparison produces a 1 when the intensity exceeds the threshold value and 0 otherwise. The final output is a binary string having as many bits as the cardinality of the neighborhood, which is finally converted into a decimal number, the LBP label. The LBP feature is the histogram of all LBP labels; in the uniform pattern variation all nonuniform patterns (circular binary strings with more than two transitions, from 0 to 1 or vice versa) are cast into a single bin. The most attractive advantages of LBP are its invariance to monotonic gray-scale changes, low computational complexity, and convenient multiscale extension. Considering the growing interest in the LBP operator [18–22], we built facial component-based systems that couple LBP with both the NN and the SRC classification algorithms; the uniform pattern LBP variation uses the code of [21].
In our experiments, we divided the input blocks into 5 × 5 = 25 subblocks; we used the circular operator LBP8,2, which thresholds the 8 neighbors at distance 2 from the center pixel; and we concatenated the 25 normalized histograms. The resulting LBP feature has size 256 × 25 = 6400.
2.2. Classifier
The SRC is a recently proposed algorithm that has been successfully applied in a wide range of applications ranging from subject identification [12,23], facial expression recognition [12,24], facial action unit identification [8], object recognition [25], and image denoising [26].
The SRC was first introduced by Wright et al. in [23]; it is based on the theory of compressive sensing [27–29]. The main idea is that many interesting phenomena in nature lie in a smaller, often much smaller, dimensional subspace as compared to the observed signal dimensionality; in other words, the intrinsic magnitude of a signal subspace, where all the variations of the signal occur, is significantly smaller than the ambient dimension. Sparse approximation methods attempt to discover this subspace and to represent events and objects in that manifold. Practically, this is done by creating matrix D , which aligns all vectorized training samples divided into classes, and solving the following system:
y = D· x, (1)
where y is the test sample to be classified and x is the corresponding minimum L1 norm solution.
In the emotion recognition task, classes are emotions, having c emotions; matrix D is logically divided into c parts, D = [D1, . . . ,Dc] ; and the nonzero elements of the sparse solution x select some columns or
atoms of D to represent the unknown test sample y . Classification is performed by assigning y to the class that better represents it, the nearby class, the one having minimum residual (or score). That is, Eq. (1) can be solved with a synthesis algorithm such as LASSO [30], orthogonal matching pursuit [31], augmented Lagrange multiplier [32], and many others; having the solution x , SRC assigns the nearby class to the test sample y . Table 1 gives the pseudocode of the SRC algorithm.
It interesting to underline that SRC makes classifications via a 2-step algorithm: during the first holistic stage, it uses all the training set to calculate a sparse representation of the test sample, while in the second
Table 1. Pseudocode of the SRC algorithm.
INPUTS: a dictionary D, and an observed signal y to be classified CODE:
1. Normalize all columns of D and the test sample y by imposing unit L2 norm 2. Solve the L1 minimization problem:
minx||x||1such that ||y − D · x||2< ε
1. Compute the residuals, resi=||y − D · xi||2∀i = 1, · · · , C;where xi is the vector x restricted to
the coefficient of class i
OUTPUT: Class(y) = the class producing minimum residual
class-based step, it uses the coefficients of the sparse solution as weights to calculate the nearby class. A detailed description of all studies done on SRC was presented in [12,33].
In this work, we compare the SRC with the NN classifier because NN has the advantage of being simple and the theoretical property of having an error rate converging to the Bayes error rate when the number of training samples tends to infinity; that is, for sufficiently large training set size, NN is the optimal classifier. The main disadvantage of NN is the curse of dimensionality, but the effective dimension of faces is assumed to be much smaller than the original one, and the NN method may still work well. Moreover, the NN algorithm is a data-driven method; it does not require any training, and therefore its running time is a good comparison term for the SRC.
3. Block-based systems for emotion classification
While a holistic automatic FER system is made up of 1) face detection and alignment, 2) subspace projection or facial feature extraction, and 3) classification, when the emotion identification issue is handled in a block-based fashion, the steps are 1) to align and cut the interesting blocks out of every emotional face, 2) to classify all blocks independently, and 3) to fuse their multiple results.
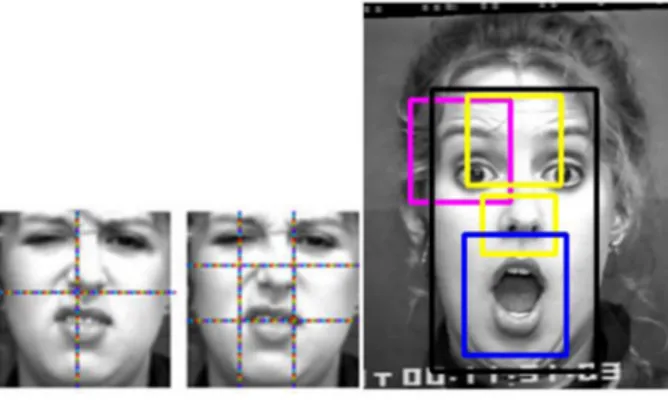
We started working with nonoverlapping blocks, and then we increased our initial performance using overlapping blocks; Figures 1a–1c shows a cropped face divided into 2 × 2 and 3 × 3 nonoverlapping blocks, and 5 overlapping blocks.
We chose the overlapping blocks considering them as the most effective in FER:
• Block 1 of size 75 × 90 = 6750 pixels: it covers the region of the left eye plus the eyebrow with some
forehead.
• Block 2 of size 70 × 80 = 5600 pixels, and block 3 of size 60 × 80 = 4800 pixels: they cover, respectively,
the upper part of the nose with the center of the front, and the nose tip, the area just between the nose and mouth.
• Block 4 of size 75 × 115 = 8625 pixels: it covers the mouth region. • Block 5 of size 215 × 150 = 32250 pixels: it is a tight frame of the face.
Notice that overlapping blocks are of different sizes and they are independently classified; in fact, the block-based classification algorithm can be run in parallel.
From an implementation point of view, when classification is performed with the NN algorithm, the resulting matrix of distances stores the Euclidean distance of every test sample to every training sample for every block; on the other hand, when classification is performed with the SRC, the produced matrix of scores stores the distance between every test sample to every class, for every block. In both cases, the 3D matrix of distances (or scores) needs to be converted to a 2D matrix to allow for classification; the following subsection gives an overview of the merging techniques that were tested for this particular issue.
3.1. Fusing techniques
3.1.1. Average or minimum of all block’s scores
This fusing technique converts the matrix of scores from 3D to 2D simply by calculating the average among all scores or by selecting the minimum distance among all blocks.
3.1.2. Weighted average of all block’s scores
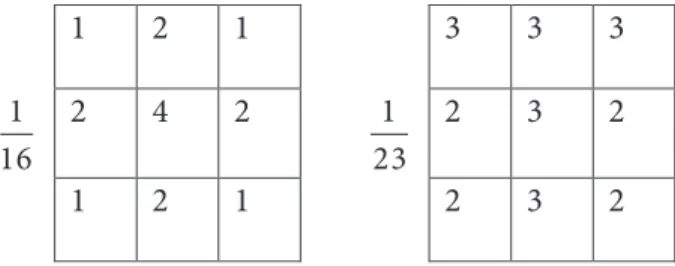
When implementing the 3 × 3 nonoverlapping block division, we converted the score matrix from 3D to 2D by assigning different weights to blocks in different positions. Figure 2 shows the two masks used.
1
2
1
3
3
3
16
1
2
4
2
23
1
2
3
2
1
2
1
2
3
2
Figure 2. Masks used for the fusing step.
The logic of the first mask is to give more importance to the central block of the face, thinking that most of the emotion is concentrated around the nose and mouth area, while the idea of the second mask is to give more importance to the blocks of the top row and those of the central columns of the face.
Other possible and interesting weights are related to the success rate; that is, the weight assigned to every block is the success rate of that block in detecting that emotion, in formula,
P weightemb = P em b block no∑ i=1 Pem i (2)
∀b = 1, · · · , block no, ∀em = 1, · · · , emotion no, where Pem
b is the probability of the success of block b in
detecting emotion em. Obviously, this technique requires to partition the total number of samples into{train, validation, test}sets.
3.1.3. Rank-based fusing
Starting from a block-based classification algorithm, we converted the block scores into ranks, from 1 to 7, and summed the rank scores over the blocks to get the final classification score.
3.1.4. Critical parameter of SRC: the confidence level
A critical parameter is a measurement correlated to the performance of the SRC. In our studies on the SRC [12,33], we proposed five measurement candidates to be critical parameters of the sparse classifier, and we proved, empirically, that only three of them can actually be used to predict the performance of the classifier; that is, they are critical parameters of the SRC.
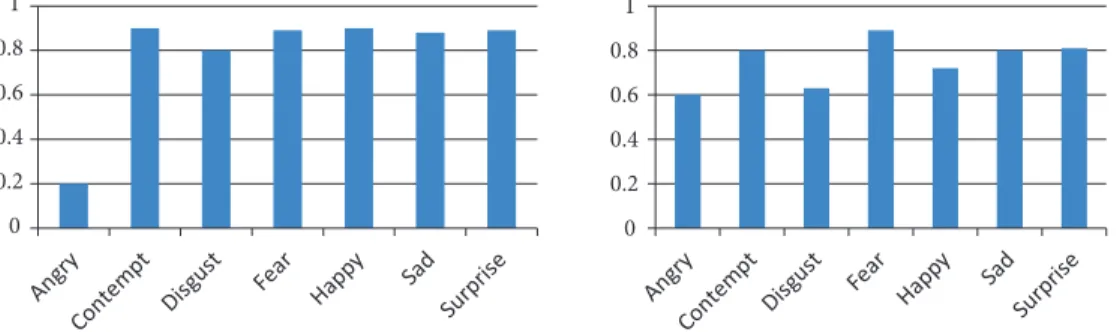
In the experiment for emotion classification with overlapping blocks, we used the most sensitive critical parameter, the “confidence level”, which may be defined as the amount of confidence of the classifier. Because the SRC assigns to every test sample the nearby class, the confidence level of the SRC is the distance between the winner class and the runner up; the bigger this distance is, the higher the amount of confidence of the classifier. To better illustrate this concept, in Figure 3 we compare the set of residuals, which allows for correct classification of the test sample with the ones resulting in misclassification: while on the left side there is no doubt about the winner class, “angry”, on the right side the distance between the winner class and the runner up is very small and so the decision is not as clear as before.
0 0.2 0.4 0.6 0.8 1 0 0.2 0.4 0.6 0.8 1
Figure 3. Residuals of a correctly classified test sample (left) and a misclassified test sample (right). In both cases the winner class is “Angry”.
This fusing technique was the most successful one, but it is obviously available only for facial component-based systems using the SRC.
4. Experiments
4.1. The CK + database
We used the CK + database [34], which is one of the most complete collections of validated emotional faces; CK + was released in 2010 with the purpose of promoting research in FER. Compared with the Cohn-Kanade (CK) [35] database, CK + has validated emotional faces and a common performance metric against which to evaluate new algorithms; that is, CK + overcomes the main limitations of the CK dataset by associating an emotional code only to those peak faces of the database, which satisfies all necessary requirements, and by providing a standard protocol against which to evaluate new algorithms.
CK + has 123 subjects and 7 emotions: the six universal expressions of anger, disgust, fear, happiness, sadness, and surprise, plus contempt; for every subject there are a different number of sequences, and in every sequence the subject presents one specific emotion. Not all subjects act out all emotions and consequently emotions have differing numbers of samples. Every sequence starts with a neutral frame and ends with an emotional face. The database stores a total of 593 video clips (Subject no x Sequence no), but only 327 sequences of 118 subjects have a validated coded emotion. We worked with all 327 validated sequences and we repeated the same experiment given as a benchmark with the CK + database; that is, we run the leave one subject out (LOSO) cross-validation experiment, which allows for 118 trials where all emotional faces of the current subject are used as test samples and the training set is made up of emotional faces of all remaining subjects. The best performance of the benchmark paper is 88%; it is reached using the active appearance model (AAM) and SVM.
4.2. Results
We used the SRC to challenge the emotion classification experiment of CK + ; in our previous work [12] we presented the results of several holistic SRC systems where the best performance was 88%, like the SVM classifier. We increased this initial performance with a block-based SRC. We created novel facial component-based systems by using different feature extraction techniques, subspace projections, and classifiers, and we compared their performances on top of the same data. Table 2 has the obtained results where all experiments use the 5 overlapping blocks of Figure 1c; the column “Algorithms” fixes the couple (feature selection, classifier) used to implement the facial component-based system. For every system we provide 1) its general performance, by averaging the success rate of the two most successful blocks; 2) the feature length; 3) the running time, as a measure of its complexity; and 4) the individual performance of the two best blocks.
All experiments were run in the MATLAB R2007b environment with an Intel CORE i7-3630QM CPU @ 2.40 GHz 2.40 GHz.
The first row of Table 2, labeled “AAM + SVM”, stores the given benchmark performance, 88%.
Rows 2 and 3 detail the experimental setups, which couple raw pixels, i.e. vectorized blocks, with the SRC and NN; due to the sequential execution of the classifier, we calculated the feature length as the average length of the 5 blocks, equal to the mean of (6750, 5600, 4800, 8625, 32,250) = 11,605. Since row 3 reaches the top performance of 94%, we use Table 3 to give the details of this experimental setup. That is, Table 3 compares the classification results of the SRC on individual single blocks versus the success rate obtained by the SRC averaging all block’s scores and the one reached by considering only the distances of the two most successful blocks.
Table 3 shows that the most discriminative blocks are the ones around the mouth and a tight frame of the face. The knowledge of a critical parameter of SRC allows for their automatic selection and the average of their scores produces the best performance of 94%.
Table 2. Performance comparison of several facial component-based systems using 5 overlapping blocks.
Row
no. Algorithms
Perf.
(%) Feature length (doubles)
Running time (s)
Perf (%) of the 2 most successful blocks
1 AAM + SVM 88 Given benchmark performance [11]
2 Raw pixels + NN 76 Mean (6750, 5600, 4800, 8625, 32,250) = 58,025/5 = 11,605 76 Block 4 (mouth) = 80 Block 5 (face) = 64 3 Raw pixels + SRC 94 11,605 653 (10.88 min) Block 4 = 91 Block 5 = 88 4 Downsampled blocks raw pixels + NN 79 Mean (750, 1400, 1200, 1000, 3500) = 7850/5 = 1570 17 Block 4 = 80 Block 5 = 64 5 Downsampled blocks raw pixels + SRC 94 1570 74 Block 4 = 91 Block 5 = 88 6 LBP + NN 86 256 × 25 subblocks = 6400 40 Block 4 = 83 Block 5 = 76 7 LBP + SRC 93 6400 431 (7 min) Block 4 = 91 Block 5 = 87 8 Uniform patterns LBP (code
of [21]) + SRC 66 Neighbors × (neighbors –1) + 3 = 8 × 7+3 = 59 32 Block 4 = 62 Block 5 = 48 9 Downsampled blocks LBP + SRC 73 256 (no subblocks) 37 Block 4 = 69 Block 5 = 59 10 Selected blocks LBP + SRC 88 256 × 13 subblocks = 3328 205
(3.4 min)
Block 4 = 89 Block 5 = 83
11 PCA + NN 64 PCA low dim = 60 130
(2.1 min) Block 4 = 56 Block 5 = 49 12 PCA + SRC 78 60 156 (2.6 min) Block 4 = 71 Block 5 = 62
13 LDA + NN 82 PCA low dim = 49
LDA low dim = 6
250 s (3.5 min) Block 4 = 81 Block 5 = 76 14 LDA + SRC 82 49, 6 201 s Block 4 = 76 Block 5 = 73
Table 3. Recognition rate (%) of 1) single blocks, 2) the mean score of all blocks, and 3) the mean score of the 2 best chunks.
Eye Top of
nose Nose tip Mouth Face
Average of scores of all blocks Average of scores of the two best blocks Perf (%) 65 59 69 91 88 87 94
From row 3 of Table 2, we point out that the running time of the SRC is 10 min, which is a prohibitive value for automatic FER. Knowing that the performance of the SRC is heavily affected by the feature length, we downsampled the original blocks by a factor of 2 or 3 in both dimensions; that is:
• Block 1 of size 75 × 90 = 6750 pixels is downsampled to 25 × 30 = 750 pixels.
• Block 2 of size 70 × 80 = 5600 pixels becomes 35 × 40 = 1400, and block 3 of size 60 × 80 = 4800
• Block 4 of size 75 × 115 = 8625 pixels becomes 25 × 40 = 1000.
• Block 5 of size 215 × 150 = 32,250 pixels is downsampled to 70 × 50 = 3500.
The choice of the size of the downsampled blocks is constrained by the subsequent application of the LBP operator.
Rows 4 and 5 of Table 2 detail the experimental setups, which couple the vectorized downsampled blocks with NN and SRC. The average feature length is now the mean of (750, 1400, 1200, 1000, 3500) = 1570; the recognition rate of the SRC is unchanged, and its running time drops to 74 s.
Rows 6 and 7 of Table 2 couple LBP with NN and SRC; the combination (LBP, SRC) produces a recognition rate of 93%. We tried some LBP variations such as: (in row 8) the uniform pattern variation, which uses the code provided by [21]; (in row 9) downsampled blocks with the holistic LBP8,2 operator, which results in a feature of size 256; and (in row 10) the “selected blocks” LBP variation, introduced in this paper, which still divides the original blocks into 5 × 5 subblocks and considers the 8 neighbors of every pixel; the only difference is that the resulting feature is built as a concatenation of histograms corresponding to subblocks in odd positions, i.e. those having an odd sum of column and row numbers.
Finally, looking at the last 4 rows of Table 2, we see that both in PCA and LDA subspaces the SRC and NN algorithms have comparable running time, and the performance of the SRC is generally better.
In conclusion, we may say that the results of Table 2 underline the superior performance of the SRC classifier over NN and SVM, comparing the following results:
• From rows (2, 3), (4, 5), and (6, 7), we notice that NN is quicker than SRC but less successful.
• From row (1, 5), we see that SRC achieves the best recognition rate of 94%, six percentage points better
than SVM.
5. Conclusion
We focused on automatic FER; we challenged the benchmark protocol released together with the CK + database, and we beat its best performance with a block-based SRC. Finally, we created new facial component-based systems by coupling PCA, LDA, and LBP with SRC and NN, and we made a fair comparison among them on top of the same data.
Experimental results show the superior performance of the block-based SRC and suggest reducing its running time by downsampling and parallel programming; moreover, the knowledge of the critical parameters of the SRC allows for the automatic selection of the most successful blocks and results in a completely automatic FER system.
This is an empirical paper where we discuss all experiments run to use the SRC for automatic FER, and we give pointers to our previous studies on SRC [12,33].
Future work will address the following issues: 1) face recognition and/or emotion recognition using 3D faces; 2) study of the SVM classifier; and 3) application of machine learning and computer vision techniques to the medical field and robotics vision.
References
[1] Pantic M, Rothkrantz L. Automatic analysis of facial expression: the state of the art. IEEE T Pattern Anal 2000; 22: 1424-1445.
[2] Fasel B, Luettin J. Automatic facial expression analysis: a survey. Pattern Recogn 2003; 36: 259-275.
[3] Deng HB, Jin LW, Zhen LX, Huang JC. A new facial expression recognition method based on local Gabor filter bank and PCA plus LDA. Int J Inf Tech 2005; 11: 86-96.
[4] Bashyal S, Venayagamoorthy GK. Recognition of facial expressions using Gabor wavelets and learning vector
quantization. Eng Appl Artif Intel 2008; 21: 1056-1064.
[5] Shan C, Gong S, McOwan PW. Facial expression recognition based on local binary patterns: a comprehensive
study. Image Vision Comput 2009; 27: 803-816.
[6] Cotter S. Weighted voting of sparse representation classifiers for facial expression recognition. In: 18th European Signal Processing Conference; 23–27 August 2010; Aalborg, Denmark.
[7] Huang MH, Wang Z, Ying ZL. A new method for facial expression recognition based on sparse representation plus
LBP. In: 3rd International Congress on Image and Signal Processing; 16–18 October 2010; Yantai, China.
[8] Mahoor MH, Zhou M, Veon K, Mavadati SM, Cohn J. Facial action unit recognition with sparse representation.
In: 9th IEEE International Conference on Automatic Face and Gesture Recognition (FG011); March 2011; Santa Barbara, CA, USA.
[9] Zavaschi TH, Koerich AL, Oliveira LES. Facial expression recognition using ensemble of classifiers. In: IEEE
International Conference on Acoustics, Speech and Signal Processing , 22–27 May 2011; Prague, Czech Republic.
[10] Zhang S, Zhao X, Lei B. Robust facial expression recognition via compressive sensing. Sensors 2012; 12: 3747-3761.
[11] Minut S, Mahadevan S, Henderson JM, Dyer FC. Face recognition using foveal vision. In: IEEE 2000 International
Workshop on Biologically Motivated Computer Vision; 15–17 May 2000; Seoul, Korea. pp. 424-433.
[12] Battini S¨onmez E. Robust Classification Based on Sparsity. Saarbrucken, Germany: Lambert Academic Publishing.
[13] Zhang Z, Lyons MJ, Schuster M, Akamatsu S. Comparison between geometry-based and Gabor-wavelets-based
facial expression recognition using multi-layer perceptron. In: IEEE International Conference on Automatic Face and Gesture Recognition; 14–16 April 1998; Nara, Japan.
[14] Xie S, Shan S, Chen X, Meng X, Gao W. Learned local Gabor patterns for face representation and recognition.
Signal Process 2009; 89: 2333-2344.
[15] Turk M, Pentland A. Eigenfaces for recognition. J Cognitive Neurosci 1991; 3: 71-86.
[16] Duda R, Hart P, Stork D. Pattern Classification. 2nd ed. New York, NY, USA: John Wiley, 2001.
[17] Belhumeur PN, Hespanha JP, Kriegman DJ. Eigenfaces vs Fisherfaces: recognition using class specific linear
projection. Lect Notes Comp Sci 2005; 1064: 43-58.
[18] Ojala T, Pietikinen M, Menp T. Multi-resolution gray-scale and rotation invariant texture classification with local binary patterns. IEEE T Pattern Anal 2002; 24: 971-987.
[19] Shana C, Gong S, McOwan PW. Facial expression recognition based on local binary patterns: a comprehensive
study. Image Vision Comput 2009; 27: 803-816.
[20] Zhao X, Zhang S. Facial expression recognition using local binary patterns and discriminant kernel locally linear embedding. EURASIP J Adv Sig Pr 2012; 2012: 20.
[21] Ahonen T, Hadid A, Pietik¨ainen M. Face description with local binary patterns: application to face recognition. IEEE T Pattern Anal 2006; 28: 2037-2041.
[22] Wang X, Gong H, Zhang H, Li B, Zhuang Z. Palmprint identification using boosting local binary pattern. In: 18th International Conference on Pattern Recognition; 2006. pp. 503-506.
[23] Wright J, Yang AY, Ganesh A, Sastry SS, Ma Y. Robust face recognition via sparse representation. IEEE T Pattern Anal 2009; 31: 210-227.
[24] Battini Sonmez E, Sankur B, Albayrak S. Classification with emotional faces via a robust sparse classifier. In: 3rd International Conference on Image Processing Theory, Tools and Applications; 15–18 October 2012; ˙Istanbul, Turkey.
[25] Marial J, Bach F, Ponce J, Sapiro G, Zisserman A. Discriminative learned dictionaries for local image analysis. In: IEEE International Conference on Computer Vision and Pattern Recognition; 23–28 June 2008; Anchorage, AK, USA.
[26] Elad M, Aharon M. Image denoising via sparse and redundant representations over learned dictionaries. IEEE T
Image Process 2006; 15: 3736-3745.
[27] Donoho DL. Compressed sensing. IEEE T Inform Theory 2006; 52: 1289-1306.
[28] Baraniuk RG. Compressive sensing [lecture notes]. IEEE Signal Proc Mag 2007; 24: 118-121.
[29] Candes EJ, Wakin MB. An introduction to compressive sampling. IEEE Signal Proc Mag 2008; 25: 21-30.
[30] Efron B, Hastie T, Johnstone I, Tibshirani R. Least angle regression. Ann Stat 2004; 32: 407-499.
[31] Pati YC, Rezaiifar R, Krishnaprasad PS. Orthogonal matching pursuit: recursive function approximation with
applications to wavelet decomposition. In: 27th Annual Asilomar Conference on Signals, Systems and Computers; 1–3 November 1993; Pacific Grove, CA, USA.
[32] Yang AY, Ganesh A, Zhou Z, Sastry SS, Ma Y. A review of fast L1-minimization algorithms for robust face recognition. In: International Conference in Image Processing; 26–29 September 2010; Hong Kong.
[33] Battini S¨onmez E, Albayrak S. A study on the critical parameters of the sparse representation based classifier. IET Comput Vis 2013; 7: 500-507.
[34] Lucey P, Cohn JF, Kanade T, Saragih J, Ambadar Z, Matthews I. The extended Cohn-Kanade dataset (CK +) :
A complete dataset for action unit and emotion specified expression. In: IEEE Workshop on CVPR for Human Communicative Behavior Analysis Proceedings; 18 June 2010; San Francisco, CA, USA.
[35] Kanade T, Cohn JF, Tian Y. Comprehensive database for facial expression analysis. In: 4th IEEE International