THE EFFECT OF CULTURE IN FORMING E-LOYALTY INTENTIONS IN THE TOURSIM INDUSTRY:
A CROSS-CULTURAL ANALYSIS BETWEEN TURKEY AND RUSSIA
KETEVAN MALAKMADZE 114687014
ISTANBUL BILGI UNIVERSITY INSTITUTE OF SOCIAL SCIENCES
MA in MARKETING
ASST. PROF. DR. SUHEYL UNVER 2016
ii ABSTRACT
Enhancing loyalty intentions in e-commerce helps companies to grow their markets which require dealing with cultural background influencing e-commerce usage. In this study, the analysis is based on the effect of culture on the relationship between service quality and e-loyalty intentions in Turkey and Russia, which are the countries with small cultural differences. Based on a comparative analysis of Turkish and Russian consumers that used online tourism websites, our study shows that culture has acts as a moderator for the effects of e-service quality and e-satisfaction on e-loyalty intentions. Moreover, the findings of this study show that that the effect of e-service quality and e-satisfaction on e-loyalty intentions is higher for Russian
consumers. Considering the findings this study came up with, marketers should take into the account that the e-loyalty formation based on e-service quality and e-satisfaction might differ across cultures, no matter the cultures being similar.
iii ÖZET
E-ticarette bağlılık eğilimlerini geliştirmek firmalara pazarlarını büyütmede yardımcı olmaktadır bu bağlamda firmaların e-ticaret kullanımını etkileyen kültürel alt yapıyı göz önünde
bulundurmaları gerekmektedir. Bu çalışmada, kültürel farklılıkları az olan Türkiye ve Rusya’da e-hizmet kalitesi ile e-bağlılık eğilimi arasındaki ilişkide kültürün etkisi incelenmiştir. Bu çalışma, çevrimiçi turizm sitelerini kullanan Türk ve Rus tüketicilerin karşılaştırmalı analizine dayanarak, e-hizmet kalitesive e-memnuniyetin e-bağlılık eğilimi üzerinde olan etkisinde kültürün moderator görevi gördüğünü göstermektedir. Buna ek olarak,bu çalışma e-hizmet kalitesi ve e-memnuniyetin e-bağlılık eğilimleri üzerinde olan etkisinin Rus tüketicilerde daha yüksek olduğunu ortaya koymaktadır. Bu çalışmanın bulguları, kültürel alt yapı farklılıklarıaz olsa dahi, pazarlamacıların, e-servis kalitesi ve e-memnuniyete dayanan e-bağlılığın
yaratılmasında bu kültürel farklılıkların rol oynadığını göz önünde bulundurmaları gerektiğini ortaya koymuştur.
iv
ACKNOWLEDGEMENTS
First, I would like to express my deep gratitude to my thesis supervisor DR. Suheyl Unver for the useful comments, remarks and engagement through the learning process of this master thesis. The door of Mr. Unver's office was always open whenever I needed giddiness during my thesis or had any question about my research or writing. I would like to thank him for his patience, motivation, enthusiasm, and immense knowledge, which helped me in all the time of research and writing of this thesis.
Second, I would like to thank Prof. Selime Sezgin, who taught and supervised me during the whole MSc program. Prof. Sezgin was the one who helped me to understand the topic in the very beginnings and supported me on the way after. Without her passionate participation and input, my whole MSc program could not have been successfully conducted.
Finally, I like to thank the participants in my survey, who have willingly shared their precious time while filling the questionnaire. I would like to thank also my loved ones, especially my dearest friend Elif Erceltik, who have supported me during the entire process, both by
keeping me compatible and helping me putting pieces together every time I was facing the problem.
v TABLE OF CONTENTS ABSTRACT ... ii ÖZET ... iii ACKNOWLEDGEMENTS ... iv TABLE OF CONTENTS ... v
LIST OF TABLES ... vii
LIST OF FIGURES ... viii
1 INTRODUCTION ... 1 2 CONCEPTUAL FRAMEWORK ... 5 2.1 E-service Quality ... 5 2.2 E-satisfaction ... 6 2.3 E-Loyalty ... 6 3 HYPOTHESIS DEVELOPMENT ... 9
3.1 E-service quality impact on e-satisfaction ... 9
3.2 E-satisfaction impact on e-loyalty ... 10
3.3 E-service quality impact on e-loyalty intentions ... 11
3.4 The role of culture in forming loyalty intentions ... 11
3.4.1 The Hofstede’s model of cultural dimensions: ... 12
3.4.2 Culture as a moderator ... 14
4 RESEARCH METHODOLOGY ... 20
4.1 Research Context... 20
4.1.1 Tourism industry of Turkey ... 21
4.1.2 Tourism industry of Russia... 21
4.2 Research Design ... 22 4.2.1 Research philosophy ... 22 4.2.2 Research Method ... 23 4.2.3 Time Horizon ... 23 4.2.4 Data Collection ... 24 4.3 Sample Design... 25
4.3.1 Defining the population& sampling frame ... 26
4.3.2 Sampling method ... 27
4.3.3 Sample size ... 28
4.4 Measurement ... 28
4.4.1 E-service quality ... 29
vi 4.4.3 E-loyalty ... 29 4.4.4 Culture ... 30 4.4.5 Control Variables ... 30 5 RESULTS ... 31 5.1 Respondent characteristics ... 31
5.2 Exploratory Factor Analysis ... 32
5.2.1 E-service quality ... 32 5.2.2 E-satisfaction ... 35 5.2.3 E-loyalty ... 37 5.3 Hypothesis Testing ... 39 5.3.1 Direct Effects ... 39 5.3.2 Interaction Effects ... 40
6 DISCUSSION AND CONCLUSION ... 42
6.1 Theoretical Implications ... 43
6.2 Practical Implications ... 44
6.3 Study Limitations ... 45
REFERENCES ... 47
vii
LIST OF TABLES
Table 1 - Cultural distance between Turkey and Russia according to Hofstede’s cultural dimensions ... 16
Table 2 - Sample information and distribution of participants' demographic characteristics of Turkey and Russia ... 31
Table 3 - KMO and Bartlett’s Test Results for E-Service Quality ... 33
Table 4 - Anti-Image Correlation Values ... 34
Table 5 - The Results of Rotated Component Matrix ... 35
Table 6 - KMO and Bartlett’s Test Results for E-Satisfaction ... 36
Table 7 - Anti-Image Correlation Values ... 36
Table 8 - The Results of Rotated Component Matrix ... 37
Table 9 - KMO and Bartlett’s Test Results for E-Satisfaction ... 38
Table 10 - Anti-Image Correlation Values ... 38
Table 11 - The Results of Rotated Component Matrix ... 39
viii
LIST OF FIGURES
1
1 INTRODUCTION
The Internet has made a powerful impact on marketing and gave rise to a new shape of retail transaction called online shopping. The rate of online shopping is rising year by year. Consumers from different cultures and with different consumption values are using online shopping due to benefits such as ease of search and order, and entertainment (M. Cleveland & M. Laroche, 2007). Therefore e-commerce and online shopping have become a process of exponential growth. Cross-cultural studies up to now have mostly focused on e-commerce between culturally distant countries (Puja &Yukti, 2011). Moving from here, our study aims to study the differences in the e-loyalty formation process among different cultures in online tourism industry. Our research proposes that consumers’ attitudes and behaviors towards online tourism industry may differ between countries, even when their cultural differences are somewhat more limited.
Nevertheless, consumer behavior in e-commerce seems to be a complex subject, since consumer expectations are changing. Up to now, the concepts such as satisfaction and loyalty towards online services have been considered as a main interest of marketers (Mittal & Kamakura, 2001). Satisfaction has usually been defined as an emotional condition emerging from whether positive or negative initial expectations for the possession or consumption of a good or service has been met by the producer (Oliver, 1980). Loyalty can be seen as driving force for consumers to refuse changes in brands despite various situations (Oliver, 1997). Both customer satisfaction and loyalty, according to the marketing literature (Kim et al., 2009) is essential for a firm’s growth in profits. The literature further states that that satisfaction and loyalty are desired end states also for online retailers and service providers (Kassim & Abdullah 2010).
2
Namely, online loyalty and online satisfaction are two performance criteria for measuring the performance regarding the overall customer experience success. Therefore, there have been an immense number of studies focusing on the associations between online satisfaction and loyalty, and different online shopping attitudes and behaviors. The literature particularly states that one of the antecedents of both online satisfaction (hereafter e-satisfaction) and online loyalty (hereafter loyalty) is service quality (Janda et al., 2002). The extant literature defines e-service quality as "the extent to which a website facilitates efficient and effective shopping, purchasing and delivery” (Zeithaml et al., 2002, p. 11). In line with this body of research, our study particularly focuses on the link between e-service quality, e-satisfaction, and e-loyalty.
Additionally, the concept of culture in general has been stated as being another
antecedent for satisfaction and loyalty (Puja &Yukti, 2011). Culture is the key perspective that allows dividing people in distinct parts on a worldwide grade and accordingly diversifying them from each other (Hofstede, 1983). It is defined as the corporate programming of the human consciousness that separates the members of one human community from each of another (Hofstede, 1983). According to Riddle (1992), in service industry, cultural aspects play a
significant role in business success. In online context, consumers’ amount of use as well as levels of satisfaction and loyalty might differ from cultures to culture (Parasuraman et al., 2005). For e-commerce, companies need to adapt to cultural differences to achieve better performance (De Mooij & Hofstede, 2002). Moving from the extant body of research, our study includes culture (namely Turkish and Russian cultures) as a factor affecting the web of relationships between e-service quality, e-satisfaction, and e-loyalty. To the best of our knowledge, the comparison of Turkey and Russia in terms of e-service quality - e-satisfaction - e-loyalty relationship remains a
3
gap in the literature, which we believe, would provide valuable practical implications for managers in those cultures.
Turkey and Russia have been mentioned to possess a close trading relationship through the years, and they are both considered as being emerging countries. For instance, Russia ranks 3rd emerging markets of the world with the country incorporating 60 million internet users, which makes Russia one of the most attractive global online sales market after China and Brazil (Kearney, 2012). Turkey has been listed as the 9th country in the list of emerging countries, being ranked after Chile, Mexico, United Arab Emirates, Malaysia, Uruguay, Turkey and Oman. In addition, both countries, especially Turkey, have issues with poor financial infrastructure, regulation and logistic problems hindering the sustainable growth of online sales functions across the country (e.g. Kearney, 2012). Though both countries are reported to differ in specific
dimensions in cultural aspects in line with Hofstede’s Cultural Dimensions (2001), Turkish and Russian cultures seem to have similar points. Overall, the similarities between these two
countries either from market conditions or from cultural specifications are what makes them to be attractive for us to use them in this study. Particularly, our study aims to show whether relatively similar countries and cultures, namely Russia and Turkey, might have somewhat different effects on the network of relationships between service quality, satisfaction, and e-loyalty.
To sum up, our study focuses on understanding the comparative and cross-cultural effects of Russia versus Turkey on e-service quality’s impact on e-satisfaction and e-loyalty intentions. In line with this objective, we formulate our research question as “What is the comparative effect of e-service quality on e-loyalty intentions via e-satisfaction in Turkish and Russian online tourism context?” Our study’s contribution lies in the comparison of Russian and Turkish
4
cultures in the aforementioned relationships between service quality, satisfaction, and e-loyalty intentions regarding the fact that past research has mainly focused on these relationships within the settings of developed countries, (e.g. U.S., and Western European countries), while neglecting other markets (Nguyen & Nigel,2006; Jones et al., 2007).
The rest of the study is structured as follows: First, we start by exploring the literature and introduce the constructs that we use in this study, namely e-service quality, e-satisfaction, and e-loyalty intentions. Then, we explain our hypotheses that depict the relationships between e-service quality, e-satisfaction, and e-loyalty intentions, as well as the conditioning effect of culture on this web of relationships. We then give information prior to the research methodology that we have used in this study to collect the data needed to test our research hypotheses.
Eventually, the research discusses the key derivations, theoretical and practical implications as well as the study limitations, after sharing the study findings.
5
2 CONCEPTUAL FRAMEWORK
Three main variables in this research are service quality, customer satisfaction, and loyalty intentions. Satisfaction and loyalty have been counted in admitted theories like Expectation-Disconfirmation Theory (e.g. Oliver, 1980) or relationship marketing (e.g. Ganesan, 1994). Service quality is a ruling subject in the service management literature (e.g. Cronin et al., 2000). Despite the fact of global enhancing rivalry, the significance of service quality, loyalty and e-satisfaction in the online status is presented in the case that they assist guarantee the performance of a company (e.g. Harris and Goode, 2004; Flavian et al., 2006).
2.1 E-service Quality
E-service quality relates to "the extent to which a website facilitates efficient and effective shopping, purchasing and delivery” (Zeithaml et al., 2002, p. 11). E-service quality has been noted as a multidimensional setting shaped by factors such as efficiency, privacy, fulfillment, and system availability (Parasuraman et al., 2005). Considering this outlook, efficiency deals with the simplicity and velocity of the attainment and utilization of the site; privacy is the extent to which the site is secure and preserves customer information, fulfillment deals with the degree to which the site's commitments about commission delivery and material presence are fulfilled; and system availability shows the right technical process of the site (Parasuraman et al., 2005). Like the traditional stores, service quality of commercial websites seems to play an important role in the success and survival of websites in a competitive increasingly. On the other hand, the service quality, itself, can be effected by customers' interface quality and security perceptions, which affect the relational benefit, which in turn, is significantly related to the online
6 2.2 E-satisfaction
E-satisfaction can be defined as the contentment of a consumer relating to his or her prior purchasing experiences with a certain retail-oriented website (Anderson & Srinivasan, 2003). The significance of e-satisfaction in specifying e-loyalty has been frequently mentioned in literature (Oliver 1999; Anderson & Srinivasan, 2003; Jones & Sasser, 1995). Plenty
determinants of satisfaction will be the same or similar to those of loyalty, for instance, e-service quality and perceived value while information quality and website design play an important role in ensuring e-satisfaction. A well-organized website is charming, ease-of-use, increasing the users’ abilities and establishing long term relationship with buyers and sellers, and foretelling the success of the online business (Tarafdar & Zhang, 2008).
A good website design has great accessibility (e.g., timing, speed of loading and the quality of internet line) and great quality of website support system (Lai, Griffin, & Babin, 2000). All these characteristics of design are used to increase website performance, which in turn fosters customer satisfaction (Yuen, Law, & Wong, 2003). Besides website design, information quality has a critical role in customer’s decision-making process, as it would guide them due to absence of physical interaction with the product in the online environment. According to Guo et al. (2012), there are four dimensions of information quality identified, which respectively are accuracy, content, format, and timeliness. These four dimensions leads to the satisfaction and make loyal customers, especially those with time constraints and also to the impulsive buyers (Khristianto et al., 2012).
2.3 E-Loyalty
E-loyalty is the notion of customer loyalty in e-commerce. It is defined as: “the pursuit of engendering trust and value in your most valuable customers through effective deployment of
7
web technologies and customer support” (Reichheld & Schefter, 2000). The literature has offered various antecedents for loyalty and e-loyalty intentions. First, brand loyalty, which is the
affection of customers developed towards a particular brand over a time period, has been stated as an important factor affecting loyalty (Supphellen & Nysveen, 2001). If the extent of e-loyalty towards a particular website is high, this means that the customer will visit the website more often.
Prior research on e-loyalty has mainly focused on concepts such as customer perceived value, trust, e-satisfaction as the antecedents of customers’ e-loyalty. Furthermore, the extent of a website’s contact interactivity (i.e., effective communication between the two parties and
especially if there is a communication between a machine and a human), convenience (i.e., the ability to extent it helps users and makes navigation easy), customization (i.e., alter the products and services according to the user specification), and responsiveness (i.e., how quickly a website answers to user query)are considered to be the major antecedents of e-loyalty (Blasco, Saura, Contri, & Velazquez, 2010). At the consumer side, past research has also found that the internet expertise of a customer is influential in the formation e-loyalty. Moreover, the literature has found that satisfaction and customer loyalty are highly linked (Oliver, 1999). The literature has also stated that e-service quality is key antecedents for e-loyalty (Carlson & Sinnappan, 2003). E-loyalty, which results from the customer's satisfaction with an electronic business, in turn fosters repeat purchasing and positive word-of-mouth behavior prior to a website.
8 F igu re 1 : C on ce p tual M od el E -se rvic e qua li ty E -lo y alt y E -sa ti sfa cti on C ontroll ing va ria bles: A g e - G ende r Ma ri tal st at us Educat ion – Inco m e Lev el Moder ati n g e ffe ct: C ult ur e Eff ici enc y Pri v ac y Fulf il lm ent + A v ai labi li ty H1 11 H2 11 H3 11 H 4 a,b H 5 a,b
9
3 HYPOTHESIS DEVELOPMENT
The hypothesis is directly related to a theory but contains operationally defined variables and is in testable form. Hypotheses allow us to determine, through research, if our theory is
correct (Goodman, 1993). First three hypothesis developed in this study analyzes the direct antecedents of e-loyalty, and the relationships between antecedents, which are e-service quality and e-satisfaction. Then we analyze the moderate effect of culture on e-loyalty intentions in 4th and 5th comparative hypothesis, examining if the culture as moderate variable has the whole or partial influence in forming e-loyalty intentions. The hypothesis was developed taking the objectives mentioned in the prior chapter. According to that the aspects given below would be the hypothesis developed in order to test and achieve the objectives for this study. Figure 1 shows our conceptual model.
3.1 E-service quality impact on e-satisfaction
Kotler (2006) has stated that customer satisfaction can be developed through service quality. The higher the e-service quality will further build up e-satisfaction of the customer in online shopping atmosphere (Chang & Wang, 2011; Ou et al., 2011; Kassim & Abdullah, 2010). Parasuramanet al. (2005) built up the ES-QUAL to evaluate e-service quality and came up with 7 dimensions of e-service quality, namely: efficiency, reliability, fulfillment, privacy, responsiveness,
compensation, and contact. Particularly, four-dimensions (efficiency, availability, fulfillment, and privacy) has formed the core of customers’ motivations underlying their perceptions of a website’s e-service quality.
Looking through those dimensions, if the information at the website is well organized (i.e., website efficiency), or online privacy of the website (i.e. privacy) is well ensured, or the
10
website is truthful about its offerings (i.e. fulfillment), or the website is always available for making transactions (i.e. availability), the online customer has been mentioned to perceive have higher level of e-service quality towards a website, which in turn affects the customer’s
satisfaction with the website (Parasuraman et al., 2005). Thus, in line with the prior findings, we suggest that e-service quality is positively related to e-satisfaction. Accordingly, we formulate the following hypothesis:
H1: E-service quality has a direct and positive influence on e-satisfaction.
3.2 E-satisfaction impact on e-loyalty
According to the online relationship marketing literature, e-satisfaction is a significant
antecedent in fostering e-loyalty (Ou et al., 2011; Chung & Shin, 2008; Dagger & O'Brien, 2010; Gil-Saura et al., 2009; Sahadev & Purani, 2008). Thus, a customer with high levels of
e-satisfaction would experience high levels of e-loyalty (Dagger & O'Brien, 2010). The literature shows that if online firms aim for higher customer loyalty or e-loyalty, they should follow different strategies (e.g., to come up with the way of handling customer complaints, to collect customer feedback and suggestions on regular basis, to keep focus on the core purpose of the business such as to create value for customers to earn lifetime loyalty, etc.) to increase the satisfaction levels of the customers since satisfied customers never take the risk of moving to other competitors (Brady et al., 2001). Further, customer satisfaction is important to marketers because it is usually assumed to be a significant antecedent of intention to repurchase, which is relevant to customer loyalty (Mouri, 2005). In a similar fashion, customer satisfaction with an online website could motivate the customers to revisit and repurchase from the website (Srinivasan & Anderson, 2003). In line with this information, we formulate the following hypothesis:
11
H2: E-satisfaction has a positive influence on e-loyalty intentions.
3.3 E-service quality impact on e-loyalty intentions
The relationship between service quality and loyalty has been a controversial topic in the extant literature. On one hand, a part of the prior research (e.g. Anderson & Sullivan, 1993; Cronin & Taylor, 1992) supports that service quality has an indirect effect on loyalty through customer satisfaction (e.g., Chinese mobile communications market) (Lai et al., 2009). On the other hand, other research has considered and found a direct and significant effect of service quality on customers’ loyalty intentions, especially in the banking industry (Bitner, 1990; Bolton & Drew, 1991; Bloemer et al., 1998).
In line with offline loyalty, customers’ e-loyalty have been particularly referred as being a dynamic concept, which can be affected by numerous factors, one of which being the e-service quality (Tjiptono et al., 2008). Previous studies indicate that higher e-service quality leads to higher e-loyalty (Yaya et al., 2011; Santouridis & Trivellas, 2010; Sheng & Liu, 2010; Chenet et al., 2010). Further, the research conducted by Yaya et al. (2011) and Santouridis and Trivellas (2010) came up with the same result stating that high e-service quality can improve the
customers’ e-loyalty intentions. Therefore, e-service quality has been frequently mentioned as being one of the antecedents of customers’ e-loyalty (Herington & Weaven, 2009; Huang & Liu, 2010; Kim et al., 2007). Accordingly, we formulate the following hypothesis:
H3: E-service quality has a positive influence on e-loyalty intentions.
3.4 The role of culture in forming loyalty intentions
Worldwide marketers need to deal with the challenge of forming relationships with consumers throughout the world. Meanwhile, the improvement of the Internet has offered the chance of
12
interacting with customers through the online channel. Since loyalty attitudes of customers might be further affected by their cultural background (Harris & Goode, 2004; Oliver, 1999), it is necessary to explore the impact of different cultures on customers’ loyalty intentions. For example, Furrer et al. (2000) and Laroche et al. (2004) have suggested that the association among service quality to satisfaction and loyalty intentions might differ according to different cultural groups. Furthermore, prior research in the literature has already studied the impact of culture on customers’ loyalty in the form of cross-cultural studies, comparing hypothesized web of relationships in different cultural contexts (e.g., India vs. USA) (Puja &Yukti, 2011).
In the online context, the role of culture dimensions have been a significant issue. For instance, Steenkamp and Geyskens (2006) examined the role of Hofstede’s individualism on website perceived value while De Mooij and Hofstede (2002) have found that uncertainty avoidance or long-term orientation under Hofstede’s cultural dimensions could be used in order to differentiate countries in an international online retailing context. Particularly, some cross-cultural works have examined that relationships among service quality, satisfaction, and e-loyalty differ according to different cultures (i.e., Spain vs. Argentina) (Gracia et al., 2015). Culture being a significant factor in terms of e-service quality, e-satisfaction, and e-loyalty relationship, prior researchers have consulted to Hofstede's dimensions to compare and contrast different cultures regarding the web of relationships among these constructs (Kassim &
Abdullah, 2010; Pantouvakis, 2013; Dash et al., 2009; Furrer et al., 2000; Jin et al., 2008; Smith & Reynolds, 2009).
3.4.1 The Hofstede’s model of cultural dimensions:
The Hofstede’s model of cultural dimensions (2001) has been a popular tool emphasizing the cultural differences among different countries in the world (e.g. Steenkamp & Geyskens, 2006).
13
Having started his work on cross-cultural differences well back in the 1960s, Geert Hofstede has been a powerful name in the cross-cultural domain among scholars. The significance of
Hofstede’s cultural dimensions has become even more important by the 1990s where different studies by a collection of researchers used the tool to study the cultural differences across the world (Parboteeah et al., 2005). In line with Minkow and Hofstede (2011, p, 10), the model “became a cornerstone for cross-cultural research, providing an extremely popular method for the study of cultural differences in a wide range of disciplines, including international
management.” As of 2010, Hofstede’s cultural dimensions has been considered as a very significant tool, having been used by over 54,000 different studies (Tung & Verbeke, 2010), making Hofstede as one of the highest cited scholars in the domain of social sciences (Minkow & Hofstede, 2011).
The cultural dimensions model consists of four different dimensions: power distance, individualism/collectivism, masculinity/femininity, and uncertainty avoidance. Lately, new dimensions like pragmatism or indulgence have been further added to the framework. Each dimension is measured with scales from 0 to 100, and the study has been conducted in more than 70 countries1. Hence, each country that has been included in the study has an individual score on each cultural dimension, which further enables the cross-cultural comparison among different countries.
Nevertheless, the model is not without its limitations. Some critics suggest that the Hofstede’s cultural dimensions is highly constrained due to its limited number of dimensions. This urged some scholars to suggest that the number of dimensions should be extended (Triandis, 2004), who further emphasized that the GLOBE (i.e., Global Leadership and
1
14
Organizational Behavior Effectiveness research program) project is a more comprehensive model with theoretically sound, and verifiable cross-cultural dimensions (Northouse, 2007). First, the scholars have mentioned that unlike Hofstede’s cultural dimensions that consist of 6 dimensions recently, GLOBE has successfully attempted to extend its number of dimensions to 18. Second, some further shortcomings of Hofstede’s cultural dimensions have been improved in GLOBE project (Northouse, 2007). Despite the aforementioned criticism, Hofstede's model brings useful insights into the understanding of cultural differences such as being a compact tool that could be easily administrated by researchers throughout the world (Maddox, 1993).
Nevertheless, the cultural dimensions model should be used carefully and selectively, not systematically in full, meaning that not all dimensions should be applied but the ones which are relevant to the research (Harrison & McKinnon, 1999; Bhimani, 1999).
3.4.2 Culture as a moderator
Besides being an important antecedent of customer loyalty (Harris & Goode, 2004; Oliver, 1999), culture has further been accepted as a factor conditioning the relationship between e-service quality and e-loyalty intentions. For instance, Furrer et al. (2000) and Laroche et al. (2004) have found that e-service quality and loyalty relationships might differ within according to various cultural groups. In line with a tradition of studies focusing on the link between e-service quality, e-satisfaction, and e-loyalty intentions (Gracia et al., 2015), we consult to Hofstede’s cultural dimensions in order to examine the moderating effect of culture on the e-service quality - e-loyalty intentions relationship. Particularly, this study examines the suggested web of relationships between e-service quality, e-satisfaction, and e-loyalty intentions in the context of two countries with slight cultural differences, namely Turkey and Russia. Table 1
15
below demonstrates the respective positioning of Turkey and Russia according to the Hofstede’s cultural dimensions, forming a base for our study (Hofstede, 2001).
16
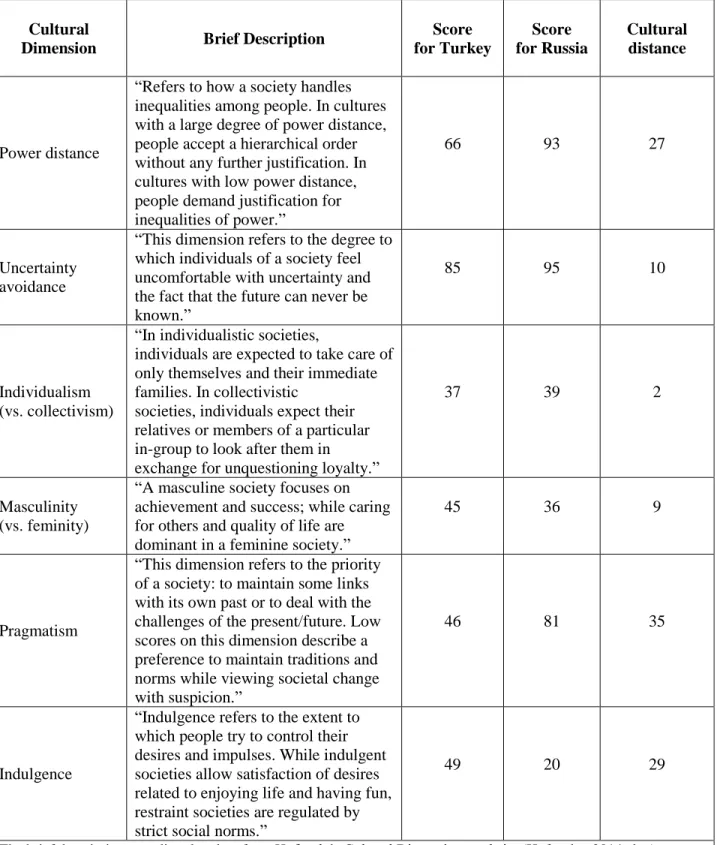
Table 1 - Cultural distance between Turkey and Russia according to Hofstede’s cultural dimensions
Cultural
Dimension Brief Description
Score for Turkey Score for Russia Cultural distance Power distance
“Refers to how a society handles inequalities among people. In cultures with a large degree of power distance, people accept a hierarchical order without any further justification. In cultures with low power distance, people demand justification for inequalities of power.”
66 93 27
Uncertainty avoidance
“This dimension refers to the degree to which individuals of a society feel uncomfortable with uncertainty and the fact that the future can never be known.”
85 95 10
Individualism (vs. collectivism)
“In individualistic societies,
individuals are expected to take care of only themselves and their immediate families. In collectivistic
societies, individuals expect their relatives or members of a particular in-group to look after them in exchange for unquestioning loyalty.”
37 39 2
Masculinity (vs. feminity)
“A masculine society focuses on achievement and success; while caring for others and quality of life are dominant in a feminine society.”
45 36 9
Pragmatism
“This dimension refers to the priority of a society: to maintain some links with its own past or to deal with the challenges of the present/future. Low scores on this dimension describe a preference to maintain traditions and norms while viewing societal change with suspicion.”
46 81 35
Indulgence
“Indulgence refers to the extent to which people try to control their desires and impulses. While indulgent societies allow satisfaction of desires related to enjoying life and having fun, restraint societies are regulated by strict social norms.”
49 20 29
17
According to Hofstede's taxonomy, Turkey and Russia have kept a similar position in terms of the majority of dimensions, with the highest cultural distances coming from pragmatism (46 vs. 81 respectively), indulgence (49 vs. 20) and power distance (66 vs. 93), as can be seen in Table 1. In line with these results, both Turkey and Russia seem to possess an individualistic culture, resistance to change and uncertain, ambiguous or undefined situations, and masculinity. However, both countries seem to differ in terms of power distance, uncertainty avoidance, pragmatism, and indulgence. Turkish society has higher levels of indulgence (with a readiness to achieve their impulses referred to enjoying life and having fun) compared to Russia whereas, Russian culture highly emphasizes pragmatism (Russian people enjoy living at the moment), uncertainty avoidance (feeling threatened by ambiguous situations), and power distance (great importance of status symbols).
In line with this backdrop, we believe that, in the online context, the relationships between e-service quality and loyalty as well as e-satisfaction and loyalty will differ in Russian and Turkish contexts. Nevertheless, the results of Hofstede’s Cultural Dimensions might seem to provide perplexing effects on e-service quality and e-loyalty intentions relationship. On one hand, Russia being a country with a higher level of uncertainty avoidance compared to Turkey, tend to use electronic media less often since the risk and uncertainty that might be associated by using e-commerce can be perceived as being high (Straub et al., 1997). In other words, internet being a technologically sophisticated medium has a certain degree of uncertainty associated with its activities such as online shopping. Thus, high uncertainty avoidance cultures would need more reassurance and uncertainty reduction features to facilitate their online purchases, and their attitudes towards websites (Hofstede, 1980, 1991). In line with this information, the effect of e-service quality on e-loyalty intentions could be higher for a Russian customer compared to a
18
Turkish customer since the high levels of e-service quality’s association with higher levels of online privacy (i.e., perception that the personal information has been protected by a website) and fulfillment (i.e., perception that the website is true about its offerings), which might further reduce the perception of risk by the Russian users. On the other hand, for Turkish people who belong to a more masculine culture, the effect of e-service quality on e-loyalty intentions could be even stronger. This is because, in line with Hofstede’s Cultural Dimensions (2014), the masculine cultures are reported as being more focused on material success, task performance, as most importantly to our case, positive product and service attributes (Furrer et al. 2000; De Mooij & Hofstede, 2002). In line with this information, a high-level of e-service quality might imply an even higher level of e-loyalty intentions for Turkish culture. In order to address these perplexing effects, we formulate two competing hypotheses, which we will test within this study:
H4a: The influence of e-service quality on loyalty intentions is greater for Russian customers.
H4b: The influence of e-service quality on loyalty intentions is greater for Turkish customers.
Our study further tests the conditioning effects of culture on the relationship between e-satisfaction and e-loyalty intentions. Similar to H4a and H4b, we also address the variability of cultural differences among Turkey and Russia by formulating two competing hypotheses. On one hand, due to its high level of uncertainty avoidant culture, we hypothesize that the
relationship between e-satisfaction and e-loyalty intentions will be greater for Russian customers. This is because, satisfaction is a guarantee for people to continue purchasing from a specific manufacturer or brand (Ranaweera, 2007). Therefore, a high level of e-satisfaction for a
19
customer towards a specific website would be a sign that (s)he would get the same level of satisfactory treatment every time (s)he visits the website, and this relationship would be stronger for cultures with high level of uncertainty avoidance who tend to avoid taking risks or unwanted surprises. Alternatively, low pragmatism cultures like Turkey are mentioned of being more reserved in terms of trying novelties, and they are reported as being more in line with traditions and norms. In this case, low pragmatist cultures could also become highly loyal to a service provider once they are satisfied with it. In other words, since those cultures avoid novelties or change, they would be less in need of shifting a specific website as long as they are satisfied with it. In line with aforementioned backdrop, we come up with the below competing hypotheses:
H5a: The influence of e-satisfaction on loyalty intentions is greater for Russian customers.
H5b: The influence of e-satisfaction on loyalty intentions is greater for Turkish customers.
20
4 RESEARCH METHODOLOGY
In order to test the hypothesized relationships, our study focuses on the domain of online tourism websites in Turkey and Russia. This chapter begins by offering information with respect to Turkish and Russian tourism industry, which we especially focus on. Further, we offer
information prior to our study design and the characteristics of the sample that we have included in this study. Eventually, we provide information about the measures that we used in this study to test the hypothesized relationships in our conceptual model.
4.1 Research Context
An important resource of profit within the global tourism industry has been attributed to the business activities of the lodges (e.g., hotels, hostels, etc.). World Trade Organization (WTO) reports that tourism has been one of the fastest growing industries within the global economy, with the industry’s income being equal or close to that of oil, food, and automotive sectors. Nowadays the tourism industry is one of the key domains in the field of international commerce and a major source of income for a number of developing countries (Georgia, Russia, Turkey, Ukraine, Jordan, Egypt, Israel, South Africa, Jamaica, Lebanon, etc). In industrialized countries, the growth in the tourism industry stimulates the development of many related industries - from construction and agriculture to telecommunications. Today, the global tourism activities accounts for 9% of world GDP while everyone ineleventh busiest in the world is engaged in tourism; 6% of total world exports are tourism and it also accounts for 30% of all services in the world (Kyrkilis, Taxiarchis, Delis & Pantelis, Pantelidis, 2013; WTO, 2016).
21 4.1.1 Tourism industry of Turkey
Turkey has been known as a country with a relatively young population; whose endless strength and dynamism ought to be used as a powerful production input. The Turkish tourism industry plays an important role regarding the country’s economic development, and provides
employment to the significant part of the younger population. From 18.8 million employed of the Turkey in 1992, the number of people working in tourism sector was 2 million. In 2000, this number increase to 3.5 out of 20 million; when 2 years later in 2001, it arrived at 4 million, which in percentage is 5% among all sectors: (CIA, 2003). Turkey has been a significant destination for both local and foreign tourists where the number of tourist arrivals in 2012 has exceeded 31 million (TURSAB, 2014). There is a consensus of opinion supported by research findings that the Turkish tourism will continue to grow at a high rate than the remaining European countries and the world in general ensuring that the future prospects of the Turkish tourism industry in the long term is very bright (Association of Turkish Travel Agencies, 2012).
4.1.2 Tourism industry of Russia
In recent years, modern Russia started to pay great attention to the development of tourism as a promising local industry, which could allow many regions of the country to develop in economic terms. According to a report that has been published by World Economic Forum in 2007, the Russian Federation took 68th place in the rating of tourism industry competitiveness among 124 world countries (Blanke & Chiesa, 2007). Despite the global economic crisis of 2008, Russia still managed to improve its international rating in world tourism competitiveness. For instance, in 2009, Russia has become the 59th country among 133 world countries, ranking between Poland and Venezuela (Blanke & Chiesa, 2011). In 2011 rankings, Russia was still the 59th
22
country, but among 139 countries (Blanke & Chiesa, 2013). The final reports do also show that the national tourism industry in Russia is in a continuous growth (Crotti & Misrahi, 2015).
4.2 Research Design
In the present study, a positivistic approach has been used as it relies mainly on quantitative data, using relatively large samples and is concerned with hypothesis testing, structured research design and objective method using cross-sectional design. Furthermore, we used online survey tool for data collection purposes. The questionnaire was designed to answer our specific research question for this study, which is: "What is the comparative effect of service quality on
e-loyalty intentions via e-satisfaction in Turkish and Russian online tourism context?” This part discusses each of these terms with respect to our study in detail.
4.2.1 Research philosophy
The positivist and phenomenological paradigms are two key research paradigms in the literature. According to the positivist paradigm, the social world happens to be extern property, which is measured through objective techniques, rather than being the reason of emotions, perception, or reflections (Easterby-Smith et al., 1991). Contrary, phenomenologist claims to positivist that social world of any firm and organization is too complex to define estimation in an analogous way as the material sciences (Saunders et al, 2007). Hereby, the phenomenological concept is centered on actualizing human behavior from the candidate's own frame of the pattern (Collis & Hussey, 2003). In order to make empirical testing of formulated hypotheses, usually, quantitative methods are used in the positivist studies (Buttery & Buttery, 1991). Positivist studies mainly obtain data through surveys with relatively large samples, and employ statistical methods to analyze the data in order to come up with a result (Collis & Hussey, 2003). This study uses a positivist approach.
23 4.2.2 Research Method
Quantitative methodology, which is used by positivist studies, are generally based on the logic of deduction, using prior theories as an underlying framework for hypothesized web of
relationships, and testing them based on statistical tools. Quantitative methodology has been associated with objective truth, while its counterpart, namely qualitative research, tends to focus on subjective experience and judgments (Neuman, 2009; Newman & Benz, 1998). Quantitative research places a heavy emphasis on using formalized standard questions and predetermined response options in the questionnaires which have to beconducted with a relatively large number of respondents for ensuring statistical quality. In line with above backdrop, our study employs a quantitative research methodology.
4.2.3 Time Horizon
A research study might include either a cross-sectional or a longitudinal design. Cross-sectional design is defined as the research where the data is acquired from a certain sample or population just once. There are single or multiple cross-sectional designs. The single cross-sectional design is the design where the data is obtained once from just one sample pulled from the target
population. Contrary, the multiple cross-sectional design is the design where the data is reached once each from more than one sample (Malhotra & Birks, 2003). Longitudinal designs are the research type where a specific sample or population is examined continuously through some period of the time. In contrast to cross-sectional designs, longitudinal designs vary in the content that they examine only one or particular samples. Longitudinal designs propose an in-depth outlook of the fact throughout the time when cross-sectional designs are just focused on the insight of the fact at a certain time period. Accordingly, the longitudinal design offers an in-depth insight of the condition and the changes coming out over time. In the present study
cross-24
sectional design is used, as the information from any particular sample of population element is gathered just once, and does not combine a repeated procedure of data collection (Hair et al., 2003).
4.2.4 Data Collection
Malhotra (2006) allocates primary and secondary data collection from each other, observing primary data as the data accumulated by the researcher in order to direct or eliminate the certain problem defined for the research project. The information which hasn't been used in the previous researches and has been collected by the researchers for the first time are known as the original data collection sources, namely primary data (Krishnaswamy & Satyaprasad, 2010). On the contrary, secondary sources are the existing data that has been collected for another purpose than solving the problem at hand (Stewart, 1984; Frankfort-Nachmias & Nachmias, 1992). The secondary data is formed out of data that are existing to use by the researchers and have been examined before (Krishnaswamy & Satyaprasad, 2010). Malhotra defines the secondary data as information that has been collected for other purposes (Malhotra, 2006). This study will focus on the collection and analysis of primary data.
The data collection tool that we have used for this study was a web-based questionnaire, in other words, online survey. Surveys arewell-known tools of collecting primary data and are directed using questionnaires (Kumar, 2000). The web survey software is a popular tool for carrying out online surveys (McDaniel & Gates, 2007). The scholars state that the advantages of online surveys are way more the disadvantages (Hair, 2006). Online surveys with its high quality, time and money saving characteristics have many advantages over traditional methods (Aaker et al, 2000). Moreover, the advantage of applying to the online survey is that the
25
can be reached immediately. Compare to other methods online survey is less expensive and fast. However, while using this method possible problems may come out, for example, the bias when respondents fill the questionnaire more than one time. The low response rate is the contrary problem which might occur. Overall, Internet survey can be reviewed as a more beneficial method than other traditional methods due to the popularity and high usage of the Internet (Malhotra, 2010).
At the beginning of our study, the surveys were prepared in English, and included the measures given in the following section, as well as a demographics section. Two bilingual translators have translated the surveys into Turkish based on the group and back translation methods (Brislin, Lonner, & Thorndike, 1973). A third translator translated the Turkish version of the survey back in English, and confirmed that the Turkish and English versions of the survey are adequate. Exactly the same process was done for the Russian survey.
4.3 Sample Design
In the general research context, basically, there are two approaches to choose, which are a census or a sample. A census is a tool of information source usage that includes an examination of every single part of the population, while, the sample applies to the subgroup of the population that is chosen for the participation in the research (Malthotra, 2011). Due to a number of reasons, the sample source is chosen as the information source in this study. First reason is the limited access to the whole population, thus focusing on the selected sample which represents the population is more beneficial. As long as the depiction of the sample is maintained, a generalized outcome can be made from the drawn sample. Moreover, a suitable sample is selected for this research study in order to ensure the representativeness of the chosen sample. Furthermore, this study follows
26
the sampling procedure steps such as defining the population, selecting sampling frame, choosing sampling method, and defining sample size (Malhotra, 2011).
4.3.1 Defining the population& sampling frame
Each individual member is applied to as a population element (Zikmund & Babin, 2010). The study is directed to the total population which part is the target population (Churchill et. al., 2010). The target population is the group from which the sample will be drawn (Tustin et al., 2005). The idea behind sampling is that by picking up only specific components of that population, a researcher may come up with outcomes about the whole population (Cooper & Schindler, 2003). For researchers, it is substantial to employ a representative sample of the population in order to generalize the findings (Hair et al., 2010).
After identifying the target population, the next step is to establish the sample frame. The sampling frame can be specified as a representation of the components of the target group which is formed from a list or set of aspects defining the target population of the study (Malhotra & Birks, 2003). The sample used in this study has been as individuals between age 18 to 65 years old, male/female, and uses at least one of online tourism websites. Since the study focuses on the comparison of Turkish vs. Russian context, the study has only recruited the inhabitants of both countries. Furthermore, the next step in the process is sampling frame or sampling list where the researchers consider where they are capable of employing data from the population of interest. (Malhotra & Birks, 2003). In respect of the thesis, Facebook and VK.ru were accepted as the latent sampling frame for directing the questionnaire since the communication with the distinguished target group is generally affordable through this tribune.
27 4.3.2 Sampling method
There are two kinds of sampling, namely non-probability sampling and probability sampling. The probability sampling is used when each member of the population is known and there is "non-zero" chance of being involved in the sample (Fox & Bayat, 2007). According to Ross (2004), the probability sampling methods make it feasible to define the mathematical probability of sample attributes being duplicated in the population. On the other hand, non-probability sampling is examined as a set of techniques where the possibility of choosing each sampling element is not known and the choice of sampling elements is made in accordance with the researchers’ decision or experience. The non-probability sampling, therefore, follows a
subjective approach (Cooper & Schindler, 2006; Hair et al., 2000). In this case, non-probability sampling will depend on the individual decision of the researcher opposing with the probability sampling where the sample is chosen by chance (Malhotra, 2010). Non-probability sampling was employed to make sure that a number of survey sample indicates the population. Non-probability sampling was anticipated to reduce cost and could enlarge the progress of suggested model (Malhotra, 2010). Furthermore, type of non-probability sampling used in this research is convenience sampling.
Convenience sampling goes under a rank of non-probability sampling and is generally used by a researcher that search for getting a sample of convenient factors. Constantly, here a candidate will be depicted because they merely occurred in the proper place or at the right time (Malhotra, 2010). Convenience sampling is described as a method where components of a sample are selected from a group or sub-population which is easily valid (Tashakkori & Teddlie, 2003). In accordance with Welman and Kruger (2001), it is a more suitable method, as it is easier to access to the population which participates in the research. Thus, a non-probability,
28
convenience sampling has been used in this study. This sampling method intends to pick up a sample of convenient components in a fast and economical way (Malhotra, 2010). Furthermore, the convenience sampling method can be privileged over other sampling techniques on account of the sample being attainable and common (Malhotra, 2010).
4.3.3 Sample size
The subsequent step in the sampling process includes the researcher’s specification about the size of the sample which (s)he is going to take out the information from. The sample size applies to the number of components that is planned to be involved in the study. Determining a sample size is a critical process, as in the end, it will propose the researcher with an index of how generalizable the outcomes will be to the bigger population. In general, an enhanced sample size will lead to a greater accuracy (Malhotra, 2010). There are some issues that should be taken into consideration while applying for a web-based survey, which are a lower response rate than for other survey methods (Brawner, Felder, Allen, Brent, & Miller, 2001) and multiple responses (Brawner, et al., 2001; McDaniel & Gates, 2002). In line with this information, we first sent the surveys to 519 participants from Turkey and Russia. At the end of the data collection process, a total number of 315 completed surveys have been collected, which is equivalent to a response rate of 62%.
4.4 Measurement
In order to measure the relevant constructs in our study, the following measures were employed. Each measure used a five-point Likert scale (1-strongly disagree; 5-strongly agree) except the country information.
29 4.4.1 E-service quality
We measured e-service quality by using the E-S-EQUAL scale that we borrowed from Parasuraman et al. (2005). The scale consists of four dimensions, namely efficiency (EFF), privacy (PRI), fulfillment (FUL), availability (AVA) and 12 items with and three items of each dimension were selected according to empirical validation processes on e-service quality multi-dimensional scales in previous works (Cristobal et al., 2007; Janda et al., 2002), such as “This website makes easy to find what I need”, “This website protects information about my actions at the website”, and “This website is always available for making transactions”.
4.4.2 E-satisfaction
Satisfaction is defined as the measurement of an emotion (Cronin et al., 2000; Hunt, 1977) and it is measured through a cognitive and affective dimension used by Cronin et al., (2000). The cognitive satisfaction is operationalized with four items. As for the affective satisfaction a four-item scale of satisfaction was used (Janda et al., 2002; Smith & Barkley, 1997), such as “Base on my experience with this website, I feel very satisfied”, “Overall, my relationship with this
website has satisfied my expectations”.
4.4.3 E-loyalty
Loyalty is defined as the manifestation of the consumer’s preference for a company over others, the intention to continue purchasing or increase business with the company in the future and measured with a 3 item scale based on the scales of Algesheimer et al. (2005), and Bhattacherjee (2001), such as “My intentions are to continue using this website rather than any alternative mean”.
30 4.4.4 Culture
We operationalized culture directly by recording participants’ country, namely Turkey and Russia. In order to be included as a moderating variable, we further coded the culture as a binary variable with Turkey being 0, and Russia being 1.
4.4.5 Control Variables
As control variables, we have included demographic characteristics, namely age, gender, income, education to eliminate any alternative explanations concerning our hypothesized relationships.
31
5 RESULTS
5.1 Respondent characteristics
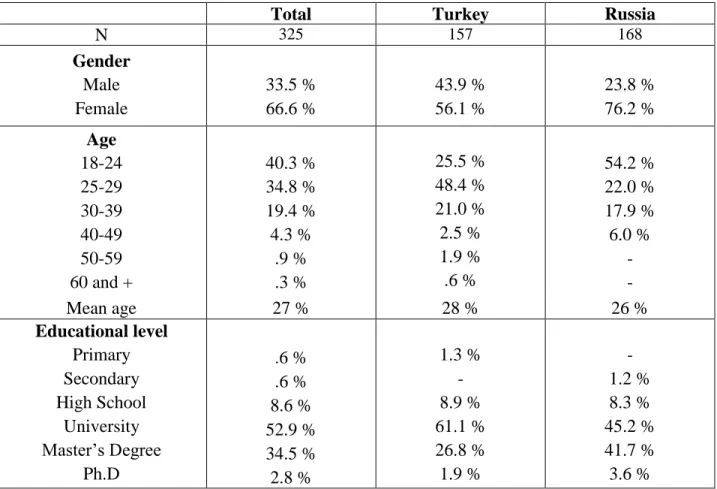
Table 2 demonstrates the demographic characteristics of the participants in total and according to the countries (Turkey and Russia) used in the study. In total, 66.6% of the study’s participants are female and 33.5% are male. The age of the participants dominantly ranges between 18-24 (40.3%), followed by participants whose ages range between 25-31 (25.5%), 35-44 (21.0%), 45-54 (2.5 %), 55-64 (1.9 %), 65 and higher (0.6 %). 61.1% of the participants are university graduates whereas 8.9 % graduated from high school. A significant portion of our sample (26.8 %) reported that they completed a graduate degree.
Table 2 - Sample information and distribution of participants' demographic characteristics of Turkey and Russia
Total Turkey Russia
N 325 157 168 Gender Male Female 33.5 % 66.6 % 43.9 % 56.1 % 23.8 % 76.2 % Age 18-24 25-29 30-39 40-49 50-59 60 and + 40.3 % 34.8 % 19.4 % 4.3 % .9 % .3 % 25.5 % 48.4 % 21.0 % 2.5 % 1.9 % .6 % 54.2 % 22.0 % 17.9 % 6.0 % - - Mean age 27 % 28 % 26 % Educational level Primary Secondary High School University Master’s Degree Ph.D .6 % .6 % 8.6 % 52.9 % 34.5 % 2.8 % 1.3 % - 8.9 % 61.1 % 26.8 % 1.9 % - 1.2 % 8.3 % 45.2 % 41.7 % 3.6 %
32 Marital status Married Single 22.8 % 77.2 % 19.7 % 80.3 % 25.6 % 77.2 % Income level <1000 TL 1000 – 1999 TL 2000 – 2999 TL 3000 – 4999 TL 5000 – 7499 TL 7500 – 9999 TL >10000 TL 12.9 % 13.2 % 17.2 % 19.4 % 11.4 % 12.3 % 13.5 % 12.1 % 19.1 % 26.8 % 28.0 % 7.6 % 3.2 % 3.2 % 13.7 % 7.7 % 8.3 % 11.3 % 14.9 % 20.8 % 23.2 %
5.2 Exploratory Factor Analysis
Exploratory factor analysis (EFA) summarizes the information from a large number of measurement variables into a small number of latent variables, or factors (Hair et al., 2011). Further, the exploratory factor analysis identifies relationships between variables and can compile them in groups and thereby gives an understanding of the data (Hair et al., 2011). In case of an a priori theory, a confirmatory factor analysis (CFA) is recommended, whereas an exploratory factor analysis (EFA) should be used when no prior structural hypotheses are available (Hair, Anderson, Tatham, & Black, 1998).In this study, EFA was carried out in the statistical program SPSS.
5.2.1 E-service quality
We determined the dimensions of e-service quality in our study via conducting an exploratory factor analysis (EFA). We performed principle component factoring and Varimax rotations when conducting EFA. Principal Components analysis is used to extract maximum variance from the data set with each component thus reducing a large number of variables into smaller number of components (Tabachnick & Fidell, 2007).Varimax minimizes the number of variables that have
33
high loadings on each factor and works to make small loadings even smaller (Costello &
Osborne, 2005). First, Kaiser-Meyer-Olkin (KMO) measure of sampling adequacy and Bartlett’s test of sphericity, which determine whether the data is appropriate for conducting EFA we reevaluated (Sharma, 1999). According to the literature, the variables are sufficiently inter-correlated when a value of KMO is higher than 0.5, and a significant Bartlett’s test of sphericity is lower or equal to 0.05 (Field, 2000), and is required in order to conclude that the data is appropriate for conducting EFA. The findings of our EFA for e-service quality show that, our data is appropriate forrunning an EFA for e-service quality with KMO=.911, and Bartlett’s Test of Sphericity is significant (p=.000) (See Table 3)
Table 3 - KMO and Bartlett’s Test Results for E-Service Quality
Kaiser-Meyer-Olkin Measure of Sampling Adequacy. .911
Bartlett's Test of Sphericity
Approx. Chi-Square 2649.199
Df 66
Sig. .000
We then examined the anti-image correlation matrix in order to determine whether the diagonal values are all over .50 signifying that each item under the e-service quality could be included to the EFA (Field, 2000). Since the anti-image correlation values for all the items in e-service quality are above .50, our results show that each item is fit for being included in EFA (See Table 4).
34 T ab le 4 Anti -Im ag e C or re lation Valu es 1 2 3 4 5 6 7 8 9 10 11 12 1. T his w ebs it em akes eas y to fi nd w ha t I ne ed .937 a -.198 -.146 -.110 -.049 .212 -.092 -.127 -.119 -.133 -.024 -.002 2. In fo rm a ti on at thi sw eb si te i s w el l-o rgan iz ed -.198 .931 a -.303 -.004 -.007 -.012 -.081 .011 -.150 .053 .009 -.037 3. T his w ebs it ee nab les m e toge t on q ui ckl y -.146 -.303 .927 a -.021 -.090 .085 -.130 .000 .070 .044 -.219 -.116 4. T his w ebs it epro tec ts in form a ti on abou tm ya ct ions at t h ew ebsi te -.110 -.004 -.021 .838 a -.636 -.289 .119 -.129 -.019 -.004 -.009 .051 5. T his w ebs it es ho w sconc ern for thepr iva cy o f it su se rs -.049 -.007 -.090 -.636 .840 a -.277 -.002 .066 -.122 -.016 .100 -.028 6. T his w ebs it edoe s not share m ype rs ona li n for m a ti on w it hothe rc o m pan ies .212 -.012 .085 -.289 -.277 .886 a -.261 -.055 -.014 .137 -.085 -.146 7. T his w ebs it ee nab les m e toeas il yacc es st he se rv ice st hat I w an t -.092 -.081 -.130 .119 -.002 -.261 .935 a -.254 -.017 -.153 -.092 .019 8. T h e se rvi ce s a t t h is w eb si tear ed el ive re d as prom ise d -.127 .011 .000 -.129 .066 -.055 -.254 .937 a -.333 .017 -.125 -.091 9. T his w ebs it e i s t rut h fula bou ti tso ff eri ng s -.119 -.150 .070 -.019 -.122 -.014 -.017 -.333 .944 a -.130 -.021 -.124 10. T his w eb si te is al w aysav ai labl ef o rm ak in gt rans act ions -.133 .053 .044 -.004 -.016 .137 -.153 .017 -.130 .919 a -.345 -.189 11. T his w eb si te laun che sa nd runsr ighta w ay -.024 .009 -.219 -.009 .100 -.085 -.092 -.125 -.021 -.345 .908 a -.385 12. T his w eb si tepe rf o rm sw el lw hen I ent er m y in fo rm at ion -.002 -.037 -.116 .051 -.028 -.146 .019 -.091 -.124 -.189 -.385 .934 a
35
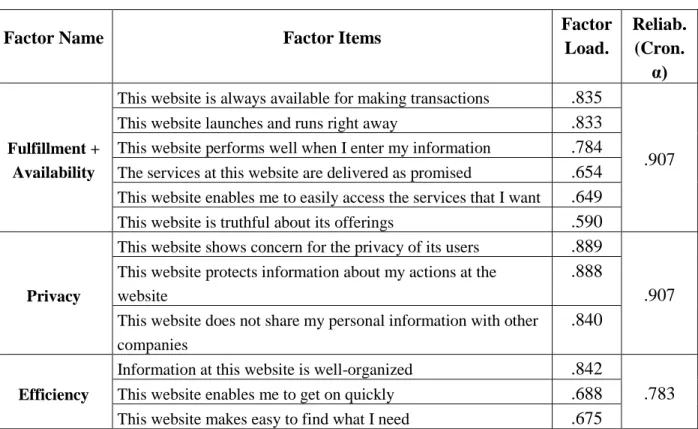
According to the results of Rotated Component Matrix, the items under each of the three factors are reported on Table 5. We ran a reliability analysis for each factor afterwards, which returned the following Cronbach’s α values for each factor: .907 for Factor 1, .907 for Factor 2, and .783 for Factor 3. Since the minimum acceptable value for Cronbach’s α is .70 (Saunders et al., 2009), the reliability of each of our factors that we extracted from e-service quality data is satisfactory. We accordingly named Factor 1 as Fulfillment and Availability, Factor 2 as Privacy, Factor 3 as Efficiency.
Table 5 - The Results of Rotated Component Matrix
Factor Name Factor Items Factor
Load. Reliab. (Cron. α) Fulfillment + Availability
This website is always available for making transactions .835
.907 This website launches and runs right away .833
This website performs well when I enter my information .784 The services at this website are delivered as promised .654 This website enables me to easily access the services that I want .649 This website is truthful about its offerings .590
Privacy
This website shows concern for the privacy of its users .889
.907 This website protects information about my actions at the
website
.888
This website does not share my personal information with other companies
.840
Efficiency
Information at this website is well-organized .842
.783 This website enables me to get on quickly .688
This website makes easy to find what I need .675
5.2.2 E-satisfaction
Same procedure as for e-service quality (EFA) was done for e-satisfaction. We applied principle component factoring and Varimax rotations when conducting EFA for e-satisfaction. The
36
e-satisfaction with KMO=.814, and Bartlett’s Test of Sphericity is significant (p=.000) (See Table 6)
Table 6 - KMO and Bartlett’s Test Results for E-Satisfaction
Kaiser-Meyer-Olkin Measure of Sampling Adequacy. .814
Bartlett's Test of Sphericity
Approx. Chi-Square 690.909
Df 6
Sig. .000
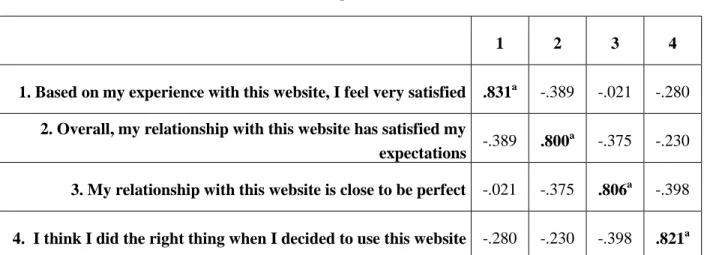
Afterwards we analyzed the anti-image correlation matrix in order to define whether the diagonal values are all over .50 signifying that each item under the e-satisfaction could be included to the EFA (Field, 2000). Since the anti-image correlation values for all the items in e-satisfaction are above .50, our results show that each item is fit for being included in EFA (See Table 7).
Table 7 - Anti-Image Correlation Values
1 2 3 4
1. Based on my experience with this website, I feel very satisfied .831a -.389 -.021 -.280
2. Overall, my relationship with this website has satisfied my
expectations -.389 .800
a
-.375 -.230
3. My relationship with this website is close to be perfect -.021 -.375 .806a -.398
4. I think I did the right thing when I decided to use this website -.280 -.230 -.398 .821a
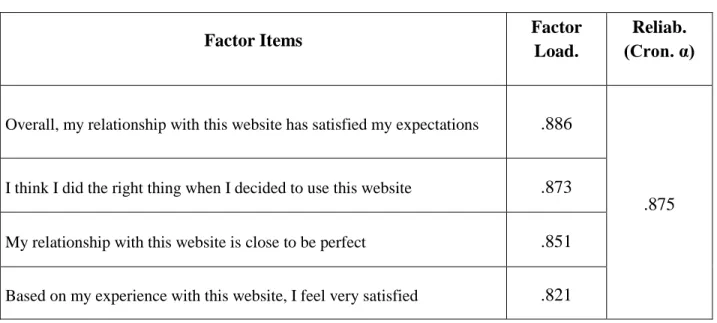
In accordance with the results of Rotated Component Matrix, the items under the factor are reported on Table 8. We operated a reliability analysis for the factor afterwards, which returned the following Cronbach’s α value of .875 for the factor. Since the minimum acceptable
37
value for Cronbach’s α is .70 (Saunders et al., 2009), the reliability of the factor that we extracted from e-satisfaction data is satisfactory.
Table 8 - The Results of Rotated Component Matrix
Factor Items Factor
Load.
Reliab. (Cron. α)
Overall, my relationship with this website has satisfied my expectations .886
.875 I think I did the right thing when I decided to use this website .873
My relationship with this website is close to be perfect .851 Based on my experience with this website, I feel very satisfied .821
5.2.3 E-loyalty
We went through the same procedure as for service quality and satisfaction (EFA) for e-loyalty. The principle component factoring and Varimax rotations were operated while
conducting EFA. The findings of our EFA for e-loyalty indicate that, our data is convenient for operating an EFA for e-loyalty with KMO=.751, and Bartlett’s Test of Sphericity is significant (p=.000) (See Table 9).
38
Table 9 - KMO and Bartlett’s Test Results for E-Satisfaction
Kaiser-Meyer-Olkin Measure of Sampling Adequacy. .751
Bartlett's Test of Sphericity
Approx. Chi-Square 886.326
Df 3
Sig. .000
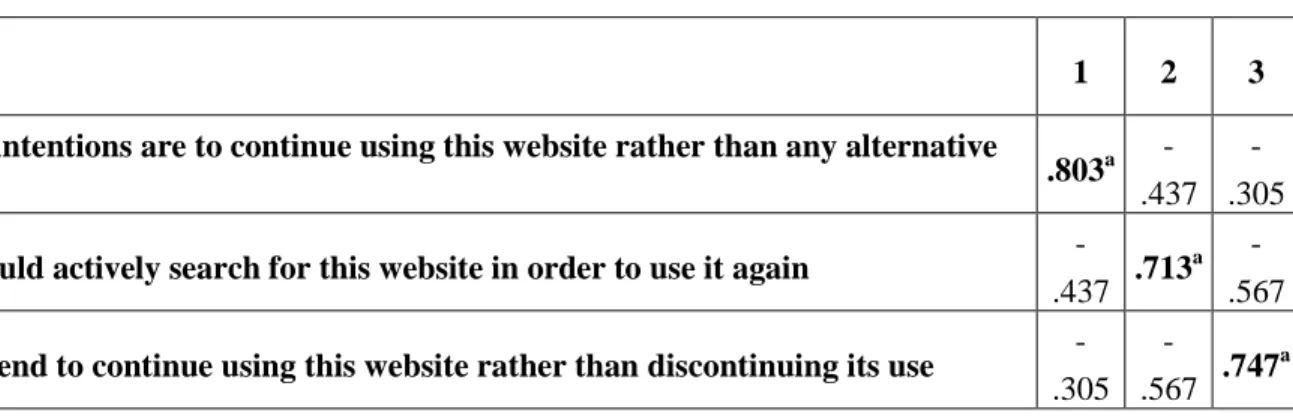
We then analyzed the anti-image correlation matrix in order to define whether the diagonal values are all over .50 signifying that each item under the e-loyalty could be included to the EFA (Field, 2000). Since the anti-image correlation values for all the items in e-loyalty are above .50, our results show that each item is fit for being included in EFA (See Table 10).
Table 10 - Anti-Image Correlation Values
1 2 3
1. My intentions are to continue using this website rather than any alternative
mean .803
a
-.437 -.305
2. I would actively search for this website in order to use it again
-.437 .713
a
-.567
3. I intend to continue using this website rather than discontinuing its use
-.305
-.567 .747
a
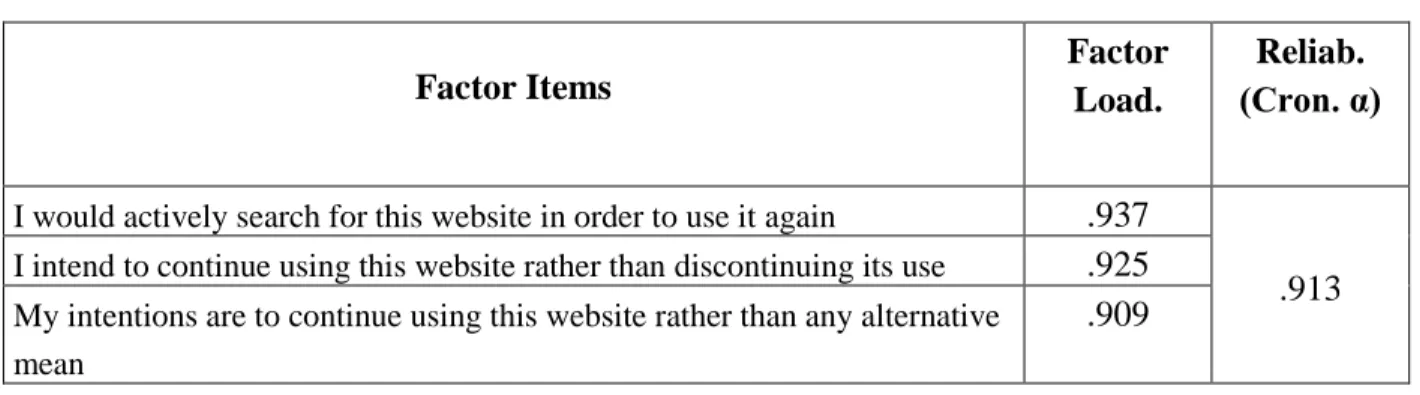
Considering the results of Rotated Component Matrix, the items under the factor are presented on Table 11. We operated a reliability analysis for the only factor of e-loyalty afterwards, which returned the following Cronbach’s α value of .913. Since the minimum acceptable value for Cronbach’s α is .70 (Saunders et al., 2009), the reliability of the factor that we extracted from e-loyalty data is satisfactory.