Journal of Economy Culture and Society
ISSN: 2602-2656 / E-ISSN: 2645-8772Research Article / Araştırma Makalesi
The Nexus Between the Democratic
Transition and the Structural Transformation
Demokrasiye Geçiş ve Ekonomide Yapısal Dönüşüm
Arasındaki İlişki
Deniz GÜVERCİN
1, Adem GÖK
21Istanbul Arel University, International Trade and Finance Department, Faculty of Economics and Administrative Sciences Istanbul, Turkey
2Kırklareli University, Faculty of Economics and Administrative Sciences, Kırklareli, Turkey ORCID: D.G. 0000-0001-6158-3877; A.G. 0000-0002-3786-2507 Corresponding author: Adem GÖK,
Kırklareli University, Faculty of Economics and Administrative Sciences, Kırklareli, Turkey E-mail: [email protected] Submitted: 28.03.2019 Revision Requested: 04.04.2019 Last Revision Received: 01.01.2020 Accepted: 21.04.2020
Published Online: 28.04.2020 Citation: Guvercin, D., Gok, A. (2020). The nexus between the democratic transition and the structural transformation. Journal of Economy Culture and Society, 61, 173-187. https://doi.org/10.26650/JECS2019-0032
ABSTRACT
There are several theoretical and empirical papers on the structural transformation but there is not a study relating structural transformation with the political regime switch in the country. This paper aims to fill the gap in relevant literature by empirically examining the linkage between the political regime switch and the structure of the economy. The main purpose of this paper is to explore the impact of the political regime switch on the share of the agricultural value added in the GDP. Due to endogeneity issues, Difference GMM methodology is used to test the hypothesis that the democratization leads to the structural transformation of the economy by using data for 43 countries over the period from 1970-2016. The estimation results confirm that the share of agricultural value in total value added is higher when the country is ruled by an autocratic system rather than a democratic system. Moreover, the estimation results indicate that per capita GDP, arable land, and trade openness have a negative significant, whereas financial development, fertility, and population have a positive significant impact on the value added share of agriculture.
Keywords: Structural transformation, democratic transition, engels’ law,
median voter theorem, difference GMM
ÖZ
İlgili literatürde ekonominin yapısal dönüşümü üzerine birçok teorik ve uygulamalı çalışma bulunmasına rağmen, politik sistem değişikliğiyle ekonominin yapısal dönüşümünü beraber inceleyen çalışma bulunmamaktadır. Bu çalışma ilgili literatürde bulunan bu boşluğu doldurmayı ve politik rejim değişimleri ve ekonomideki yapısal dönüşüm arasındaki ilişkiyi ekonometrik olarak incelemeyi amaçlamaktadır. Bu çalışmanın amacı politik sistem dönüşümünün, otokratik politik sistemden demokratik politik sisteme geçişin, tarım sektörünün gayrisafi yurtiçi hasıladaki payı üzerine etkisini incelemektir. Otokratik politik sistemden, demokratik politik sisteme geçişin ekonomide yapısal dönüşüme neden olacağı hipotezini içsellik sorunlarından dolayı tercih
ettiğimiz Fark GMM ekonometrik metodolojisi kullanılarak test ettik. Çalışmada kullanılan gözlemler 43 ülke ve 1970-2016 yılları arası için geçerlidir. Uygulama sonuçları tarım sektörünün gayrisafi yurtiçi hasıladaki payının, ülkeler otokratik politik sistemden demokratik politik sisteme geçiş sağlamalarıyla azalacağını göstermektedir. Uygulama sonuçları ilgili katsayı büyüklüğünün tüm modeller dikkate alındığında -0.590 ve -1.172 arasında değiştiğini göstermektedir. Buna ilaveten, uygulama sonuçları kişi başı gayrisafi yurtiçi hasıla, ekilebilir alan büyüklüğü ve ekonominin dış ticarete açıklığındaki değişimlerin tarım sektörünün gayrisafi yurtiçi hasıladaki payı üzerine etkisinin negatif anlamlı olduğunu, bir diğer taraftan finansal kalkınma, doğurganlık ve nüfustaki değişimlerin ise etkisinin pozitif anlamlı olduğunu göstermektedir.
1. Introduction
According to the International Labor Organization Database, the share of agricultural emp-loyment in the world total empemp-loyment was 42% in 1991, and 29% in 2017. According to WDI (2018), the world agricultural share of value added as GDP was 8% in 1995, and 4% in 20171. The
data also indicates the presence of a monotonic decrease in the share of agricultural employment as total employment through the years. Therefore, the agricultural sector is losing its significance in terms of generating income and employment.
The literature on the declining role of the agricultural sector in general economy is centered around the argument that the rising income of nations would lead to the structural transformation of the economy. Clark (1940), Kuznets (1966) and Syrquin (1975) argue that the share of labor emplo-yed in the agriculture sector as total employment and agricultural output in total output decline with the income per capita. Therefore, depending on the share of agriculture in the economy, the stage of economic development in a country might be inferred from this view. Moreover, Herrendorf et al (2014) infer that employment and value added shares of the manufacturing sector increase at initial stages of development, but decrease at latter stages of development. Industrialization at the initial stage of economic development where the transition from agriculture occurred was the main driver of economic activity. However, deindustrialization has taken place after a certain period in the wor-ld where the services sector has increased its share in employment and GDP.
Arguments for industrialization and agricultural transition are based on supply and demand side explanations. Kongsamut et al. (2001) and Gollin et al. (2002) argued that structural transformation arises mainly due to the difference between the incomes elasticities of goods produced in different sectors. According to this view, the non-homotheticity of preferences lead to a variation in the margi-nal rate of substitution between goods produced in different sectors as the economy grows, leading to a variation in growth rates between sectors. Ngai & Pissarides (2007) argue that employment and value added shares from the manufacturing sector decreases due to decreases in relative prices indu-ced by variation in TFP growth rates across sectors. On the other hand, there are also other arguments based on human capital and physical capital deepening. Acemoglu & Guerrieri (2008) focus on capi-tal intensities in explaining sectoral, non-balanced growth. They argue that capicapi-tal intensive sectors will grow more as the capital becomes more abundant in the overall economy.
Although there are several explanations based on economic arguments, the literature lacks the empirical evaluation of the transition from an agriculture-based economy following a political regime switch. In the 19th century, many countries underwent a transition to a democratic system.
Most of the countries that experienced a democratic transition also experienced an increase in GDP, industrialization, and capitalism. Therefore, the co-movement of regime switches and stru-ctural transformation of the economy needs to be explored empirically.
The Democratic transition and industrialization are transformations that occur in politic and economic spheres of society. We argue that a political regime switch, from autocracy to democra-cy, has generated an economic environment compatible with it, so that a democratic transition leads to a transformation of market structure, incentive structures, and in the allocation of resour-ces resulting in a structural transformation. Therefore, whether the political regime transition induces a change in economic structure is the main question this paper seeks to answer. A Democratic transition affects power relations, social relations as well as resource allocati-ons across production units which in turn affects the structure of the economy. Murtin &
arg (2011, p.1) state, “The democratic transition partly overlaps with other socioeconomic trends, chiefly the demographic transition, and the process of industrialization and modernization with which it is associated”.
Acemoglu and Robinson (2001, 2006) and Acemoglu et al. (2008) claim that in a democratic system; the uncertainty over future economic relations are resolved and the commitment on the distribution of income prevents the wide opening between poor and rich, which, prevents social unrest. In this sense, it can be argued that the resolution of the uncertainty over the future political state of the world decreases the discount rate of future cash flows for investment projects, and increases the number of feasible long run investment projects leading to long run economic growth. Since the present value of future cash flows increases, long run investment projects such as the increase in new technology and human capital, which requires a long run liquidity commit-ment and generates positive economic externalities would be undertaken (Romer,1990; Levine, 1991). Therefore, a decrease in the riskiness of the investment increases the technology invest-ments (including high cost infrastructure investment) that would result in capital deepening lea-ding to the structural transformation (Acemoglu & Guerrieri, 2008).
In Acemoglu & Robinson (2001, 2006) and Acemoglu et al. (2008) regime transition is the equilibrium phenomenon, which also indicates commitments to future redistribution. A Democ-ratic transition enables taxation of assets in favor of lower income classes thanks to the median voter’s tax preferences. Furthermore, in early studies on democracy and income distribution, Lenski (1966), Boix (1998), Chan (1997) argued that poor segments would demand more redistri-bution through democratic channels. Therefore; the theoretical median voter’s tax preferences and related redistribution in the democratic regime (Meltzer & Richard, 1981) along with demand side explanations using Engel’s law by Kongsamut et al. (2001), Gollin et al. (2002, 2007) could be linked to explain the impact of a regime switch on economic transformation.
Additionally, a political regime switch might increase trade activities that induce structural transformation. There are studies (Milner & Kubota, 2005; Aidt & Gassebner, 2010) arguing that trade barriers are used as a strategy for building political support. Trade induces superior techno-logies (Acemoglu, 2003), aggregate industry productivity growth (Melitz & Ottaviano, 2008), and wage increases which might reduce the size of rent extracted in an autocratic regime (Cervel-lati et al., 2018). Trade can induce structural transformation (Teignier, 2009; Betts et al. 2017). Therefore, a political regime change can induce structural transformation by increasing trade. This paper seeks to explore the impact of a democratic transition on structural transformation of the economy. To this end, we use a difference GMM approach, which deals with reverse causa-lity and dynamic specification issues to identify the impact of a democratic transition on the value added share of agriculture. The analysis covers 43 countries for the period from 1970-2016. This paper is organized in three sections. The first section explores the impact of a democratic transition on structural transformation through an increase in capital deepening. The second sec-tion explores the impact of a democratic transisec-tion on the structural transformasec-tion through re-distribution. The third section provides empirical evidenceand the last section presents a discus-sion and concluding remarks.
2. Democratic Transition and Structural Transformation: Theoretical Background
The theoretical background we provide in this section rests on the supply and demand side explanations. Supply side explanation is based on the decline in risks of expropriation by govern-ment or contract disputes following a regime switch from autocracy to democracy which induces
technological innovation and capital deepening. Moreover, trade might be increased after a poli-tical regime switch that might induce structural transformation. Demand side explanation is ba-sed on the Median Voter theorem and Engels’ law which emphasize the impact of redistribution on sectoral production through variation in demand for goods produced in different sectors. Incomplete information and uncertainty over a future political institution, risks of expropriation by government or contract disputes in the presence of a weak legal framework would lead to a low level of investments. Streb (2001) argues that both arbitrariness and instability of political instituti-ons leads to incomplete information economic agents have about the state of the economy, whıch would negatively affect economic outcomes. Democracy compared to autocracy provides constitu-tional boundaries on government policies and lower the arbitrariness of policymaking. According to Acemoglu and Robinson (2001, 2006), a democratic system provides the commitment of the elite to future redistribution, which would lead to social peace and decrease in risks of expropriation of fu-ture income streams by government, or simply a decrease in political risks. Therefore, in democra-cies investors would know what particular political environment they would face in the future and whether they would capture retuns to their investments without facing conflict.
Following a democratic transition, checks and balances such as rules of law and divisions of power are established. Olson (2000) argues that a democratic system ensures the protection of property and contract rights therefore; it decreases the uncertainty in a sense which would incre-ase long term investments. In other words, a decline in risk level in the general economy would induce a decline in the cost of capital, which in turn would decrease the discount rate and increa-se the preincrea-sent value of cash flows, increaincrea-se the number of long run investment projects, and long run economic growth.
On the other hand, investment in technology and human capital generates positive externali-ties for all economic units in the general economy (Romer,1990; Levine, 1991). Therefore, the resolution of political uncertainty would lead to capital deepening (Acemoglu and Guerrieri, 2008) through a decrease in the cost of capital and increase in the technological advancement that would lead to a structural transformation.
Buera and Kaboski (2012) argue that the sectoral allocation of resources is mainly determined by the size of firms and the poverty level in the country. Therefore, it can be argued that short-term, small-scale investment projects undertaken by economic agents due to unstable political institutions would lead to underdevelopment of the manufacturing sector.
Political elites might avoid opening trade since rent extraction mechanisms on the traditional sector, agriculture, and the modern sector might fail to produce rents in the open economy. The-refore, opening up trade or expansion of trade following democratization might induce industria-lization through the expansion of trade in agricultural goods (Teignier, 2009; Betts et al., 2017). On the other hand, following a democratic transition, the whole society, depending on the extension of suffrage decides on resource allocation including redistribution through taxes and transfers. In autocracy or elite-led oligarchies, a small group of elites decide on resource allocati-on where they can divert resources away from the rest of society toward themselves. An electoral democracy under a majority-voting rule ensures anequal distribution of resources. Aidt et al. (2006) reports that a franchise results in an increase in public goods provided by the government in Western Europe over the period from 1830-1939.
The study of Meltzer & Richard (1981) shows that following the establishment of a franchise, implementation of policies improving the welfare of the poor against the rich became feasible. Their median voter theorem argues that the tax policy that is determined by the median voter
ensures the reallocation of economic wealth. The reallocation of wealth varies with the income inequality in the country (Alesina & Rodrik, 1994).
On the other hand, Kongsamut et al. (2001) argue that sectoral reallocation of resources arises mainly due to a variation in the income elasticity of goods produced in different sectors along the development path of an economy. According to this view, the marginal rate of substitution between goods produced in different sectors changes as the economy grows due to non-homotheticity of pre-ferences leading to a different rate of sectoral growth. Laitner (2000) argues that following an incre-ase in GDP, Engels’ law ensures that the production share of agriculture declines against industry. Engel’s law infers that people are less willing to buy primary goods, but are more willing to buy industrial goods if their income level rises. Engel’s law states that the share of food expendi-ture in the budget falls as income rises. Houthakker (1987) reports that the falling budget share for food with rising incomes has become one of the most robust empirical findings in economics. Alesina & Rodrik (1994) argue that distributed income through taxation depends on the inco-me level and capital endowinco-ment of the inco-median voter. They argue that the redistributed incoinco-me would decrease with income equality. However, in a political system where the elite decides the tax rate and redistribution, the income distribution would be skewed right. A regime switch to democracy would then lead to a high redistribution of income towards low income people. Therefore, it can be argued that redistribution after a regime switch would generate income to be spent for the purchase of industrial goods. Murphy et al. (1989) argue that any improvement in the wealth level of the poor against the rich through redistribution would increase the demand for industrial goods and decrease the demand for backstop produced luxuries (domestic and imported luxuries). Moreover, as low income people have a higher propensity to consume, and due to En-gels’ law, the total demand for industrial goods would increase and the demand for agricultural goods would decrease, whıch would result in industrialization. Additionally, in the case of income transfer from rich to poor, the consumption of industrial goods rises, which increases the relative price of industrial goods leading to a labor movement from agriculture to industry2. Murphy et al.
(1989) argue that unequal societies would be stuck with an agricultural economy due to the lack of demand for industrial goods where elites are served by labor-intensive back-stop sector or im-ports. Therefore, it can be argued that a high redistribution induced by a democratic transition would provide sufficient demand and enable market enlargement for industrial goods and the movement of labor from agriculture to industry.
3. Data
In this section of the paper, we describe the data set that was employed for the empirical mo-del, which resulted in evidence that the democratic transition leads to the structural
transformati-on of the ectransformati-onomy. The analysis covers 43 countries for the period from 1970-2016. Thirteen countries are low-income, thirteen countries are lower-middle income, fourteen countries are upper-middle income, and three countries are high-income economies. Only countries that had transition experience were included in the analysis. (See Appendix for the list of countries that were analyzed.). We took four-year averages for the period from 1970-2013 and three-year avera-ges for the period from 2014-2016 except for the variable democ. The variable democ takes the 1 of 1, if it takes the value 1 for the years averaged.
2 Herrendorf et al. (2014) reports that the relative prices of agricultural sector to non-agricultural sector has decreased since World War II.
Figure 1: Number of Countries Ruled by Democracy /Autocracy.
Figure 1 displays the number of countries in the sample ruled by democracy and autocracy over the period from 1970-2016. The number of autocracies decreases whereas the number of democracies increases dramatically throughout the period. Almost 80 % of autocracies in the sample transformed into democracies during the period, which implies that we have sufficient variation for transition in political regimes to produce significant econometric implications.
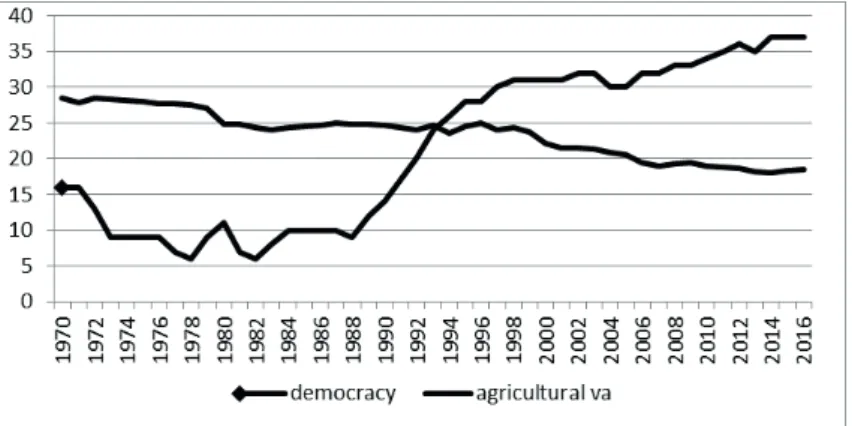
Figure 2: Comparison of Agricultural Value Added as a Share of GDP and Democracy. Notes: y-axis represents number of countries ruled by democracy and agricultural value added (as % of GDP)
Inspecting Figure 2, we see that the agricultural value added decreases as the number of countries in the sample ruled by democracy increases. Therefore, the average value of the agricul-tural value added and regime switches are highly correlated and that needs to be explored through causality analysis entailing the inclusion of the confounding variables.
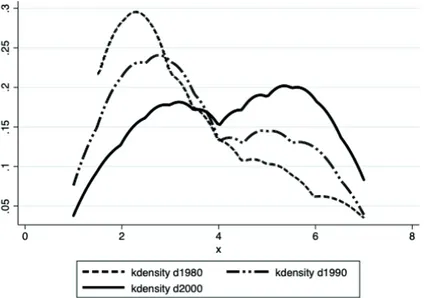
Figure 3: Kernel Density Distributions for Democracy Indices of 1980s, 1990s, 2000s.
The Kernel graphs in Figure 3 represent the democracy index for countries in the sample for 1980, 1990 and 2000. The democracy index is the average of two indices as political rights and civil liberties from FRH (2018). The indices are subtracted from 8 in order that the higher values represent a higher level of democracy. In other words, this index in some way measures the quality of democracy in that country. The shape of the kernel distribution changes from a unimodal to bi-modal distribution indicating that democracies get mature and qualified over time. The density of mature democracies increase while the density of immature democracies decrease over time. In the 1980s, democracies lacked political rights and civil liberties which changed dramatically over time in the way that democracies provided more political rights and civil liberties for citizens. Table 1 below presents the source of the data and how it was compiled. The World Bank Indi-cators, and Polity (2018) are used mainly for empirical estimation.
Table 1: Data Sources
Variable Description Source
agric Agriculture, value added (% of GDP) WDI (2018) democ Dummy Variable=1 if democracy, =0 for autocracy Polity (2018) lngdppc (natural log.) GDP per capita*100/(100+Inflation)
GDP per capita (current US$) WDI (2018) Inflation, GDP deflator (annual %) WDI (2018) lnpop (natural log.) Population ages 15-64, total WDI (2018) depen Age dependency ratio (% of working-age population) WDI (2018) arable Arable land (% of land area) WDI (2018) lncap (natural log.) Electric power consumption (kWh per capita) WDI (2018) fert Adolescent fertility rate (births per 1,000 women ages 15-19) WDI (2018) educ School enrollment, secondary (% gross) WDI (2018) infra Fixed telephone subscriptions (per 100 people) WDI (2018) trop Trade (% of GDP) WDI (2018) findev Domestic credit to private sector (% of GDP) WDI (2018) Fdi Foreign direct investment, net inflows (% of GDP) WDI (2018)
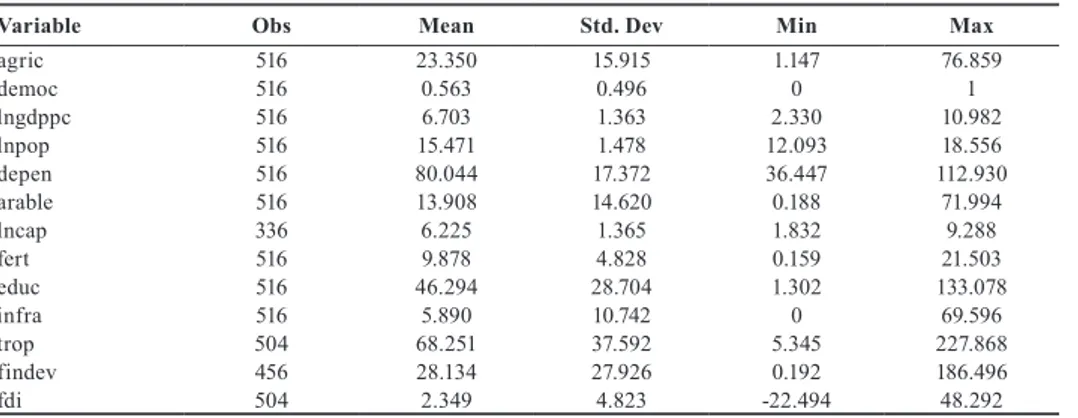
Table 2 displays descriptive statistics on all variables used in the empirical analysis. The value added share of the agricultural sector and GDP per capita shows significant variation indicating the significant movement over the period, which indicates large variation for these variables.
Table 2: Descriptive Statistics
Variable Obs Mean Std. Dev Min Max
agric 516 23.350 15.915 1.147 76.859 democ 516 0.563 0.496 0 1 lngdppc 516 6.703 1.363 2.330 10.982 lnpop 516 15.471 1.478 12.093 18.556 depen 516 80.044 17.372 36.447 112.930 arable 516 13.908 14.620 0.188 71.994 lncap 336 6.225 1.365 1.832 9.288 fert 516 9.878 4.828 0.159 21.503 educ 516 46.294 28.704 1.302 133.078 infra 516 5.890 10.742 0 69.596 trop 504 68.251 37.592 5.345 227.868 findev 456 28.134 27.926 0.192 186.496 fdi 504 2.349 4.823 -22.494 48.292 4. Empirical Model
In this section of the paper, we describe the empirical model to decide whether the evidence indicates that the democratic transition leads to the structural transformation of the economy.
The general model to be estimated with Difference GMM is as below; (1) yit = ɑ yi,t-1 + X’itβ +ɛit
(2) ɛit = μi + vit
(3) E(μi) = E(vit) = E(μivit) = 0
The disturbance term ɛit has two orthogonal components as the fixed effects, ui and idiosync-ratic shocks, vit.
The Difference GMM transforms data to remove the fixed effects. The first difference trans-formation only has a weakness in unbalanced panels (Roodman, 2006).
(4) ∆yit = ( ɑ-1) ∆yi,t-1 + ∆X’itβ + ∆vit (5) E[∆witμi] = 0
Although the fixed effects are göne, the lagged dependent variable is still endogenous, beca-use yi,t in ∆yi,t-1 correlates with vit-1 in ∆vit (Roodman, 2006). Validity depends on the assumption that the vit is not serially correlated. But, if the vit is serially correlated of order 1 then, for instan-ce, yi,t−2 is endogenous to the vi,t−1 in the error term in differences, ∆εit = vit − vi,t−1, making it a po-tentially invalid instrument. The researcher would need to restrict the instrument set starting with a third lag or longer. If the researcher finds a second order correlation, he or she would need to start with even longer lags. (Roodman, 2006).
A Difference GMM approach is preferred in the analysis since it tackles the endogeneity issue due to lag of dependent variable and reverse causality running from dependent variable to inde-pendent variables. It also tackles the multicollinearity issue and heteroscedasticity problem.
Reduced From Equation for Model 1;
(1.1) AGRICit = ɑ AGRICi,t-1 + β1 STRUCTURALit + ɛit (1.2) ɛit = μi + vit
(1.3) E(μi) = E(vit) = E(μivit) = 0
(1.4) ∆AGRICit = δ ∆AGRICi,t-1 + ϕ ∆STRUCTURALit + ∆vit (1.5) E[∆witμi] = 0
Reduced From Equation for Model 2-8;
(1.1) AGRICit = ɑ AGRICi,t-1 + β1 STRUCTURALit + β2 POLICYit + ɛit (1.2) ɛit = μi + vit
(1.3) E(μi) = E(vit) = E(μivit) = 0
(1.4) ∆AGRICit = δ AGRICi,t-1 + ϕ ∆STRUCTURALit + λ ∆POLICYit + ∆vit (1.5) E[∆witμi] = 0
AGRICit represents value added agriculture for country i in year t. AGRICi,t-1 represents value added agriculture for country i in year t-1. STRUCTURALit represents structural variables inclu-ding democratic transition, income per capita, population, age dependency ratio, and arable land. POLICYit represents policy variables including capital stock, fertility rate, educational attainment, infrastructure, trade openness, financial development, and FDI inflows for country i in year t. Model 1 is established to test the relationship between structural variables and agricultural value added. For Models 2-8, policy variables are included in regressions separately controlled with all structural variables. Although the subject of the paper and the economic analysis is very different, the division between structural and policy variables is taken from Dabla-Norris et al. (2013).
5. Estimation Results
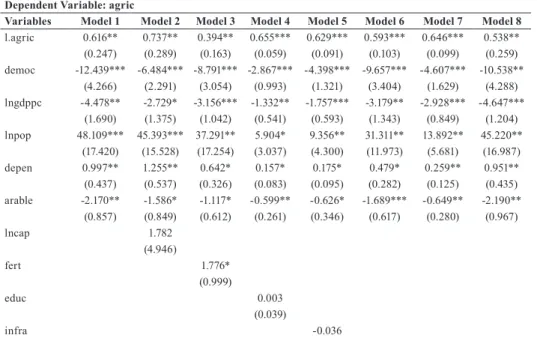
Table 3: Difference GMM Estimation Results Dependent Variable: agric
Variables Model 1 Model 2 Model 3 Model 4 Model 5 Model 6 Model 7 Model 8
l.agric 0.616** 0.737** 0.394** 0.655*** 0.629*** 0.593*** 0.646*** 0.538** (0.247) (0.289) (0.163) (0.059) (0.091) (0.103) (0.099) (0.259) democ -12.439*** -6.484*** -8.791*** -2.867*** -4.398*** -9.657*** -4.607*** -10.538** (4.266) (2.291) (3.054) (0.993) (1.321) (3.404) (1.629) (4.288) lngdppc -4.478** -2.729* -3.156*** -1.332** -1.757*** -3.179** -2.928*** -4.647*** (1.690) (1.375) (1.042) (0.541) (0.593) (1.343) (0.849) (1.204) lnpop 48.109*** 45.393*** 37.291** 5.904* 9.356** 31.311** 13.892** 45.220** (17.420) (15.528) (17.254) (3.037) (4.300) (11.973) (5.681) (16.987) depen 0.997** 1.255** 0.642* 0.157* 0.175* 0.479* 0.259** 0.951** (0.437) (0.537) (0.326) (0.083) (0.095) (0.282) (0.125) (0.435) arable -2.170** -1.586* -1.117* -0.599** -0.626* -1.689*** -0.649** -2.190** (0.857) (0.849) (0.612) (0.261) (0.346) (0.617) (0.280) (0.967) lncap 1.782 (4.946) fert 1.776* (0.999) educ 0.003 (0.039) infra -0.036
(0.076) trop -.121*** (0.034) findev 0.044** (0.021) fdi -0.081 (0.364) Prob>F 0.000 0.000 0.000 0.000 0.000 0.000 0.000 0.000 Countries 43 28 43 43 43 42 38 42 Instruments 16 23 25 26 26 20 21 19 Sargan 0.634 0.984 0.820 0.399 0.744 0.600 0.315 0.756 AR(2) 0.353 0.600 0.720 0.337 0.413 0.508 0.209 0.535
Source: Authors’ Own Calculations
Notes: The values in parenthesis are robust standard errors. ***, ** and * denote significance levels at % 1, % 5 and % 10 respectively. AR(2) is test for second-order serial correlation in the second-differenced residuals, under the null of no serial correlation. Hansen test of over-identification is under the null that all instruments are valid. All the independent variables are treated endogenously except lnpop, arable, fertility, findev and fdi. Second and deeper lags are instrumented according to AR (2) test of serial correlation.
According to Table 3, the lag of agricultural value added has a positive, significant effect on the current agricultural value added. The magnitude of the coefficient is between 0.394 and 0.737. Even if there is a convergence it is very slow, since these countries do not belong to the same club, they are randomly selected according to the fact that they had a transition from autocracy to de-mocracy or vice versa. The coefficients for the lag of agricultural value added should be interpre-ted as the current level of agricultural value added, which heavily depends on its past values. According to estimation results, the democratic transition has a negative significant effect on the value added share of agriculture where the magnitude of the coefficient is between -2.867 and -12.439. The presence of a statistically significant negative impact of a democratic transition on the value added share of agriculture in all models, indicating the robustness of the result, shows that democracies experience a decrease in the value added share of agriculture following the transition. The GDP per capita (income per capita) has a negative significant impact on the agricultural value added. This confirms the predictions of theories about the declining role of agriculture in the growing economy. As argued by Kongsamut et al. (2001) and Gollin et al (2002), the share of agriculture in employment and output declines as the economy grows.
There is an insignificant relationship between the physical capital and agricultural value ad-ded. This result contradicts the predictions of Acemoglu and Guerrieri (2008) in that the increase in capital labor ratio and capital accumulation increases the output of the capital intensive sectors leading to a lower share of the agricultural value added. However, in the presence of appreciation of (internal/external) terms of trade in favor of agriculture and rise in labor productivity thanks to mechanization in agriculture or migration from rural to urban areas, the agricultural value added might not vary much despite capital deepening in the industry leading to insignificant estimates. There is a positive significant relationship between the financial development variable and the agricultural value added. The result would imply that the productivity increase due to a rise in a technological capacity increase was financed through the loan market. There is a positive signifi-cant relationship between population and the agricultural value added, which does not comply with the findings of Leukhina & Turnovsky (2016) and Ho (2015) who argue that there is a major role of population growth in the structural transformation of the British economy.
Trade openness has a negative significant effect on the agricultural value added. This result complies with the results provided by studies in the structural transformation literature arguing that international trade has a negative significant effect on the share of agricultural value added (Teignier, 2009; Betts et al., 2017; Uy et al., 2013).
There is a negative significant relationship between arable land and agricultural value added. The size of arable land would indicate the importance of agriculture in the general economy in the country. However, after controlling the population and GDP, it can be claimed that count-ries with a bigger size of arable land would have an economy based more on agriculture, which would employ most of the labor in the country. However, as these countries experienced structural transformation, they had a higher decline in agricultural value added compared to countries with lower arable land.
The following variables; educational attainment, infrastructure, and FDI inflows had no sig-nificant effect on the agricultural value added.
6. Discussion and Conclusion
Gollin et al. (2002) argue that there is wide per capita income disparity between early and late in-dustrialized countries. Therefore, according to Gollin et al. (2002) late industrialization explains most of the income differences between countries. There are demand and supply based explanations of in-dustrialization in a country. The demand side explanations are based on Engles’ law whereas supply side explanations are based on a variation in capital shares between sectors, a variation in TFP betwe-en sectors, and opbetwe-ening to trade. The study contributes to the literature by empirically exploring the impact of democratization on the reallocation of resources towards industry from agriculture. The demands for democracy do not arise only because people are aiming for broader political rights but also aiming for higher income through redistribution. According to the Median Voter Theorem, the median voter receiving income levels lower than mean income in society sets the positive tax rate enabling the redistribution. Therefore, following a democratic transition there would be a redistribution of income from top income earners to low income earners, which leads to a reallocation of demand across sectors due to Engels’ law. According to Engels’ law, agricul-tural goods are demanded less and industrial goods are demanded more as income rises. On the other hand, top income earners consume a significant amount of backstop produced luxury goods (or imports) because industrial goods are inferior goods for them. The reallocation of income enables the increase in demand for industrial goods and a decrease in demand for backstop pro-duced luxury goods. In other words, the reallocation of income towards the poor enables an enlar-gement of the market for industrial goods. Therefore, democracy leads to industrialization. Moreover, Olson (2000) argues that conditions of long lasting property and contract rights and the rules of law exist only for securely democratic societies. The elite-led, single ruler autoc-racies have a different set of rules as each dictator rules according to his own set of rules, which are mostly ad hoc and arbitrary resulting in an uncertain economic and political environment. For example; one autocrat might protect property and contract rights whereas the other one might confiscate properties, which negatively impacts long run investment projects. Additionally, in an unstable political environment where a regime switch occurs frequently, investors would not feel safe investing in long-term projectsor large-scale projects that are mostly investments in techno-logy and human capital resulting in an economic underdevelopment and agriculture based eco-nomy. Capital deepening occurs if the uncertainty is resolved leading to a structural transforma-tion as it is argued by Acemoglu and Guerrieri (2008).
Moreover, elites might avoid opening the economy to trade since rents might decrease. The-refore, democratization might lead to expansion of trade (Milner and Kubota, 2005; Aidt and Gassebner, 2010) and trade expansion might induce a structural transformation (Teignier, 2009; Betts et al., 2017)
The estimation results indicate that a democratic transition has a significant, negatıve impact on the value added share of agriculture, where the magnitude of the coefficient is between -0.590 and -1.172. The presence of a statistically significant negative impact of democratic transition on the value added share of agriculture in all models, indicating the robustness of the result, shows that democracies experience a decrease in the value added share of agriculture following a tran-sition. This study contributes significantly to the literature by providing cross-country evidence that a political regime switch from autocracy to democracy explains industrialization.
Additionally, the estimation results indicate that per capita GDP, arable land, and trade open-ness have a negative significant impact, whereas financial development, fertility, and population have positive significant impacts on the value added share of agriculture. Eventhough results do not support the explanation for structural transformation based on capital deepening, it supports the explanation based on trade expansion.
Peer-review: Externally peer-reviewed.
Conflict of Interest: The authors have no conflict of interest to declare.
Grant Support: The authors declared that this study has received no financial support. Hakem Değerlendirmesi: Dış bağımsız.
Çıkar Çatışması: Yazarlar çıkar çatışması bildirmemiştir.
Finansal Destek: Yazarlar bu çalışma için finansal destek almadığını beyan etmiştir.
References/Kaynakça
Acemoglu, D., & Robinson, J. A. (2001). A theory of political transitions. American Economic Review, 91(4), 938– 963. https://doi.org/10.1257/aer.91.4.938
Acemoglu, D. (2003). Why not a political Coase theorem? Social conflict, commitment, and politics. Journal of
Comparative Economics, 31(4), 620–652. https://doi.org/10.1016/j.jce.2003.09.003
Acemoglu, D.& Robinson, J.A. (2006). Economic origins of dictatorship and democracy. New York, USA: Cambridge University Press. https://doi.org/10.1017/CBO9780511510809.003
Acemoglu, D., & Guerrieri, V. (2008). Capital deepening and nonbalanced economic growth. Journal of Political
Economy, 116(3), 467–498. Retrieved from https://economics.mit.edu/files/5673
Acemoglu, D., Johnson, S. , Robinson, J. A., & Yared, P. (2008). Income and democracy. American Economic
Review, 98(3), 808–42. https://doi.org/10.1257/aer.98.3.808
Aidt, T. S., Dutta, J., & Loukoianova, E. (2006). Democracy comes to Europe: franchise extension and fiscal outcomes 1830–1938. European Economic Review, 50(2), 249-283. https://doi.org/10.1016/j.euroecorev.2004.07.004 Aidt, T. S., & Gassebner, M. (2010). Do autocratic states trade less?. The World Bank Economic Review, 24(1), 38–
76. https://doi.org/10.1093/wber/lhp022
Alesina, A., & Rodrik , D. (1994). Distributive politics and economic growth. Quarterly Journal of Economics,
109(2), 465–490. https://doi.org/10.2307/2118470
Betts, C., Giri, R., & Verma, R. (2017). Trade, reform, and structural transformation in South Korea. IMF Economic
Review, 65(4), 745–791. https://doi.org/10.1057/s41308-017-0031-7
Boix, C. (1998). Political parties, growth and equality: Conservative and social democratic economic strategies in
the world economy. Cambridge, UK: Cambridge University Press. https://doi.org/10.1017/CBO9781139174947
Buera, F. J., & Kaboski, J. P. (2012). Scale and the origins of structural change. Journal of Economic Theory, 147(2), 684–712. https://doi.org/10.1016/j.jet.2010.11.007
Cervellati, M., Naghavi, A., & Toubal, F. (2018). Trade liberalization, democratization, and technology adoption. Journal of Economic Growth, 23(2), 145–173.
https://doi.org/10.1007/s10887-018-9155-5
Chan, S. (1997). Democracy and inequality: Tracking welfare spending in Singapore, Taiwan, and South Korea. In M. Midlarski (Ed.), Inequality, democracy, and economic development (pp. 227–243). Cambridge, UK:
Cambridge University Press.
Clark, C. (1940). Conditions of economic progress. London, UK: McMillan.
Dabla-Norris, M. E., Thomas, M. A. H., Garcia-Verdu, M. R., & Chen, M. Y. (2013). Benchmarking structural transformation across the world (No. 13-176). International Monetary Fund. http://dx.doi. org/10.5089/9781484359662.001
FRH (2018). Freedom in the world: Comparative and historical data. Freedom House, Washington D.C. Retrieved from https://freedomhouse.org/content/freedom-world-data-and-resources
Gollin, D., Stephen L. P., & Richard R. (2002). The role of agriculture in development. The American Economic
Review, 92(2), pp.160–164.
https://doi.org/10.1257/000282802320189177
Gollin, D., Stephen L. P., & Richard, R. (2007). The food problem and the evolution of international income levels.
Journal of Monetary Economics, 54(4), 1230–1255. https://doi.org/10.1016/j.jmoneco.2006.04.002
Herrendorf, B., Rogerson, R., & Valentinyi, A. (2014). Growth and structural transformation. In Handbook of
economic growth (Vol. 2, pp. 855-941). Amsterdam, Netherlands: Elsevier.
https://doi.org/10.1016/B978-0-444-53540-5.00006-9
Ho, C. P. (2015). Population growth and structural transformation. MPRA Paper, No.73860. Retrieved from https:// mpra.ub.uni-muenchen.de/73860/1/MPRA_paper_73860.pdf
Houthakker, H. (1987). Engel’s law. In The New Palgrave Dictionary of Economics (Vol.2, pp.143–144). London, UK: McMillan.
Kongsamut, P. , Sergio R. & Danyang, X. (2001). Beyond balanced growth. Review of Economic Studies, 68(4), 869–882. https://doi.org/10.1111/1467-937X.00193
Kuznets, S. (1966). Modern economic growth: Rate, structure, and spread. New Haven, USA: Yale University Press. https://doi.org/10.1086/259424
Laitner, J. (2000). Structural change and economic growth. Review of Economic Studies, 67(3), pp.545–561. https:// doi.org/10.1111/1467-937X.00143
Lenski, G. E. (1966). Power and privilege (Vol. 96). New York, USA: McGraw-Hill. https://doi.org/10.2307/1953261 Leukhina, O. M., & Turnovsky, S. J. (2016). Population size effects in the structural development of England. American
Economic Journal: Macroeconomics, 8(3), 195–229. https://doi.org/10.1257/mac.20140032
Levine, R. (1991). Stock markets, growth, and tax policy. The Journal of Finance, 46(4), 1445–1465. https://doi. org/10.1111/j.1540-6261.1991.tb04625.x
Melitz, M. J., & Ottaviano, G. I. (2008). Market size, trade, and productivity. The Review of Economic Studies, 75(1), 295–316. Retrieved from https://scholar.harvard.edu/files/melitz/files/melot_restud_final.pdf
Meltzer, A. H., & Richard, S. F. (1981). A rational theory of the size of government. The Journal of Political
Economy, 89(5), 914–927. https://doi.org/10.1086/261013
Milner, H. V., & Kubota, K. (2005). Why the move to free trade? Democracy and trade policy in the developing countries. International Organization, 59(1), 107–143. Retrieved from https://www.princeton.edu/~hmilner/ forthcoming%20papers/LDCdem_IO.pdf
Murphy, K. M., Shleifer, A., & Vishny, R. W. (1989). Industrialization and the big push. Journal of Political
economy, 97(5), 1003-1026. Retrieved from https://scholar.harvard.edu/files/shleifer/files/indust_big_push.pdf
Murtin, F., & Wacziarg, R. (2011). The democratic transition. NBER Working Paper, No. 17432. https://doi. org/10.3386/w17432
Ngai, L. R., & Pissarides, C. A. (2007). Structural change in a multi-sector model of growth. American Economic
Review, 97(1), pp.429–443. https://doi.org/10.1257/aer.97.1.429
Olson, M. (2000). Power and prosperity: Outgrowing communist and capitalist dictatorships. New York, USA: Basic Books.
Polity (2018). Polity IV index: Polity project. Retrieved from http://www.systemicpeace.org/polityproject.html Roodman, D. (2009). How to do xtabond2: An introduction to difference and system GMM in Stata, Stata Journal,
9(1), 86–136. https://doi.org/10.1177/1536867X0900900106
Romer, P. M. (1990). Endogenous technological change. Journal of Political Economy, 98(5), 71–102. Retrieved from https://www.jstor.org/stable/2937632
Streb, J. (2001). Political uncertainty and economic underdevelopment. Estudios de Economía, 28(1), 89–114. Retrieved from https://ucema.edu.ar/u/jms/articles_and_working_papers/EstudiosdeEconomia_v28-n1-e_2001_Streb.pdf
Syrquin, M. (1976, August). Sources of industrial growth and change: An alternative measure. In European Meeting
of the Econometric Society, Helsinki, Finland.
Teignier, M. (2009). The role of trade in structural transformation. Available at SSRN 1984729. Retrieved from https://www.cemfi.es/ftp/pdf/papers/seminar/roletrade_teignier.pdf
Uy, T., Yi, K. M., & Zhang, J. (2013). Structural change in an open economy. Journal of Monetary Economics, 60(6), 667–682. https://doi.org/10.1016/j.jmoneco.2013.06.002
WDI (2018). World development indicators. World Bank, Washington D.C. Retrieved from http://databank.worldbank.org/data/reports.aspx?source=world-development-indicators
APPENDIX List of Countries Analyzed
Algeria Ghana Nepal
Argentina Guinea-Bissau Pakistan Bangladesh Guyana Panama
Benin Honduras Philippines Bolivia Iran, Islamic Rep. Sierra Leone Burkina Faso Iraq Suriname
Burundi Kenya Swaziland Central African Republic Korea, Rep. Thailand Chile Lesotho Tunisia Congo, Dem. Rep. Liberia Turkey
Congo, Rep. Madagascar Venezuela, RB Denmark Malawi Zambia Dominican Republic Mali Zimbabwe
Ecuador Mauritania Fiji Mexico