Received on: 31.01.2017 Accepted on: 13.03.2017
ASSESSMENT OF SIMILARITIES BETWEEN LIVER IMAGES TO EACH
OTHER USING SCALING, ROTATION AND TRANSLATION
GEOMETRICAL OPERATIONS
Tuğba Palabaş Tapkın
1, Onur Osman
2, Tuncer Ergin
3, Uygar Teomete
4, Özgür Dandin
5,
Nizamettin Aydın
61Department of Computer Engineering, Yildiz Technical University, Istanbul, Turkey 2Department of Electrical Electronic Engineering, Istanbul Arel University, Istanbul, Turkey
3Radiology Department, GATA, Ankara, Turkey
4Department of Radiology, Miami Miller Faculty of Medicine, Florida, A.B.D 5General Surgery Service, Bursa Military Hospital, Bursa, Turkey
6Department of Computer Engineering, Yildiz Technical University, Istanbul, Turkey
[email protected], [email protected], [email protected], [email protected], [email protected], [email protected]
Abstract: In this study, similarity rates of the liver images which are obtained from different peoples are determined
using 3D geometric transformation methods. The similarity is evaluated based on the numerical comparisons and visual results. 10 intact liver images which are drawn by the radiologists are used. Three geometric transformation methods scaling, rotating, and translating are consecutively applied to the liver images. All images are used both as atlas and as test images. The Dice coefficient values are calculated to show the similarity of each test image to atlas. The scaling, rotating, and translating amounts of the image are retained for the atlas which the similarity rate is highest. The liver images of different persons are similar to each other at an average rate of 67∓0.09 % according to Dice coefficient values which express the similarity. This study is presented as a step to prepare atlas database for segmentation of the injured liver.
Keywords: Geometric operetions, liver segmentation, Dice coefficient.
1. Introduction
In order to determine the immediate operation necessities and to make the pre-diagnosis of the pathologic findings to the traumatic patients which are brought to emergency rooms is very important for accelerating patient management.
The images that make up the CT (Computed tomography) visualising method will be the most accurate detection method. The first and the most important step is the segmentation of the liver who has similar grey level values with the neighboring organs in an accurate manner in order to re-building and the determination of the injury level. The determination of the liver borders by hand needs extra expertise and is a time-consuming job because of the section amount. For this reason, automatic segmentation becomes important step in biomedical image processing for computer aided diagnosis. Lots of methods have been proposed in order to realise computer aided diagnosis of intraabdominal organs. In Figure 1, automatic segmentation [1] of liver and spleen images have been
utilized by the aid of probabilistic atlas method. 257 BT images have been compared with liver and spleen images by the aid of probabilistic atlases and the success of the proposed method has been evaluated by examining 10 CT images in which the borders have determined by hand. For liver and spleen , Dice coefficient of 96.2% and 95.2%, Tanimato indexes of 92.7% and 91%, volume estimation error of 2.2 and 3.3, peak estimation error of 2.8 and 1.7, RMS error of 2.3 mm and 1.1 mm and mean surface distance have been obtained as 1.2 mm and 0.7 mm. It has been stated that the methodology can be utilised in the routine analysis of normal and enlarged liver/spleen images’ segmentation. In the second reference, a study has been presented about the multiplanat fast marching method which is involved with grey level automatic segmentation. 60 CT images have been used in order to test the segmentation success. For liver segmentation, an average of 94% and for spleen segmentation, an average of 93% volume overlap values have been determined as a method which is a general segmentation method to obtain anatomic knowledge which is not critical. In the third reference, a probabilistic model has been proposed for multiple organ segmentation. The method is aiming to calculate the
reduce the calculation complexity and to obtain the best figure variations, for the optimization of principle component analysis and forecasting results, iterative conditional mod-expectation maximization methods have been utilised. For livers and kidneys, 72 training sets and 40 testing sets were utilized and metrics were obtained. With numerical and visual results, it has been stated that the method is performing roughly for the abdominal multiple organ segmentation. In reference 4, a strategic combination for active appearance model, live wire and graph cuts for 3 dimensional organ segmentation have been proposed. The method which is consisting of model formation, object recognition and qualification steps has been tested on clinical CT data set for liver, kidney and spleen segmentation. The metrics which is related to the proposed method has been compared with different methods in order to express segmentation success. In reference 5, for the computer aided diagnosis and laparoscopic surgery help for the intraabdominal organs, a roughly automatic segmentation method which depends on hierarchical atlas records have been proposed. Manually segmented 150 CT image database have been utilised in order to test the success of the method. Consecutively, similarity ratios of 94-93-70-92% values have been obtained for livers, kidneys and pancreases. In reference 6, 4 dimensional CT data has been utilised for the segmentation of intraabdominal organs by utilising anatomic and physiological properties of computer aided diagnosis applications and a similarity ration of 90.5% has been obtained. By applying algorithm steps, the obtained numerical and visual results have been evaluated and the effect of outlook, shape and location data has been expressed. Methods depending on shape and location information have been proposed in reference 7, for injured liver and in reference 8, for injured liver and spleen segmentation. In computer aided diagnosis applications, for intraabdominal organ segmentation, the shape, volume and location information has been utilised often. The damages and density differences that occur in the organs from traumas effect the correctness of these information in a negative manner and change the borders of the segmentation. Selver et al. have developed a 3 dimensional segmentation method for the evaluation of donors before the transplantation by utilising CT images. It has been proposed that, the method which has been developed by utilising artificial neural networks, is suitable for the clinical applications. In CT images, for automatic multiple organ segmentation, an atlas based method has been proposed and presented by Wolz et al. Çınar and Durkaya have proposed an approach for the picking out of the liver image that depends on the expansion principal by using MR images. Every segment has been evaluated separately , the borders of the liver heas been determined and a 3 dimensional segmented liver image has been obtained. Campadelli et al. have proposed a method for the spleen and kidney segmentation that depends on approach and rule based system method.
CT images have been determined manually and the anatomical and physiological similarities of the liver in various people has been expressed by utilising metrics. In this manner, the studies that will be carried out on the segmentation of the injured liver images’ segmentation will have similar border values and by this way, the success in the segmentation will be improved.
2. Material and Method
2.1. Material
In this study, the CT images of 10 patients has been utilised. The images for abdomen trauma have been obtained by using standard protocol. All CT images in portal venous phase were 3 mm segmented and was composed of 84 and 164 various segments.
In this study, the borders of the liver images that have been determined by radiologists (T.E. and U.T.) and drawn by hand were utilised.
2.2. Method
The intraabdominal healthy organs have similar anatomic and physiological properties in different people. Geometric conversion methods have been utilised in order to demonstrate this case numerically. Geometrically, where the value of the pixel will be moved to is determined. The coordinate transformation of the image pixels or the interpolation of the pixel values can be applied as conversion methods. Image scaling (magnification, reduction), mirroring, rotating, cropping, shifting methods can be utilised to change image border in any axis.
In this study, 3 dimensional CT images, which are in x,y,z axes, have been used with applying scaling, rotating and translating consecutively.
Scaling
The scaling of the 3 dimensional object is moving operation of the 1 pixel value from P(x,y,z) coordinates value position in Equation (1) to the S conversion matrix with some defined coefficients to the P’ position. With scaling operation, pixel coordinates are approaching or moving away from each other. By this manner, it is aimed to enlarge or reduce the image in x,y,z directions consecutively in Sx, Sy, Sz ratios.
According to the formula stated in Equation (2), the new coordinates of the pixels can be calculated as in Equation (3).
S= (1)
=
= (3) =
Rotation
The value of 3 dimensional objects’ in P(x,y,z) position and pixel value in the rotation of the axis just like in Equation (4) is by determining the new coordinates and obtaining P'(x1, y1, z1) position. The images’with the R matrix and θ angle in Equation (5) and the rotation around z axis is ending up with P=>P' conversion. For rotation around x and y axes, assigning of x1=x ve y1=y is carried out and for the other axes, the same equalities have been used.
x1= xcos -ysin
y1=xsin -ycos (4) z1=z
R= (5)
Translation
Translation is the operation of moving from P( x, y, z) position to P'(x1, y1, z1) position without changing the pixel values without changing their values. The translation operation is being carried out to Equation (7) with the T conversion matrix stated in Equation (6). As stated in Equation (8), the pixel value in Px1, Py1, Pz1 position is being shifted in an amount of tx, ty, tz and is being moved to Px', Py', Pz' which is the new position. T= (6) =TP (7) = + = + (8) = +
In this study, the radiologist manually segmented the CT images that belongs to different people.
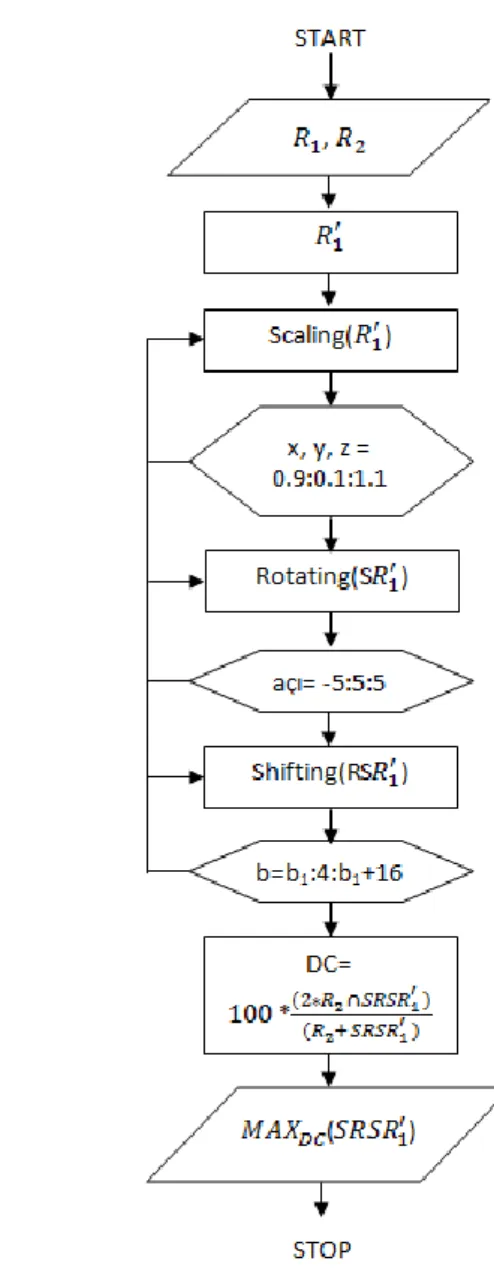
Figure 1. The algorithm steps of the liver images to calculate the
overlapping amount
The P1 and P2 edges have been manually drawn by two different peoples’ CT images by the experts. Connected Componenet Analysis has been applied to P1 and P2 images and labelled images have been obtained. subimage has been obtained from original P1 image by determining the border point of the Liver images. Magnification or reducing operations have been applied on x,y,z axes lying between 0.9 and 1.1, a step size of 0.1 to the image. The obtained scaled S images’ similarity has been explored with the image. RS is obtained by rotating in (+) and (-) directions the scaled S image is in the interval of -5 and 5 with a change of 5°. The similarity of the final image with has been explored. RS image where a rotating operation has been applied, with a step size of 4 pixels, 16 pixels have been shifted separately on x, y, z axes. The starting point for shifting operation has been determined for the border pixels’ starting point at image. DC (dice coefficient) has been calculated as similarity index in every step. The TRS image which has the highest DC value has been obtained. Dice coefficient is calculated as follows:
In Equation (9), number of positives is the total number of the image pixels having intensity of 1. Number of true positives is the total number of first and second images’ of pixels that have intensity of 1. It uses AND operator on first and second images. Number of false positives is the number of image pixels that have intensity of 1 in second the image but zero in first the image. Its traditional formula is shown in Equation (10). I1 and I2 are the two CT images which their similarities are compared.
DC=
(10)
3. Conclusions
In this study, by the aid of geometrical transformation methods, the similarity of the liver images has been explored.
Belonging to two different patients’ CT images’, three different slices have been obtained and have been presented in Figure 2(a) and 2(b). After the scaling, rotation and shifting operations that have been carried out with the subimages that have been obtained, three different slices presented by the overlapping of the two images have been presented in Figure 2(c).
(a)
(b)
(c)
Figure 2. (a) R1 original image, (b) R2 original image, (c) the overlapping image after the geometric conversion has been
applied.
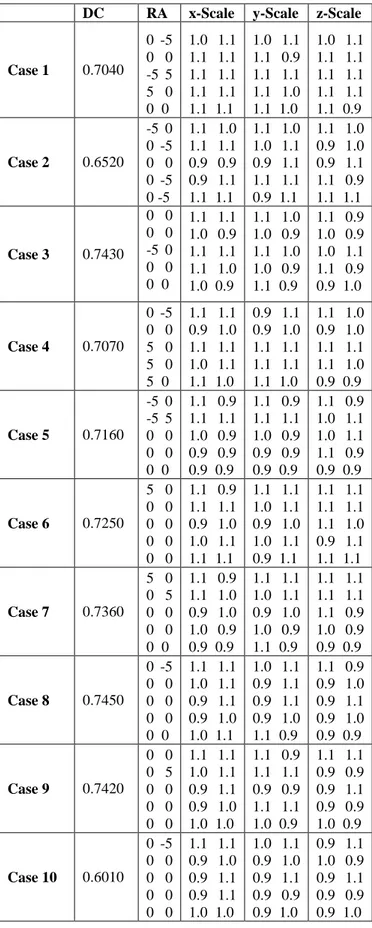
In order to make a numerical evaluation Dice coefficients have been calculated and shown in the second column of Table 1. These values are obtained by calculating the average of DC values for an each Case. Cases at the first column of Table 1 show the CT images numbers of the patients. The angle values for the rotation geometrical operation are shown in the third column of Table 1. Scaling coefficients in x, y and z axes are shown in the fourth, fifth and sixth column of Table 1, respectively.
x-axis, y-axis and z-axis
DC RA x-Scale y-Scale z-Scale
Case 1 0.7040 0 -5 0 0 -5 5 5 0 0 0 1.0 1.1 1.1 1.1 1.1 1.1 1.1 1.1 1.1 1.1 1.0 1.1 1.1 0.9 1.1 1.1 1.1 1.0 1.1 1.0 1.0 1.1 1.1 1.1 1.1 1.1 1.1 1.1 1.1 0.9 Case 2 0.6520 -5 0 0 -5 0 0 0 -5 0 -5 1.1 1.0 1.1 1.1 0.9 0.9 0.9 1.1 1.1 1.1 1.1 1.0 1.0 1.1 0.9 1.1 1.1 1.1 0.9 1.1 1.1 1.0 0.9 1.0 0.9 1.1 1.1 0.9 1.1 1.1 Case 3 0.7430 0 0 0 0 -5 0 0 0 0 0 1.1 1.1 1.0 0.9 1.1 1.1 1.1 1.0 1.0 0.9 1.1 1.0 1.0 0.9 1.1 1.0 1.0 0.9 1.1 0.9 1.1 0.9 1.0 0.9 1.0 1.1 1.1 0.9 0.9 1.0 Case 4 0.7070 0 -5 0 0 5 0 5 0 5 0 1.1 1.1 0.9 1.0 1.1 1.1 1.0 1.1 1.1 1.0 0.9 1.1 0.9 1.0 1.1 1.1 1.1 1.1 1.1 1.0 1.1 1.0 0.9 1.0 1.1 1.1 1.1 1.0 0.9 0.9 Case 5 0.7160 -5 0 -5 5 0 0 0 0 0 0 1.1 0.9 1.1 1.1 1.0 0.9 0.9 0.9 0.9 0.9 1.1 0.9 1.1 1.1 1.0 0.9 0.9 0.9 0.9 0.9 1.1 0.9 1.0 1.1 1.0 1.1 1.1 0.9 0.9 0.9 Case 6 0.7250 5 0 0 0 0 0 0 0 0 0 1.1 0.9 1.1 1.1 0.9 1.0 1.0 1.1 1.1 1.1 1.1 1.1 1.0 1.1 0.9 1.0 1.0 1.1 0.9 1.1 1.1 1.1 1.1 1.1 1.1 1.0 0.9 1.1 1.1 1.1 Case 7 0.7360 5 0 0 5 0 0 0 0 0 0 1.1 0.9 1.1 1.0 0.9 1.0 1.0 0.9 0.9 0.9 1.1 1.1 1.0 1.1 0.9 1.0 1.0 0.9 1.1 0.9 1.1 1.1 1.1 1.1 1.1 0.9 1.0 0.9 0.9 0.9 Case 8 0.7450 0 -5 0 0 0 0 0 0 0 0 1.1 1.1 1.0 1.1 0.9 1.1 0.9 1.0 1.0 1.1 1.0 1.1 0.9 1.1 0.9 1.1 0.9 1.0 1.1 0.9 1.1 0.9 0.9 1.0 0.9 1.1 0.9 1.0 0.9 0.9 Case 9 0.7420 0 0 0 5 0 0 0 0 0 0 1.1 1.1 1.0 1.1 0.9 1.1 0.9 1.0 1.0 1.0 1.1 0.9 1.1 1.1 0.9 0.9 1.1 1.1 1.0 0.9 1.1 1.1 0.9 0.9 0.9 1.1 0.9 0.9 1.0 0.9 Case 10 0.6010 0 -5 0 0 0 0 0 0 0 0 1.1 1.1 0.9 1.0 0.9 1.1 0.9 1.1 1.0 1.0 1.0 1.1 0.9 1.0 0.9 1.1 0.9 0.9 0.9 1.0 0.9 1.1 1.0 0.9 0.9 1.1 0.9 0.9 0.9 1.0
Figure 3. Dice coefficient histogram
Figure 4. Rotation angle histogram
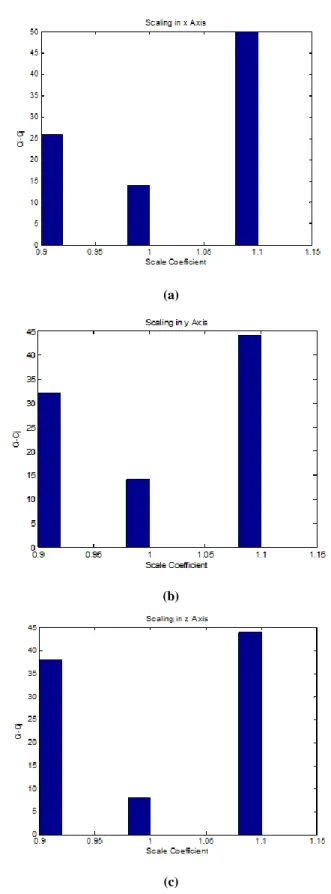
The histogram related to Dice coefficient has been shown in Figure 3. According to the coefficient scattering graph, the liver images that belong to different people (Ci-Cj) show a similarity of 67∓0.09%. Figure 4 is showing the scattering of the angle values for the rotation geometric operation. In Figures 5(a), Figure 5(b) and Figure 5(c) consecutively, the operations that have been carried out on x, y, z axes have been presented
(a) (b) (c)
Figure 5. Scaling coefficients histogram (a) in x axis, (b) in y
[1] Linguraru, M.G., Sandberg J.K., Li Z., Shah F., Summers R.M., “Automated Segmentation and Quantification of Liver and Spleen from CT Images using Normalized Probabilistic Atlases and Enhancement Estimation”, Medical Pyysics, 37(2):771-783, 2010.
[2] Campadelli P., Casiraghi E., Pratissoli S., “A Segmentation Framework for Abdominal Organs from CT Scans”, Artificial Intelligence in Medicine, 50:3–11, 2010.9.
[3] Li C., Wang X., Li J., Eberl S., Fulham M., Yin Y., Feng D.D., “Joint Probabilistic Model of Shape and Intensity for Multiple Abdominal Organ Segmentation from Volumetric CT Images”, IEEE Journal of Bıomedical and Health Informatics, 17( 1): 92-102, 2013.
[4] Chen X., Udupa J.K., Bagci U, Zhuge Y., Yao J., “Medical Image Segmentation by Combining Graph Cuts and Oriented Active Appearance Models”, IEEE Transactions on Image Processing, 21(4): 2035-2046, 2012.
[5] Wolz R., Chu C., Misawa K., Fujiwara M., Mori K., Rueckert D., “Automated Abdominal Multi-Organ Segmentation with Subject-Specific Atlas Generation”, IEEE Transactions on Medical Imaging, 32(9): 1723-1730, 2013.
[6] Linguraru M.G., Pura J.A, Chowdhury A.S., “Summers R.M., Multi-Organ Segmentation from Multi-Phase Abdominal CT via 4D Graphs using Enhancement, Shape and Location Optimization”, Medical Image Computing and Computer-Assisted Intervention – MICCAI , 13(Pt 3): 89–96, 2010.
[7] Palabaş T., Osman, O., Ergin T, Teomete U., Dandin Ö., “Automated Segmentation of the Injured Liver”, Medical Technologies National Conference (TIPTEKNO),2015, DOI: 10.1109/TIPTEKNO.2015.7374590.
[8] Dandin, Ö., Teomete, U., Osman, O., Tulum, G., Ergin, T., Sabuncuoğlu, M.Z., “Automated Segmentation of the Injured Spleen”, International Journal of Computer Assisted Radiology and Surgery, 2015, DOI:10.1007/s11548-015-1288-9.
[9] Selver, M. A., Kocaoğlu, A., Doğan, H., Demir, G. K., Dicle, O. ve Güzeliş, C., “Nakil Öcesi Verici Değerlendirmeleri için Otomatik Karaciğer Bölütleme Yöntemi”, Hastane ve Yaşam, Ocak 2008, 80-87. [10] Çınar, A. ve Durkaya, A. K., “Karaciğer Görüntüsü
Ayıklamak için Genişleme Prensipli Yaklaşım”, National Conference on Electrical Electronics and Computer Engineering-ELECO 2010, December 2010, 588-591.