© Turkish Society of Radiology 2012
L
ower urinary tract symptoms (LUTS) are common, affecting ap-proximately 40% of older men (1). LUTS is a recent term for what used to be known as prostatism (2). However, obstructive disorders of the lower urinary tract may also be caused by other diseases, such as bladder neck contractures, urethral valves, or external sphincter dys-synergia. However, for the majority of cases in the male population, the etiology is benign prostatic hyperplasia (BPH).Various animal and human studies have revealed that a significant enlargement of the bladder wall is attributable to smooth muscle cell hypertrophy, fibrocyte hyperplasia, and collagen deposition in the de-trusor (3, 4). From a clinical perspective, thickening of the bladder wall should be considered as a sign of significant subvesical obstruction (5). The best way to visualize this detrusor muscle hypertrophy in a non-invasive manner is to measure the detrusor wall thickness (DWT) by suprapubic ultrasonography. In 2006, Belal and Abrams (6) evaluated noninvasive methods used to diagnose bladder outlet obstruction (BOO) in a meta-analysis and observed that ultrasound measurements of the DWT and bladder weight were the only predictors of subvesical obstruc-tion in LUTS patients.
It is widely accepted that DWT decreases continuously while the blad-der fills to 50% of its capacity and then remains constant until 100%. Therefore, the detrusor wall measurements are performed on patients when the bladder is filled to maximum capacity only (7). However, no study has been published that evaluates the diagnostic accuracy of DWT when the bladder is empty. In our study, we investigated the association between the LUTS severity and DWT. In addition, the parameter “DWT when the bladder was empty” was also evaluated as a noninvasive diag-nostic tool to predict LUTS in men.
An ideal assessment tool to detect LUTS must be noninvasive, quick, inexpensive, and reproducible with high diagnostic accuracy. Ultrasonography has all of these criteria with additional advantages (no contrast material and no ionizing radiation). In uro-radiology practice, conventional ultrasound-derived noninvasive tests for the evaluation of LUTS severity can achieve measurements of DWT, postvoid residual urine volume (PVR), and prostate and bladder volumes. Hence, our pri-mary aim in this prospective, controlled clinical study was to analyze the diagnostic accuracy of these ultrasound-derived noninvasive tools (i.e., DWT when the bladder is full and empty, PVR, and bladder and prostate volumes) in healthy, mildly symptomatic, and moderately-to-severely symptomatic men, and compare the outcomes in each group. In addition, their correlation according to International Prostate Symptom Score (IPSS) and age groups as well as differences in DWT values were also investigated. Our hypothesis was that these tests would accurate-ly discriminate symptomatic cases from healthy subjects and would
A B D O M I N A L I M A G I N G
O R I G I N A L A R T I C L EDiagnostic values of detrusor wall thickness, postvoid residual
urine, and prostate volume to evaluate lower urinary tract
symptoms in men
Özlem Tokgöz, Hüsnü Tokgöz, İlker Ünal, Umut Delibaş, Sema Yıldız, Nuray Voyvoda, Zuhal Erdem
From the Departments of Radiology (Ö.T., U.D., Z.E.) and Urology (H.T. [email protected]), Karaelmas University School of Medicine, Zonguldak, Turkey; the Department of Biostatistics (İ.Ü.), Çukurova University School of Medicine, Adana, Turkey; the Department of Radiology (S.Y.), Harran University School of Medicine, Şanlıurfa, Turkey; the Department of Radiology (N.V.), Acıbadem University School of Medicine, Kocaeli, Turkey.
Received 14 July 2011; revision requested 29 July 2011; revision received 1 August 2011; accepted 2 August 2011.
Published online 19 December 2011 DOI 10.4261/1305-3825.DIR.4847-11.1
PURPOSE
This prospective, controlled clinical study aimed to assess the diagnostic values of detrusor wall thickness (DWT), postvoid residual urine volume (PVR), and prostate volume in men with lower urinary tract symptoms (LUTS).
MATERIALS AND METHODS
During an 18-month period, a total of 243 males were in-cluded in the study. Three groups were assessed due to their International Prostate Symptom Score (IPSS): men with nor-mal lower urinary tracts (n=51; control group), men with mild LUTS (n=60; Group 1), and men with moderate to severe LUTS (n=132; Group 2). DWT, bladder, and prostate volumes and PVR were measured by suprapubic ultrasonography. DWT was measured when the bladder was full (DWT-1) and when it was empty (DWT-2).
RESULTS
The mean age for the study population was 60.0±0.6 years, while the mean IPSS for the whole group was 8.0±0.4. Both the bladder and prostate volumes in Group 2 were statistically significantly higher than the control group and Group 1. The mean DWT-1 values were significantly lower in the control group when compared to Groups 1 and 2. However, when study groups were compared with each other, no statistical significance was noticed (1.12 vs. 1.17 mm). In contrast, the mean PVR and DWT-2 values were significantly different in each group. There was a significant correlation between IPSS questionnaire results and all individual parameters.
CONCLUSION
Suprapubic transabdominal ultrasonographic assessment of the lower urinary tract in a noninvasive manner allows the clinician to assess LUTS severity in men without morbidity. Ad-ditional studies are necessary to provide further conclusions regarding this clinical procedure.
Key words: • bladder, urinary • prostate • ultrasonography Diagn Interv Radiol 2012; 18:277–281
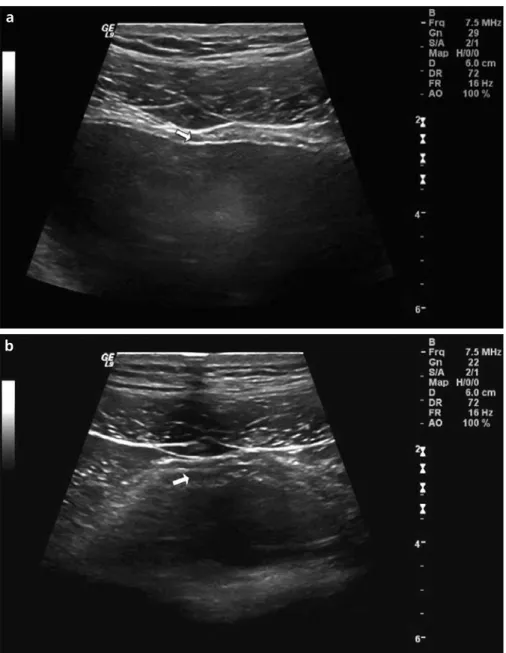
according to the formula “bladder height×depth×width×0.6” (5). With the probe parallel to just above the symphysis pubis of the patient, an im-age of the largest circumference of the prostate was captured on the screen. The prostate volume was estimated from the diameters of the minor axis and the major axis using an elliptical, 3-axis volume formula (10). PVR was measured immediately after voiding with a 3.5-MHz curvilinear ultrasound array. In contrast to the former studies, we also measured the DWT similarly as described above when the bladder was empty, and the data were record-ed as DWT-2 (Fig. 1b). All ultrasound
measurements were done with a
LOGIQ® 9 system (GE Healthcare, Milwaukee, Wisconsin, USA).
For statistical analyses, a com-mercially available software package (Statistical Package for Social Sciences, version 18.0, SPSS Inc., Chicago, Illinois, USA) was used. Categorical variables were summarized as numbers and percentages; continuous variables were given as the means and stand-ard deviations (median, minimum and maximum, if required). One-way analysis of variance (ANOVA) was used to compare parametric variables. Non-parametric variables were ana-lyzed using the Kruskal-Wallis test. predict the degree of the subvesical
obstruction.
Materials and methods
The approval of the hospital ethic committee was obtained, and 243 males were included in this prospec-tive, controlled clinical study. The measurements were done on urology outpatients, in whom subvesical ob-struction was suspected (n=192), with LUTS and/or prostate enlargement. As a control group, normal volunteers and urology outpatients with problems other than lower urinary tract disor-ders, such as varicocele and impotence, were included (n=51). Males with prior urinary tract or pelvic surgery, prostate and bladder cancer, or extravesical or systemic disorders that might influ-ence bladder function (chronic renal insufficiency, neurological disorder, or diabetes mellitus) were excluded from the study and control groups. In ad-dition, patients who complained of symptoms suggestive of LUTS or lower urinary tract dysfunction, such as noc-turia or dysuria, were excluded from the control group. Females and chil-dren were also excluded.
During the initial assessment, all pa-tients were evaluated by the same urol-ogist (H.T.) with an IPSS questionnaire (8) and were divided into two groups according to their IPSS questionnaire results. Group 1 included the cases who were mildly symptomatic, with IPSS scores <8 (n=60). Group 2 in-cluded the cases who were moderately to severely symptomatic, with IPSS scores ≥8 (n=132). Men who met the inclusion criteria were then asked to drink water until they felt the strong desire to void. Using real-time su-prapubic transabdominal ultrasonog-raphy, the DWT was measured at the anterior bladder wall with the use of a 7.5-MHz linear ultrasound array (4, 9). With the assistance of magnification, the adventitia, detrusor, and mucosa were identified. When the bladder was full, two ultrasonographic meas-urements of the anterior bladder wall in longitudinal scan and transverse scan were recorded, and the average of the two measurements was taken as the final DWT value in millimeters (mm) (DWT-1) (Fig. 1a). In addition, bladder volume was calculated by measuring the intravesical diameters of bladder height, depth, and width. The bladder volume was calculated
Figure 1. a, b. Ultrasound measurements of detrusor wall thickness (DWT). Between the mucosa and adventitia (i.e., hyperechogenic lines), the detrusor was seen and measured (a, arrow). The measurement of DWT when the bladder was empty (DWT-2) (b, arrow).
b
a
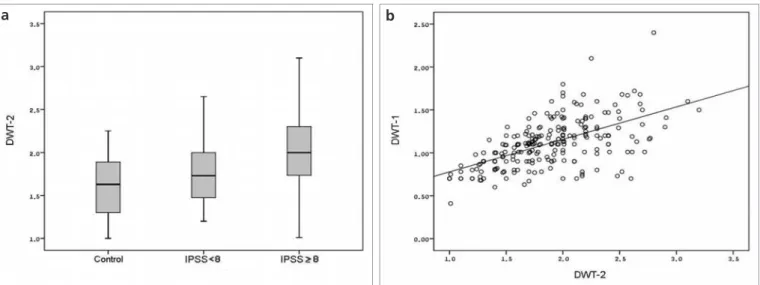
Figure 2. a, b. Mean DWT-2 values with standard errors in each group (a). Positive correlation between DWT-1 and DWT-2 was seen (r=0.584,
P < 0.001) (b). DWT, detrusor wall thickness ; IPSS, International Prostate Symptom Score.
b
a
For multiple comparisons of groups, post-hoc Scheffe test for parametric variables and Mann-Whitney U test for non-parametric variables (Bonferroni adjusted P values were given) were used. Spearman correlation coefficient was obtained to investigate the corre-lation between continuous variables. Two-tailed P value of < 0.05 was ac-cepted as statistically significant. Results
The mean age for the whole study population was 60.0±0.6 years (medi-an, 59 years). Mean IPSS for the whole
group was 8.0±0.4 (median, 8). Mean and median values for bladder and prostate volumes, DWT measurements and PVR are given in Table 1. The mean age of the control group was sig-nificantly lower than the study groups. Both the bladder and prostate volumes in Group 2 were statistically signifi-cantly higher than the control group and Group 1. The mean DWT-1 value was significantly lower in the control group when compared to Groups 1 and 2. However, when study groups were compared with each other, no statisti-cal significance was seen (1.12 vs. 1.17
mm). In contrast, the mean PVR and DWT-2 values were significantly differ-ent in each group, indicating a gradual increase with the increase in symptom severity (Table 1; Fig. 2a).
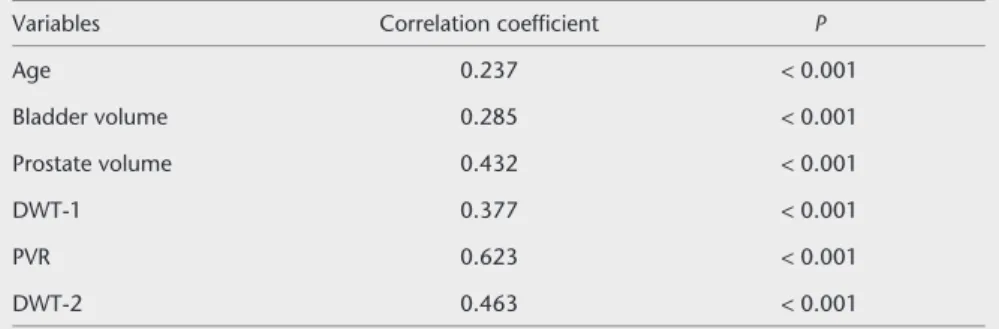
There was a significant correla-tion between IPSS quescorrela-tionnaire re-sults and all individual parameters (P < 0.001; linear regression analysis); the PVR and DWT-2 values revealed especially strong positive correla-tions with symptom severity and IPSS (Spearman’s correlation coefficients were 0.623 and 0.463, respective-ly; Table 2). When the correlations
Table 1. Baseline data and the comparative analysis of groups
Parameters Control group (n=51) Group 1 (n=60) Group 2 (n=132) P
Agea,b (years) 54.67±9.99 53 (30–79) 61.63±9.70 59 (43–83) 61.32±8.60 60 (49–86) < 0.001 Bladder volumeb,c (mL) 286.1±134.8 245 (127–700) 266.8±81.2 272 (100–620) 305.8±61.8 299 (140–500) < 0.001 Prostate volumeb,c (mL) 20.81±10.58 18 (5.42–49) 24.96±17.82 20 (7–103) 33.11±19.34 28 (4.95–147) < 0.001 DWT-1a,b (mm) 0.96±0.18 0.92 (0.63–1.42) 1.12±0.31 1.10 (0.68–2.4) 1.17±0.27 1.18 (0.41–2.1) < 0.001 PVRa,b,c (mL) 21.10±9.55 20 (10–67) 46.12±42.29 29.5 (10–281) 62.91±33.67 60.5 (10.56–164.49) < 0.001 DWT-2a,b,c (mm) 1.60±0.38 1.63 (1–2.9) 1.79±0.38 1.73 (1.2–2.8) 2.03±0.40 2 (1.01–3.2) < 0.001
Data are presented as the mean±standard deviation and median (min–max).
Group 1, mildly symptomatic men with IPSS scores <8; Group 2, moderate to severe symptomatic men with IPSS scores ≥8.
aP < 0.05, control group vs. Group 1 bP < 0.05, control group vs. Group 2 cP < 0.05, Group 1 vs. Group 2
between each ultrasonographic pa-rameters were studied, the strongest correlation (r=0.584; P < 0.001) was found between the 1 and DWT-2 (Fig. DWT-2b). Another strong correlation was also present between the PVR and prostate volume (r=0.532; P < 0.001). Discussion
In 2002, Tubaro and Miano (11) ex-plained that the thickening of the de-trusor muscle resulted from increased workload, similar to the heart in which the muscular wall thickens due to a valve stenosis. Afterwards, studies started to be published revealing the predictive value of DWT in men with BOO (7, 9, 10, 12). In 2007, Kessler et al. (12) found a significant correla-tion between DWT and pressure flow studies (PFS). They concluded that DWT can predict BOO as well as PFS and concluded that it can replace PFS in the diagnosis of BOO. Nevertheless, PFS is currently the gold standard tech-nique for the differentiation of BOO and detrusor hypocontractility. Except for this indication, PFS is an optional test for the routine evaluation of eld-erly men with LUTS (13, 14) as it is ex-pensive and invasive. Klinger et al. (15) observed severe complications, such as urinary retention and gross hematuria during or after urodynamic investiga-tions, in up to 19% of patients. Thus, we did not perform PFS or other kinds of urodynamic investigations in our study population.
Oelke et al. (9) conducted a study in-cluding 160 men older than 40 years, of whom 75 had BOO according to PFS. Among noninvasive diagnostic modalities, such as uroflowmetry, PVR or prostate volume, DWT was found to
be the most accurate test to determine BOO. In our study, all ultrasonograph-ic measurements (i.e., PVR, DWT, pros-tate, and bladder volume) were identi-fied as significant predictive factors for BOO/LUTS (Table 2). In addition to the noninvasive feature of these measure-ments, ultrasonographic measurement of the bladder wall showed a low intra- and inter-observer variability (16, 17). Thus, routine use and determination of certain cut-off values may be possi-ble in the near future for this diagnos-tic modality. However, the definition of normal values of DWT for different age groups and gender remains a criti-cal issue. For this purpose, we designed our study protocol with a control group. To eliminate gender difference, we excluded females and included men without LUTS/BOO and men with IPSS=0 in the control group.
Some authors proposed to measure DWT only to receive more detailed information about the detrusor mus-cle and the status of musmus-cle decom-pensation (7, 18). In ultrasonographic images, the mucosa and adventitia appear hyperechogenic (Fig. 1), but the adventitia may not always be dis-criminated from the perivesical tissue, which is also hyperechogenic (18). Consequently, marker placement in perivesical tissue instead of adventitia would cause a false increase in bladder wall thickness (BWT). As the detrusor appears hypoechogenic (4), more accu-rate and reliable measurements may be obtained by evaluating DWT instead of BWT. Furthermore, the thickness of the mucosa and adventitia may be af-fected by infection or cancer. For this reason, we preferred to measure DWT instead of BWT.
To the best of our knowledge, our study was the first to evaluate the predictive value of DWT measured when the bladder was empty (DWT-2). Although, some authors concluded that DWT or BWT measurements were influenced by bladder volume (6, 7), we did not observe a significant corre-lation between the bladder volume and DWT measurements. Hakenberg et al. (5) evaluated 488 patients and volun-teers of both genders and different age groups to determine the BWT differenc-es in normal adults and men with mild LUTS. They observed a weak negative correlation (r=-0.12). Their data gave a correction factor of -0.00108 mm in BWT per mL increase in the bladder volume. This finding means a 100 mL increase in bladder volume causes the BWT to be corrected by 0.108 mm. In practice, this change is quite negligi-ble and small when compared to the ultrasonographic measurement errors. Hence, according to us, the operator must not insist on measuring DWT when the bladder is full or distended. In our study, measurements done when the bladder was empty were sta-tistically more suggestive for LUTS. In the current study, DWT-2 was strongly correlated with DWT-1 measurements (Fig. 2b). Therefore, the combined use of PVR with DWT-2 values may better predict moderately-to-severely symp-tomatic men from mildly sympsymp-tomatic cases (Table 1; Fig. 2a).
Several limitations of the present study should be considered. Although all of the ultrasonographic measure-ments were made by the same radiolo-gist (U.D.) who was blinded to the IPSS results and LUTS severity of the men in the study groups, ultrasonography itself is a subjective assessment modality and is operator dependent. Currently, DWT measurement techniques have started to become standardized through nu-merous studies (4, 5, 7, 9, 10, 19). It was previously demonstrated that DWT de-pends only on gender, bladder filling, and LUTS severity (7, 18), and DWT was not affected by patient age (19). As all of our patients were male, the only variables that might affect DWT meas-urements were bladder volume and IPSS. Although IPSS was found to be di-rectly correlated with both DWT-1 and DWT-2 measurements, this was not the case for bladder volume. In correlation analysis, no correlation was found be-tween bladder volume and DWT values
Table 2. Spearman correlation coefficients for variables vs. mean IPSS scores
Variables Correlation coefficient P
Age 0.237 < 0.001 Bladder volume 0.285 < 0.001 Prostate volume 0.432 < 0.001 DWT-1 0.377 < 0.001 PVR 0.623 < 0.001 DWT-2 0.463 < 0.001
IPSS, International Prostate Symptom Score; DWT, detrusor wall thickness; PVR, postvoid residual urine volume.
(P values were 0.994 for DWT-1 and 0.355 for DWT-2). Thus, it is too dif-ficult to determine objective, standard-ized cut-off values for DWT measure-ments either when the bladder is full or empty. Furthermore, DWT measure-ments can only predict LUTS that in-cludes subvesical obstruction. They are not able to detect abnormalities such as detrusor overactivity during bladder filling or emptying. Those abnormali-ties can only be demonstrated through urodynamic studies. Another limita-tion to the study was that our control group was not age-matched. In the lit-erature, however, the measurement er-ror of ultrasonography was found to be even more significant than BWT differ-ences in different age groups (5). Thus, we feel that the control group not be-ing age-matched is not a significant limitation.
In conclusion, suprapubic transab-dominal ultrasonographic assessment of the lower urinary tract in a nonin-vasive manner allows clinicians to as-sess LUTS severity in men without any morbidity. The technique is accurate, simple, reliable and quick (i.e., it can be performed in less than 2 min), and intra- and inter-observer variability is low. We believe that the ultrasound measurements of DWT (either when the bladder is distended or empty), PVR, and bladder and prostate volume measurements are promising nonin-vasive tools to diagnose LUTS or BOO in men. Both the DWT (DWT-1 and DWT-2) and PVR measurements have demonstrated an acceptable ability to differentiate symptomatic cases from healthy subjects. If only information concerning LUTS is required, the com-bined use of DWT-2 and PVR might replace invasive procedures, such as PFS, in the future. Given that no cut-off values for those parameters have
yet been identified, however, it is cur-rently better to use those parameters to assess the progression of symptom se-verity during the follow-up. To further advance the efficacy and scope of this clinical technique, continued studies are warranted.
Conflict of interest disclosure
The authors declared no conflict of interests.
References
1. Roehrborn CG, McConnell JD. Etiology, pathophysiology, epidemiology, and natural history of benign prostatic hy-perplasia. In: Campbell’s urology. 8th ed. Philadelphia: Saunders, 2002; 1309–1311. 2. Abrams P. New words for old: lower
uri-nary tract symptoms for “prostatism”. BMJ 1994; 308:929–930.
3. Levin RM, Haugaard N, O’Connor L, et al. Obstructive response of human bladder to BPH vs. rabbit bladder response to partial outlet obstruction: a direct comparison. Neurourol Urodyn 2000; 19:609–629. 4. Kojima M, Inui E, Ochiai A, et al. Ultrasonic
estimation of bladder weight as a measure of bladder hypertrophy in men with in-fravesical obstruction: a preliminary re-port. Urology 1996; 47:942–947.
5. Hakenberg OW, Linne C, Manseck A, et al. Bladder wall thickness in normal adults and men with mild lower urinary tract symptoms and benign prostatic enlarge-ment. Neurourol Urodyn 2000; 19:585– 593.
6. Belal M, Abrams P. Noninvasive methods of diagnosing bladder outlet obstruction in men. Part 1. Non-urodynamic approach. J Urol 2006; 176:22–28.
7. Oelke M, Höfner K, Wiese B, Grünewald V, Jonas U. Increase in detrusor wall thickness indicates bladder outlet obstruction (BOO) in men. World J Urol 2002; 19:443–452. 8. Barry MJ. Evaluation of symptoms and
quality of life in men with benign prostatic hyperplasia. Urology 2001; 58:25–32. 9. Oelke M, Höfner K, Jonas U, de la Rosette
JJ, Ubbink DT, Wijkstra H. Diagnostic ac-curacy of noninvasive tests to evaluate bladder outlet obstruction in men: detru-sor wall thickness, uroflowmetry, postvoid residual urine, and prostate volume. Eur Urol 2007; 52:827–834.
10. Işikay L, Turgay Akgül K, Nuhoğlu B, et al. Lower urinary tract symptoms, prostate volume, uroflowmetry, residual urine vol-ume and bladder wall thickness in Turkish men: a comparative analysis. Int Urol Nephrol 2007; 39:1131–1135.
11. Tubaro A, Miano L. Managing the con-sequences of obstruction. Eur Urol Suppl 2002; 1:21–27.
12. Kessler TM, Gerber R, Burkhard FC, Studer UE, Danuser H. Ultrasound assessment of detrusor thickness in men. Can it pdict bladder outlet obstruction and re-place pressure flow study? J Urol 2006; 175:2170–2173.
13. Roehrborn CG, Bartsch G, Kirby R, et al. Guidelines for the diagnosis and treatment of benign prostatic hyperplasia: a com-parative international overview. Urology 2001; 58:642–650.
14. de la Rosette JJ, Alivizatos G, Madersbacher S, et al. EAU guidelines on benign prostatic hyperplasia (BPH). Eur Urol 2001; 40:256– 263.
15. Klinger CH, Madersbacher S, Djavan B, et al. Morbidity of the evaluation of the lower urinary tract with transurethral multichannel pressure-flow studies. J Urol 1998; 159:191–194.
16. Müller L, Bergström T, Hellström M, Svensson E, Jacobsson B. Standardized ultrasound method for assessing detrusor muscle thickness in children. J Urol 2000; 164:134–138.
17. Naya Y, Kojima M, Honjyo H, Ochiai A, Ukimura O, Watanabe H. Intraobserver and interobserver variance in the meas-urement of ultrasound-estimated blad-der weight. Ultrasound Med Biol 1998; 24:771–773.
18. Oelke M, Höfner K, Jonas U, Ubbink D, de la Rosette J, Wijkstra H. Ultrasound measurement of detrusor wall thickness in healthy adults. Neurourol Urodyn 2006; 25:308–317.
19. Jequier S, Rousseau O. Sonographic meas-urements of the normal bladder wall in children. Am J Roentgenol 1987; 149:563– 566.