www.arccjournals.com/www.legumeresearch.in
*Corresponding author’s e-mail: eekim_55@hotmail.com
2Departmentof Field Crops, Faculty of Agriculture, Ahi Evran University, 40100 Kirsehir, Turkey.
Pearson and canonical correlations between the root properties and some yield
components of chickpea (Cicer Arietinum L.)
Ufuk Karadavut1 andOmer Sozen*
Department of Biometry and Genetics, Faculty of Agriculture, Ahi Evran University, Kirsehir-40100, Turkey.
Received: 14-02-2017 Accepted: 21-04-2017 DOI:10.18805/lr.v40i04.9009
ABSTRACT
This study was carried out at the research and practice areas of Ahi Evran University (Kirsehir / Turkey) between 2012 and 2013. The Azkan chickpea cultivar was used for our study material. This study was conducted using a randomized blocks split-plot design using four replications. The Pearson correlation coefficient was used to study the relationship between the variables. Two separate sets for the root and root characteristics were investigated by canonical correlations. A negative correlation was observed between the root weight and the time of sowing where the significance of the relationship was determined to be r = - 0.836**.The significance between root weight and yield were observed to be positive and the significance of the relationship was determined to be r = 0.671**. The canonical correlation between a high growth rate of roots and the features above ground was also determined.
Key words: Canonical correlations, Chickpea, Pearson, Root properties, Yield components. INTRODUCTION
The fast population incr ease seen in most developing countries, and the efforts to meet the food needs for that increasing population may be possible with increased agricultural production (Kour et al., 2016). The climate diversity in this country provides an opportunity for increasing both product diversity and the application of different product patterns. The protein need, which is one of the most important nutritonal sources, is a primary consideration in the product pattern planning (Pingoliya et
al., 2015). Protein sources originate from both animals and plants. This country consumes mainly proteins of plant origin. Among these, edible legumes that contain protein varying from 18% to 35% are the primary sources. Legumes provide 22% of vegetable protein and 7% of carbohydrates in human nutrition, and 38% of protein and 5% of carbohydrates in animal nutrition (Wery and Grinac, 1983). One of the most significant legumes, in terms of the country’s ecology and production culture, is the chickpea.
Although the chickpea is ranked number two wordwide among the edible legumes with 13.571.628 hectar es of cultivated area an d 13.119.224 tons of production, it takes first place in this country with 423.557 hectares of cultivated area and 506.000 tons of production, and while the average yield is 970 kg ha-1 in other countries which cultivate the chickpea, this value is about 1.170 kg ha-1 in this country (Anonymous, 2015). Although a specific chickpea cultivation culture has developed in this country, a
decrease in cultivation areas and production has been questioned in recent years. In order to reverse this, the ways of providing an increased yield have been analysed and are still being investigated. Along with the development of high-yielding genotypes, the decrease observed in the cultivation areas may be reversed. It is known that there are slowdowns in the growth above ground in genotypes that do not develop good root growth (Karadavut and Tozluca, 2005). Therefore, the root growth can have a very significant place in terms of yield and the nutrients obtained (Yavas and Unay, 2016).
It is well known that there are also significant correlations between the root growth and other characteristics of the plants (McDonald and Fischer, 1987; Connor and Loomis, 1991; Lampurlanes et al., 2002), and it has been revealed that the sowing time and row spacing has an effect on root growth (Tennant, 1980). Apart from the variation in sowing time and the row spacing of plants between cultivars, they show differences in accordance with the ecological regions (Kiranmai et al., 2016). The area where the study was conducted is in the central part of Turkey, which is a significant area in terms of chickpea cultivation. In this study, our aim is to investigate the correlations between some properties of the root and body by determining the root and body growth of chickpea plants that are sown on different sowing dates and with different row spacings.
MATERIALS AND METHODS
This study was conducted in a test area of the Ahi Evran University Research Application Field over 2 years
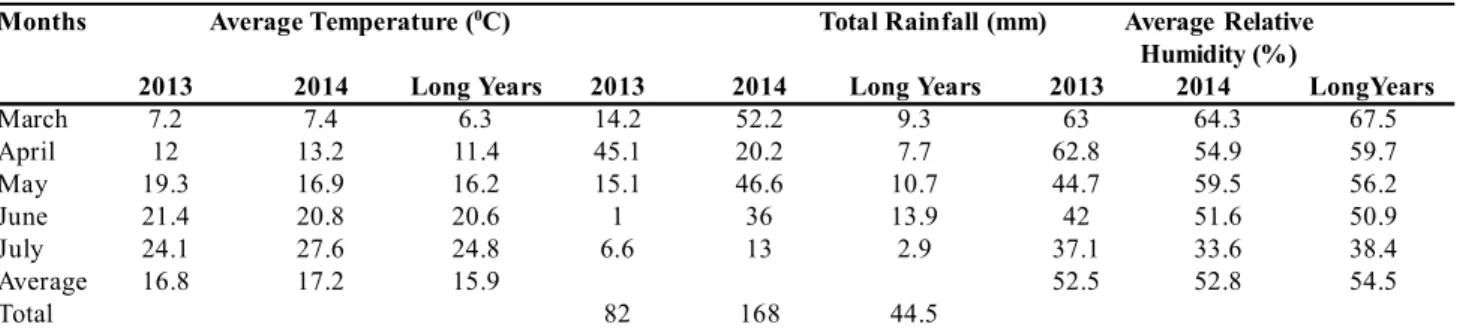
Months Average Temperature (0C) Total Rainfall (mm) Average Relative
Humidity (%)
2013 2014 Long Years 2013 2014 Long Years 2013 2014 LongYears
March 7.2 7.4 6.3 14.2 52.2 9.3 63 64.3 67.5 April 12 13.2 11.4 45.1 20.2 7.7 62.8 54.9 59.7 May 19.3 16.9 16.2 15.1 46.6 10.7 44.7 59.5 56.2 June 21.4 20.8 20.6 1 36 13.9 42 51.6 50.9 July 24.1 27.6 24.8 6.6 13 2.9 37.1 33.6 38.4 Average 16.8 17.2 15.9 52.5 52.8 54.5 Total 82 168 44.5
Table 1: Climate data for Kirsehir*
*Kiirsehir Provincial Meteorology Directorate
from 2013 to 2014. At the end of the test, when soil analysis was conducted on the test field where the research had been performed for two years, it was determined that the pH was 7.72, the soil had a loamy structure, the organic substance content remained at a low level of 1.75, it recorded a medium level (15.34%) of lime and had a salt-free structure: it also had a sufficient level in terms of potassium content (1.44 Me/100 g) but was insufficient in terms of phosphorus (2.16 ppm).
In the province of Kirþehir, which is located in the Central Anatolia Region, it is hot and dry in summer, rainy in the spring, and harsh cold in the winter. As well as the two years’ of data from the study that was conducted, the climate data (precipitation, temperature and relative humidity) for the average of many years is given in Table 1.
When Table 1 is reviewed, it is seen that there was a similarity in terms of the average temperature and relative humidity, but between the two years of data and many years of data, the province received 2 to 4 times more rain between 2013 and 2014 during the growing seasons, compared to the total amount of rain over many years.
In the study, the Azkan chickpea variety, which was registered by the Directorate of the Transitional Zone Agricultural Research Institute, was used in the study. The experiment was studied using a randomized blocks design test with 4 repetitions in accordance with the test pattern. The first year’s test sowings were conducted on November 17, and the second year’s test sowings were conducted on November 13. The sowing procedure was carried out manually in the areas marked out. Along with the sowing, fertilizer was applied in the form of 3 kg of pure nitrogen and 6 kg of phosphorusper decare. Irrigation was not applied to the cultivation, but weed control was manually applied once to all (land) parcels. The parcel dimensions were adjusted in accordance with the row spacing. Every parcel consisted of 4 rows over a length of 5 meters. In the test harvesting, one line per edge and 50 cm per upper edges were taken as edge impact, and calculations were made on the remaining part that was harvested. The correlation analysis was applied in order to determine any correlation
between the variables. After the correlation analysis (canonical correlation) was conducted, the root properties and properties above ground were considered as two different sets, and inter-set correlation analysis was then conducted (Tatlidil, 1996). While the correlation analysis gives information on correlations between two variables, this remains unusable when the number of variables increases. However, canonical correlation analysis is a method that is used for revealing correlations between the datasets including two or more variables (Tabachnick and Fidell, 2007). This method may give valuable information about the correlations by calculating any correlations between two variable groups. In the study, common canonical correlation (R2
k) was also calculated in order to determine at what size a change within a set was explained by another set. The data obtained were analyzed with the STATISTICA 6.0.V statistics software program and the results were assessed (Duzgunes et al., 1987).
RESULTS AND DISCUSSION
The result of correlation analysis, which shows the correlations between the variables, is shown in Table 2. When Table 2 was reviewed, it was determined that fresh body weight showed significant and positive correlations with dry body weight (r = 0.866**), fresh root weight (r =0.735**), dry root weight (r = 0.678*), fresh leaf weight (r = 0.993**) and dry leaf weight (r = 0.892**). In spite of that, a high rate of positive correlations were revealed between the biological yield and the pod number on the plant (r = 0.987**), seed number in the plant (r = 0.968**) and yield values per plant (r = 0.979**), while significant and positive correlations were determined between the fresh root weight and dry root weight (r = 0.916**), fresh leaf weight (r =0 . 6 9 8 * ) a n d n o d u l e number (r = 0.694*). When they were reviewed in terms of yield, it was seen that the nodule weight had a positive and significant effect on the yield (r = 0.730**) and dry root weight (r = 0.452**). The study yielded valuable information showing that the yield may also increase as the root weight and nodule weight increases. Kashiwagi et al. (2008) determined that there was a significant correlation between the root length and vegetative growth. Mambani and Lal (1983) stated that there was a significant linear correlation
F re sh D r y F re sh D r y F re sh D ry N o d u le N o d u le B io lo g ic a l N u m b e r N u m b e r S ee d P la n t 1 0 0 -S e ed B o d y B o d y R o o t R o o t L ea f L ea f N u m b er W ei g h t Y ie ld o f P o d i n o f S ee d i n Y ie ld H ei g h t W ei g h t W ei g h t W ei g h t W ei g h t W ei g h t W ei g h t W ei g h t P la n t P la n t D ry B o d y 0 ,8 6 6 * * -W e ig h t F re sh R o o t 0 ,7 3 5 * * 0 ,7 6 0 * * -W e ig h t D ry R o o t 0 ,6 7 8 * 0 ,7 2 9 * * 0 ,9 1 6 * * -W e ig h t F re sh L e af 0 ,9 9 3 * * 0 ,8 3 7 * * 0 ,6 9 8 * 0 ,6 4 3 * -W e ig h t D ry L e af 0 ,8 9 2 * * 0 ,5 9 1 * 0 ,5 7 3 0 ,4 6 7 0 ,9 1 1 * * -W e ig h t N o d u le 0 ,2 3 3 0 ,3 9 3 0 ,6 9 4 * 0 ,6 0 1 * 0 ,2 0 3 0 ,0 0 2 -N u m b e r N o d u le -0 ,5 7 1 -0 ,5 0 3 -0 ,2 3 1 -0 ,1 3 5 -0 ,5 6 9 -0 ,5 2 5 -0 ,1 8 7 -W e ig h t B io lo g ic a l -0 ,2 6 5 -0 ,2 3 3 -0 ,1 1 1 -0 ,1 1 8 -0 ,2 7 1 -0 ,2 3 9 0 ,0 6 9 0 ,3 3 8 -Y ie ld N u m b er o f -0 ,3 4 7 -0 ,5 7 8 * -0 ,2 0 5 -0 ,1 7 5 -0 ,3 4 9 -0 ,3 1 2 -0 ,0 0 9 0 ,4 4 4 0 ,9 8 7 * * -P o d i n P la n t N u m b er o f -0 ,1 1 5 -0 ,3 3 0 -0 ,0 7 0 -0 ,0 4 3 -0 ,1 2 2 -0 ,1 4 8 0 ,0 7 6 0 ,1 7 5 0 ,9 6 8 * * 0 ,9 4 3 * * -S e ed i n P la n t S ee d Y ie ld -0 ,1 9 7 -0 ,0 8 2 -0 ,1 1 4 -0 ,1 0 9 -0 ,2 0 5 -0 ,1 7 3 0 ,0 4 3 0 ,2 6 4 0 ,9 7 9 * * 0 ,9 6 7 * * 0 ,9 7 8 * * -in P la n t P la n t h ei g h t 0 ,3 7 0 -0 ,2 2 6 0 ,2 6 3 0 ,1 7 6 0 ,3 7 3 0 ,2 4 1 0 ,3 0 6 -0 ,0 6 9 0 ,5 2 3 0 ,4 8 8 0 ,6 2 5 * 0 ,6 1 8 * -1 0 0 -S e e d 0 ,3 8 5 0 ,2 0 3 0 ,4 6 7 0 ,3 3 2 0 ,3 9 3 0 ,2 9 7 0 ,5 3 9 -0 ,0 0 2 -0 ,0 1 2 -0 ,1 8 8 0 ,0 0 8 0 ,0 6 7 0 ,7 0 1 * -W e ig h t Y ie ld -0 ,4 1 7 -0 ,4 5 0 -0 ,1 7 1 0 ,4 5 2 * * -0 ,3 9 1 -0 ,2 9 3 -0 ,2 6 9 0 ,7 3 0 * * -0 ,0 7 8 0 ,0 2 5 -0 ,1 8 7 -0 ,1 1 7 -0 ,4 1 3 -0 ,1 8 0 T a b le 2 : T h e re la ti o n sh ip s b et w ee n f ea tu re s in d if fe re n t so w in g t im e a n d r o w s p ac in g i n c h ic k p ea s c h ar ac te rs
between the root growth and yield. Gregory (1988) explained that this may only be determined by the humidity in the environment in their study conducted on broad bean plants; whereas, Rowse and Barnes (1979) stated that when the foodstuffs in the soil are in the areas closer to the soil surface it will in crease the cor relation coefficient and the significance.
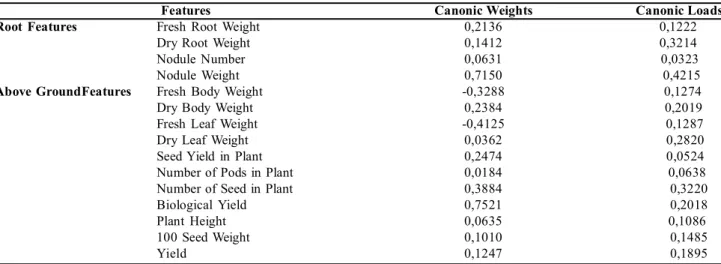
Kumar and Abbo (2001) and Kashiwagi et al. (2008) stated that there was a significant and positive correlation between the root growth and biological yield. The biological yield will increase or decrease along with the increase of root growth. The results that we obtained are in parallel with the results of earlier researchers (Karadavut and Tozluca, 2005; Patil et al., 2016). According to the results of the canonical correlation analysis, where inter-set correlations were investigated, the canonical weights and canonical loads which were calculated between the root properties and properties above ground are shown in Table 3. When Table 3 is reviewed, it is seen that the canonical loads of the roots (0.3214) and nodule weights (0.4215) are higher in terms of root properties when compared to other root properties.
Features Canonic Weights Canonic Loads
Root Features Fresh Root Weight 0,2136 0,1222
Dry Root Weight 0,1412 0,3214
Nodule Number 0,0631 0,0323
Nodule Weight 0,7150 0,4215
Above GroundFeatures Fresh Body Weight -0,3288 0,1274
Dry Body Weight 0,2384 0,2019
Fresh Leaf Weight -0,4125 0,1287
Dry Leaf Weight 0,0362 0,2820
Seed Yield in Plant 0,2474 0,0524
Number of Pods in Plant 0,0184 0,0638
Number of Seed in Plant 0,3884 0,3220
Biological Yield 0,7521 0,2018
Plant Height 0,0635 0,1086
100 Seed Weight 0,1010 0,1485
Yield 0,1247 0,1895
Table 3: Differences between the Canonic Weights and Canonic Loads in the root and above ground features
Canonic Variable Own Canonic Variable CanonicR2 Counter Canonic Variable
% Cumulative% % Cumulative%
Fresh Body Weight 0.0170 0.0170 0.014 0.0120 0.0120
Dry Body Weight 0.0230 0.0400 0.027 0.0384 0.0504
Fresh Leaf Weight 0.1022 0.1462 0.182 0.0983 0.1487
Dry Leaf Weight 0.1181 0.2643 0.173 0.1034 0.2521
Seed Yield in Plant 0.2163 0.4806 0.340 0.4113 0.6634
Number of Pods in Plant 0.1954 0.6760 0.274 0.1006 0.7640
Number of Seed in Plant 0.1831 0.8591 0.211 0.1093 0.8733
Biological Yield 0.0276 0.8867 0.015 0.0161 0.8894
Plant Height 0.0872 0.9739 0.028 0.0276 0.9170
100 Seed Weight 0.0062 0.9801 0.037 0.0052 0.9222
Yield 0.0019 1.0000 0.0043 0.0013 0.9235
Table 4: The variance values explained by the above ground features for the sets
In the assessment of properties above ground, in terms of canonical levels, it is seen that the highest canonical load is the seed number in the plant (0.322). The lowest canonical load was observed in the seed yield in the plant (0.0524). The redundancy index was calculated in order to show the correlation among the variable sets more clearly. The redundancy indexes refer to the part accounted for by the canonical variables in the set. This value is obtained by multiplying the resulting variance ratio of the i. canonical variable with the square of the canonical correlation coefficient (i. eigenvalue) (Tabachnick and Fidell, 2007). Accordingly, the nodule weight contributes 41.22% of the change in the root, while the dry root weight, among all the root properties, contributes 32.15%. Both variables contibute 73.37% of the change that was observed in the first set. The correlations among these variables were determined to be significant. The number of variables increased in the second set. The dry body weight resulted in a variance ratio of 14.24%, the dry leaf weight resulted in a variance ratio of 15.41%, the pod number in the plant resulted in a variance ratio of 22.17% and the seed number in the plant resulted in a variance ratio of 22.63%. These four variables explained 74.45% of the change in the second set. The correlations
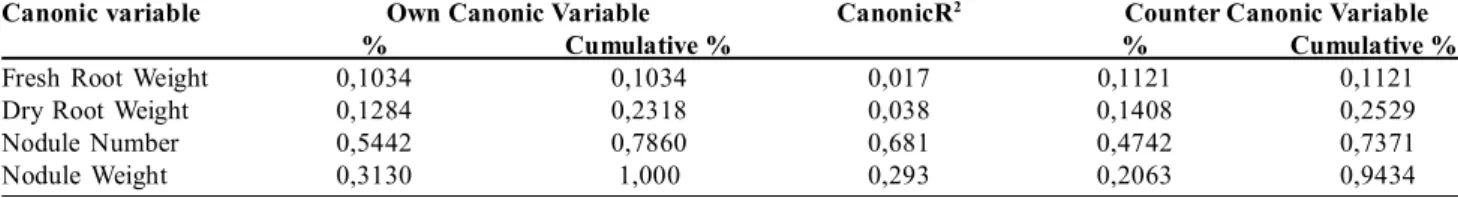
Canonic variable Own Canonic Variable CanonicR2
Counter Canonic Variable
% Cumulative % % Cumulative %
Fresh Root Weight 0,1034 0,1034 0,017 0,1121 0,1121
Dry Root Weight 0,1284 0,2318 0,038 0,1408 0,2529
Nodule Number 0,5442 0,7860 0,681 0,4742 0,7371
Nodule Weight 0,3130 1,000 0,293 0,2063 0,9434
Table 5: The variance values explained by the root features for the sets
among these variables were determined to be significant. The variance amounts explained by the properties above ground for the sets are shown in Table 4. This procedure is used in order to determine to what extent the canonical variables successfully explained the counter canonical variables.
The variance amounts contibuted by the properties above ground achieved the highest value for the yield per plant (0.4113). The seed number in the plant (0.1093), the dry leaf weight (0.1034) and the number of pods on the plant (0.006) followed this property. It is seen that the variances explained in other properties were at very low level. When it was reviewed in terms of total participation, the total amount of participation of the variance in canonical variable was 0.9235, which was very high. The high level of this value indicates that the canonical set (features above ground) may have been estimated very successfully. When canonical R2 values were reviewed, it was seen that the coefficients belonging to the seed yield in plant (R2 = 0.340), the number of pods on the plant (R2 = 0.274) and the seed number in the plant (R2 = 0.211) were prominently high. It is remarkable that the coefficient of determination (R2 = 0.0043) belonging to the yield was very low. Accordingly, the root properties don’t directly affect the yield compared to other properties. The most significant factor was the length of the cultivation season. Gale and Stanton (1995) looked at the growth of plants according to the length of the cultivation period, and stated that the plants for which the cultivation period was long showed a better growth. In the canonical study that they conducted on plant distribution in pastures, Wendy et al. (2004) determined that the coefficient of deter mination for the total con tr ibution was 0.88. Accordingly, they emphasized that the high level of this ratio explained how the dependent variables can be successfully predicted from the independent variable. The value of 0.9235 that we found was assessed as significant in terms of it being successful in terms of explaining the relationships. The variance amounts attributed to the root properties for sets
are shown in Table 5. When Table 5 is reviewed, it is seen to what extent the canonical variables successfully explained the counter canonical variables.
Th e var ian ce per centage explan ation was determined to be 0.9434 for the total root properties. While the effect of wet and dry root weights was very low, by contrast, the effect of nodule numbers and nodule weights was very high. When R2 values were reviewed, it was seen that the nodule number (R2 = 0.681) and nodule weights (R2 = 0.293) had a h igh coefficien t of deter min ation . Accordingly, it is seen that they estimated the canonical variables and counter canonical variables very successfully for root properties.
CONCLUSION
This study was conducted in order to determine the correlations between the root properties and the effects above ground, and the correlations among the characteristics affecting the yield for the Azkan chickpea variety sown under the ecological conditions of Kirþehir. It was understood that the characteristics affecting the yield could be improved along with an improvement in the root properties. It was revealed that early sowing is very significant and a guarantee for a high yield in the study, and in particular, to understand the requirements when conducting tests in dry areas. From this study, it was possible to make an assessment of the distinctive difference that was determined between the sowing in November compared to the sowing in February and March. The canonical correlation analysis was conducted by assessing the correlations between the effects above ground and the root properties for the groups, and in conclusion, it was determined that the correlations between the variable sets were significant. While the dry root weight and nodule weight had significant effects in the first set, the dry body weight, dry leaf weight, number of pods on the plant and number of seeds in the plant in the second set showed the clearest evidence and were found to be significant.
REFERENCES
Anonymous. (2015). http://faostat.fao.org/site/336/Desktop.aspx?PageID=336.
Connor, D.J. and Loomis, R.S. (1991). Strategies and tactics for water-limited agriculture in low rain fall Mediterranean climates. In: Acevedo, E., Fereres, E., Giménez, C., Srivastava, J.P. (Eds.), Improvement and Management of Winter Cereals Under Temperature, Drought and Salinity Stresses. Proceedings of the ICARDA-INIA Symposium, Córdoba, October 26–29, 1987.
MAPA-INIA, Madrid, Spain, 441-465.
Duzgunes, O., Kesici, T., Kavuncu, O. and Gurbuz, F. (1987). Research and Trial Methods. Journal of Agricultural Faculty of Ankara
Gale, C. and Stanton, M.L. (1995). Responses of Snowbed Plant Species to Changes in Growing-Season Length, Ecology, 76 (5): 1546-1557. Gregory, P.J. (1988). Root growth of chickpea, faba bean, lentil, and pea and effects of water and salt stresses. R.J. Summerfield (Ed.),
World Crops. Cool-Season Food Legumes. Kluwer Academic Publishers, The Netherlands, 857-867.
Karadavut, U. and Tozluca, A. (2005). Growth analysis some characters in rye plants (Secale cereale L.) Growth of root and upper ground parts. J. Crop Res., (2): 1-10.
Kashiwagi, J., Krishnamurthy, L., Gaur, P.M., Chandra, S. and Upadhyaya, H.D. (2008). Estimation of gene effects of the drought avoidance root characteristics in chickpea (Cicer arietinum L.). Field Crops Research, 105 (1–2): 64-69.
Kiranmai, M.S., Venkataravana, P. and Pushpa, H.D. (2016). Correlation and path analysis studies in groundnut under different environment. Legume Research, 39 (6): 1048-1050.
Kour, R., Sharmabbo, B.C., Kumar, A., Kour, P. and Nandani, B. (2016). Study of physiological growth indices of chickpea in chickpea (Cicer arietinum) + mustard (Brassica juncea) intercropping system under different weed management practices.
Legume Research, 39 (3): 453-458.
Kumar, J. and Abbo, S. (2001). Genetics of flowering time in chickpea and its bearing on productivity in semiarid environments. Adv.
Agron., (72): 107-138.
Lampurlanés, J., Angás, P. and Cantero-Martýìnez, C. (2002). Tillage effects on water storage during fallow, and on barley root growth and yield in two contrasting soils of the semi-arid Segarra region in Spain. Soil and Tillage Research, 65 (2): 207-220. McDonald, G.K. and Fischer, R.A. (1987). The role of soil management in the maintenance of crop production in semi-arid environments.
In: Acevedo, E., Fereres, E., Giménez, C., Srivastava, J.P. (Eds.), Improvement and Management of Winter Cereals Under Temperature, Drought and Salinity Stresses. Proceedings of the ICARDA-INIA Symposium, Córdoba, October 26–29, 1987. MAPA-INIA, Madrid, Spain, 421-440.
Mambani, B. and Lal, R. (1983). Response of upland rice varieties to drought stress. I. Relation between root system development and leaf water potential. Plant Soil, (73): 59-72.
Patil, S.L., Loganandhani, N. and Ramesha, M.N. (2016). Evaluation of chickpea varieties under compartmental bunding in rainfed situation. Legume Research, 39 (6): 890-895.
Pingoliya, K.K., Mathur, A.K., Dotaniya, M.L. and Dotaniya, C.K. (2015). Impact of phosphorus and iron on protein and chlorophyll content in chickpea (Cicer arietinum L.). Legume Research, 38 (4): 558-560.
Rowse, H.R. and Barnes, A. (1979). Weather, rooting depth and water relations of broad beans a theoretical analysis. Agric. Met., (20): 381-391. Tabachnick, B.G. and Fidell, L.S. (2007). Using Multivariate Statistics, 5th ed. Boston: Allyn and Bacon.
Tatlidil, H. (1996). Applied Multivariate Statistical Analysis. Ankara.
Tennant, D. (1980). Effect of fallowing on cereal yields. West Australian J. Agric. (21):38-41.
Yavas, I. and Unay, A. (2016). Hormonal Changes and Root Growth in Crops Subjected to Waterlogging. Turk. J. Agric. Res. (3): 89-95. Wendy, K., Elizabeth, T., Kathryn, L., Eric, W., Virginia, L., Goldwasser, L., Micheli1, F., Bruce, E. and Rebecca, S. (2004). Distribution
of plants in a California serpentine grassland: are rocky hummocks spatial refuges for native species. Plant Ecology, (172): 159-171. Wery, J. and Grinac, P. (1983). Uses of Legumes and their economic importance. In Technical Handbook on Symbiotik Nitrogen