INTJORASS International Journal of Recreation and Sport Science 2018; 2(1);39-52
*Gazi University Institute of Educational Sciences, Physical Education and Sports Teaching Department, Ankara. **Bartın University School of Physical Education and Sports, Bartın
1This study was produced from Hasan Güler's thesis on "Research on the effect of leisure time motors on the students who are studying at Physical Education and Sports Colleges on the Motivation of Leisure Time (Bartın University Sample)". ___________________________________________________________________________________________________
The Arrival Date: 30.11.2018 INTJORASS
Acceptance Date: 20.12.2018 International Journal of Recreation and Sport Science 2018; 2(1);39-52
Investigation of the Effects of Leisure Time Constraints of the
University Students in Physical Education and Sport Scholls on
their Leisure Time Motivation: Bartın University Sample
1Hasan GÜLER* Mutlu TÜRKMEN**
Abstract
This study was conducted to determine the barriers to leisure time and motivation levels of university students, to compare them in terms of demographic variables and to determine the relationships between them. This study is a correlational survey model in which Leisure Time Motivation Scale and Barriers to Leisure Time Scale were used. The sample of the study consisted of 317 volunteers who study at Bartın University School of Physical Education and Sports. The statistical methods used for the evaluation of research data are frequency distributions, T-test for binary groups, ANOVA analysis for multiple groups and pearson correlation analysis for determining the relationship. The results of the study revealed that the perceptions of the participants about barriers to leisure time were above average and this was due to the perceptions of lack of relevant facilities and lack of sufficient time. Higher identification-introjection and knowing-succeeding dimensions were more significant in leisure time motivation levels. There was no relationship between barriers to leisure time and leisure time motivation levels. When the findings of the study were evaluated in terms of demographic variables, significant differences were determined for sex and age variables.
Keywords: Leisure constraints, Leisure motivation, Recreation.
Beden Eğitimi ve Spor Yüksekokullarında Öğrenim Gören Öğrencilerin Boş Zaman Engellerinin Boş Zaman Motivasyonlarına Etkisinin Araştırılması
(Bartın Üniversitesi Örneği)
Öz
Bu araştırma, üniversite öğrencilerinin boş zaman engelleri ve motivasyon düzeylerinin tespit edilmesi, demografik değişkenler açısından karşılaştırılması ve aralarındaki ilişkilerin belirlenmesi amacıyla yapılmıştır. İlişkisel tarama modelindeki araştırmada, Boş Zaman Engelleri Ölçeği ve Boş Zaman Motivasyon Ölçeği kullanılmıştır. Araştırmanın örneklemini, Bartın Üniversitesi beden Eğitimi ve Spor Yüksekokulunda Öğrenim Gören 317 gönüllü katılımcı oluşturmuştur. Araştırma verilerinin değerlendirilmesinde istatistiki yöntem olarak; frekans dağılımları, ikili gruplar için T-testi, çoklu gruplar için anova analizleri ve ilişkiyi belirlemek için pearson korelasyon analizi kullanılmıştır. Araştırmadan elde edilen sonuçlar incelendiğinde katılımcıların boş zaman engellerine yönelik algılarının ortalamanın üzerinde olduğu ve bu algının tesis eksikliği ile yeterli zaman bulma boyutlarından kaynaklandığı belirlenmiştir. Boş zaman motivasyon düzeylerinde yüksek özdeşim-içe atım ve bilmek-başarmak boyutlarının daha belirgin olduğu tespit edilmiştir. Boş zaman engelleri ile boş zaman motivasyon düzeyleri arasında ilişki saptanamamıştır. Araştırmadan elde edilen bulgular demografik değişkenler açısından değerlendirildiğinde her iki ölçek arasında cinsiyet ve yaş değişkenleri arasında anlamlı farklılıklar belirlenmiştir.
_____________________________________________________________________________________
________________________________________________________________________________________________________________________ INTJORASS
International Journal of Recreation and Sport Science 2018; 2(1);39-52 40
INTRODUCTION
Recreational activities can be effective in terms of the socialization of individuals and being compatible with the society (Özkalp, 1997). Many studies conducted in various fields have observed that recreational activities have significant positive effects on individuals and social health throughout the urbanization process. These studies showed that despite the positive contributions of participating in recreational activities, individuals do not or could not participate in these beneficial activities due to various obstacles. In the free time literature, the concept of “Barrier” refers to “the reasons that prevent or restrict the individual's participation in recreational activities in his spare time and those can only be eliminated by the individual” (Karaküçük, 2005).
There is a link between people and places for recreational activities. Accordingly, factors such as the small size of housing and being away from nature create some barriers to participating in recreational activities, as well as the crowd and fast pace of city life, technology, etc., are just a few other reasons that may create barriers to participation in recreational activities. These kinds of obstacles prevent people’s use of their energies for relaxation and discovering their different abilities. In such an environment, people feel under constant pressure and stress, and the need for more energy consumption, innovation and change leads to different problems especially for the younger population.
Although it is accepted that the activity participation goals, expectations, satisfaction points and activity choices depend on personal preferences, it is crucial to inform individuals about motivational factors that encourage participation in recreational activities. This awareness will enable individuals to effectively engage in different activities in their leisure time. Participating in recreational activities with the contribution of various motivators will be an important factor in increasing the life quality or life satisfaction of individuals (Soyer et al., 2017).
Recreational activities those individuals engage in for their happiness and satisfaction are important in every stage of their lives (Soyer et al., 2017).
University education process is one of these stages. This process can be defined as one of the most challenging stages of life as finding identity, adopting the national and universal values of the society, adaptation, getting responsibilities in the economic, social and academic fields and growing mature take place in this stage (Tel and Sarı, 2016). Universities take a more effective role in organizing recreational activities which constitute an important place in the social lives of individuals and societies (Mete & Ağaoğlu, 2003). University students utilise their leisure time and participate in recreational activities in a semi-organized way within the framework of the opportunities offered by their universities. By this means, universities play a guiding role for their students’ productive use of their time apart from their formal education.
The recreation programs prepared by universities and the related facilities increase the communication among the youth and they can also have foresight about other reasons for participation. It is observed that Turkish university students’ involvement in recreational activities increased day by day due to the development of university campuses and the devotion of the administrations in recent years, however, such activities are not sufficient in many universities (Balcı, 2003). The aim of this study is to examine the effects of barriers to leisure time on leisure time motivation in Department of Physical Education and Sports.
METHOD
The aim of this research is to determine the motivation levels of leisure time and barriers to leisure time for university students. Since the relations between these two variables is examined, correlational design is used for the study. Correlation method is used to investigate the relationship between two or more variables without interfering with these variables in any way (Büyüköztürk et al., 2014).
____________________________________________________________________________________
________________________________________________________________________________________________________________________ INTJORASS
International Journal of Recreation and Sport Science 2018; 2(1);39-52 41
Population and the Sample
The population of the study consisted of 1461 students at the School of Physical Education and Sports, Bartın University in 2016/2017 academic year. Considering the size of the population within the scope of the study, 285 students represent the population with 95% confidence interval and 5% margin of error. In this context, the sample of the study consists of 317 students selected from the related population with simple random sampling method.
Data Collection Tools
In the study, barriers to leisure time scale and leisure time motivation scale were used to determine perceptions about barriers, motivation and the relationship between these two variables.
Barriers to leisure time scale is developed by Alexandris and Carroll (1997) and adapted to Turkish by Gürbüz et al. (2012). This scale aims to determine the perceived barriers to students' participation in recreational activities. Barriers to leisure time scale consists of 6 factors (individual psychology, lack of information, facility, lack of friends, time, lack of interest) and 18 items (Gürbüz et al., 2012). Leisure time motivation scale is developed by Pelletier et al. (1991) and adapted to Turkish by Mutlu (2008). The adapted scale consists of 22 items and 5 factors (lack of motivation, knowing and succeeding, stimulus living, identification - introjection and external regulation).
Cronbach Alpha (α) reliability coefficient values obtained from barriers to leisure time scale and sub-factors ranged from 0.61 to 0.84. The reliability coefficients of the scale are: Individual psychology (.75), Lack of information (.74), Facility (.72), Lack of friends (.65), Time (.61), Lack of interest (.63), and the internal consistency coefficient of the items constituting the 6 factors of the
scale was .84. These values indicate that the scores obtained from the scales have high level of reliabilities.
Cronbach Alpha (α) reliability coefficient values of the leisure time motivation scale and sub-factors ranged between 0.60 and 0.83. The reliability coefficients of the scale are: Lack of motivation (.60), Knowing and succeeding (.73), Stimulus living (.61), Identification-introjection (.71), External regulation (.63) and the internal consistency coefficient of the items constituting the 5 factors of the scale was .83. These values show that the scores obtained from the scale in general and the sub-scales have high level of reliabilities.
Analyses of the Data
The data were analyzed using SPSS-20 statistical program. For each participant, 7 total points were calculated for barriers to leisure time scale and its sub-factors and 6 total points were calculated for leisure time motivation scale and sub-factors. To determine the distribution of these calculated points, skewness and kurtosis values were examined.
According to this, the skewness and kurtosis values of the 13 factors ranged from -1 to +1. These results indicate that the distribution is normal. Since the distribution of the data verified the assumption of normality, parametric methods were used in the analyses. In this context, “independent sample t-test” is used when the independent variables are two groups and “oneway variance analysis (ANOVA)” is used when the independent variables are more than two groups.
In addition, Pearson product-moment correlation coefficient was used to determine the relationship between scores obtained from both scales and sub-factors. In the interpretation of the results, 0.05 significance level was considered.
_____________________________________________________________________________________
________________________________________________________________________________________________________________________ 42
INTJORASS
International Journal of Recreation and Sport Science 2018; 2(1);39-52
FINDINGS
Table 1. Descriptive statistics for barriers to leisure time scale and its sub-factors
Factors N Min. Mak. X S
Individual psychology 317 3,00 12,00 7,88 (2,62) 2,01 Lack of information 317 3,00 12,00 8,34 (2,78) 2,05 Facility 317 3,00 12,00 8,89 (2,96) 1,97 Lack of friends 317 3,00 12,00 7,98 (2,66) 1,94 Time 317 3,00 12,00 8,40 (2,80) 1,70 Lack of interest 317 3,00 12,00 8,28 (2,76) 1,83
Barriers to leisure time 317 21,00 66,00 49,78(2,76) 7,66
In Table 3, descriptive statistics of the sample scores for barriers to leisure time in general and the sub-factors were given. According to the findings, the minimum score is 21 points from the 18-item scale which was scored with 4 points Likert, while the maximum score is 66 and the mean score is = 49,78 ( = 2,76). These findings show that the participants generally get more than medium scores on the leisure time scale. Accordingly, the
perceptions of the participants generally indicate that there are factors that hinder their leisure time. The lack of facilities ( = 2,96), lack of time ( = 2,80), lack of knowledge about leisure time ( = 2,78), lack of interest about leisure time ( = 2.76), lack of friends to spend leisure time (( = 2.66) and the individual's own psychology ( = 2.62) shape the perceptions.
Table 2. Descriptive statistics for leisure time motivation scale and its sub-factors
Factors N Min. Max. X S
Lack of motivation 317 3,00 15,00 10,01 (3,33) 2,62
Knowing and succeeding 317 7,00 30,00 21,97 (3,66) 3,84
Stimulus living 317 4,00 15,00 10,79 (3,59) 2,17
Identification introjection 317 9,00 30,00 22,17 (3,69) 3,67
External regulation 317 7,00 20,00 13,91 (3,47) 2,33
Leisure time motivation 317 46,00 107,00 78,88 (3,58) 10,60
Table 4 presents the descriptive statistics for participants’ scores of leisure time motivation scale in general and sub-factors. The findings revealed that the minimum score was 46 for the 22 items in the scale which was scored with 5 points Likert, the maximum score was 107 and the mean score was = 78,88’dir ( = 3,58).
These findings show that the participants generally get more than medium scores from
the leisure time motivation scale. Accordingly, it is observed that the participants' motivation for leisure time is slightly above the medium level. When the sub-factors are considered, the highest motivation factors are identification introjection ( = 3.69), knowing and succeeding ( = 3.66), stimulus living ( = 3.59), external regulation ( = 3.47) and lack of motivation =3.33) respectively.
_____________________________________________________________________________________
________________________________________________________________________________________________________________________ 43
INTJORASS
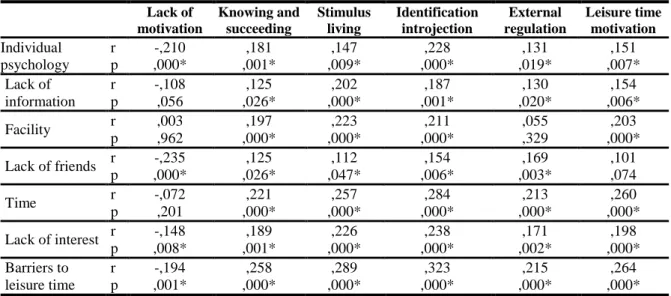
International Journal of Recreation and Sport Science 2018; 2(1);39-52 Table 3. Results of Pearson Product Moment Correlation Analysis of the relationship between barriers to leisure time and leisure time motivation levels of university students
Lack of motivation Knowing and succeeding Stimulus living Identification introjection External regulation Leisure time motivation Individual psychology r -,210 ,181 ,147 ,228 ,131 ,151 p ,000* ,001* ,009* ,000* ,019* ,007* Lack of information r -,108 ,125 ,202 ,187 ,130 ,154 p ,056 ,026* ,000* ,001* ,020* ,006* Facility r ,003 ,197 ,223 ,211 ,055 ,203 p ,962 ,000* ,000* ,000* ,329 ,000* Lack of friends r -,235 ,125 ,112 ,154 ,169 ,101 p ,000* ,026* ,047* ,006* ,003* ,074 Time r -,072 ,221 ,257 ,284 ,213 ,260 p ,201 ,000* ,000* ,000* ,000* ,000* Lack of interest r -,148 ,189 ,226 ,238 ,171 ,198 p ,008* ,001* ,000* ,000* ,002* ,000* Barriers to leisure time r -,194 ,258 ,289 ,323 ,215 ,264 p ,001* ,000* ,000* ,000* ,000* ,000*
*p<,05 Criteria: 0-0,30= Low; 0,40-0,60=Medium; 0,70-1,00=High Table 5 shows the correlations between scores
of the participants for leisure time motivations and sub-dimensions and barriers to leisure time and sub-dimensions. According to the findings, there is a low significant relationship between barriers to leisure time (the scale in general) and leisure time motivation (the scale in general) of the participants (r = 26, p =, 000 <, 05). Barriers to leisure time for university students explains about 7% of the leisure time motivations (r2 = 0,26X0,26 = 0,07). Barriers
to leisure time sub-factors; = Individual psychology r (r =, 15, p =, 007 <, 05),, lack of knowledge ”(r =, 15, p =, 006 <, 05), 15 facility = (r =, 20, p =, 000 <, 05, u Time motiv (r = 26, p =, 000 <, 05), ”lack of interest eksik (r =, 20, p =, 00 <, 05) with sub-dimensions of leisure time motivation scale only a ir friend lack 07 (r =, 10, p =, 07>, 05) is not statistically significant. It has a low level of relationship with leisure time scale.
Table 4. Independent Sample T-Test Results Related to Gender Comparison of Participants’ Perceptions Regarding Barriers to Leisure Time
Gender N X S t sd p
Individual psychology Female 130 8,16 1,89 2,08 315 ,038
Male 187 7,68 2,07
Lack of information Female 130 8,63 1,97 2,11 315 ,035
Male 187 8,14 2,09
Facility Female 130 9,02 1,82 ,97 315 ,328
Male 187 8,80 2,07
Lack of friends Female 130 8,06 2,07 ,67 315 ,501
Male 187 7,91 1,84
Time Female 130 8,50 1,73 ,86 315 ,387
Male 187 8,33 1,67
Lack of interest Female 130 8,35 1,78 ,56 315 ,573
Male 187 8,23 1,87
Barriers to leisure time Female 130 50,74 7,97 1,86 315 ,063
Male 187 49,11 7,39
*p<,05 Criteria: “Female=1”; “Male=2”
As seen in Table 8, although the average scores of the participants for barriers to leisure
_____________________________________________________________________________________
________________________________________________________________________________________________________________________ INTJORASS
International Journal of Recreation and Sport Science 2018; 2(1);39-52 44
50.74; men= 49.11), the difference was
statistically insignificant (t315=1,86; p=,063 >
,05).
When the subscales were analyzed, only the individual psychology (t315 = 2.08; p =, 038 <,
05) and lack of knowledge (t315=2.11; p =, 035
<, 05) showed a statistically significant difference in favor of women.
Even though women had higher scores for the rest of the subfactors; facility (t315=,97; p =,
328>, 05), lack of friends (t315 =, 67; p =,
501>, 05), time (t315=,86;p =, 387>, 05) and
lack of interest (t315 =, 56; p =, 573>, 05);
these differences were not statistically significant.
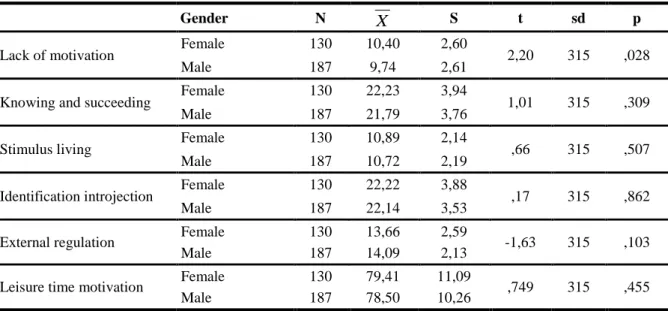
Table 5. Independent Sample T-Test Results Related to Gender Comparison of Participants’ Perceptions Regarding Leisure Time Motivations
Gender N X S t sd p
Lack of motivation Female 130 10,40 2,60 2,20 315 ,028
Male 187 9,74 2,61
Knowing and succeeding Female 130 22,23 3,94 1,01 315 ,309
Male 187 21,79 3,76
Stimulus living Female 130 10,89 2,14 ,66 315 ,507
Male 187 10,72 2,19
Identification introjection Female 130 22,22 3,88 ,17 315 ,862
Male 187 22,14 3,53
External regulation Female 130 13,66 2,59 -1,63 315 ,103
Male 187 14,09 2,13
Leisure time motivation Female 130 79,41 11,09 ,749 315 ,455
Male 187 78,50 10,26
*p<,05 Criteria: “Female=1”; “Male=2”
The findings of the analysis revealed that women had higher scores for the scale in general ( = 79,41) compared to men ( = 78,50) but women are statistically different in only lack of motivation subfactor ( = 10,40) (t315=2,20; p=,028 < ,05).
The other subfactors; knowing and succeeding (t315=1,01; p=,309 > ,05) stimulus living
(t315=,66; p=,507 > ,05), identification
introjection (t315=,17; p=,862 > ,05) and
external regulation (t315=-1,63; p=,103 > ,05)
had statistically indifferent results for men and women.
_____________________________________________________________________________________
________________________________________________________________________________________________________________________ 45
INTJORASS
International Journal of Recreation and Sport Science 2018; 2(1);39-52 Table 6. Results of One-Way Analysis of Variance (ANOVA) for the comparison of participants' perceptions on barriers to leisure time based on university departments
Class N X S F(3-313) P
Individual psychology
Physical Education and Sports Teaching 72 7,84 2,01
1,202 ,309
Coaching Training 114 7,97 1,99
Sports Management 36 7,30 2,27
Recreation 95 8,01 1,91
Lack of information
Physical Education and Sports Teaching 72 8,47 1,86
,264 ,851
Coaching Training 114 8,40 2,22
Sports Management 36 8,19 1,78
Recreation 95 8,24 2,10
Facility
Physical Education and Sports Teaching 72 8,73 2,07
,509 ,677
Coaching Training 114 8,83 1,98
Sports Management 36 9,19 2,02
Recreation 95 8,96 1,88
Lack of friends
Physical Education and Sports Teaching 72 7,88 1,98
1,165 ,323
Coaching Training 114 8,07 1,94
Sports Management 36 7,47 1,96
Recreation 95 8,13 1,88
Time
Physical Education and Sports Teaching 72 8,61 1,73
,631 ,596
Coaching Training 114 8,27 1,76
Sports Management 36 8,30 1,28
Recreation 95 8,43 1,74
Lack of interest
Physical Education and Sports Teaching 72 8,48 1,81
,885 ,449
Coaching Training 114 8,34 1,64
Sports Management 36 8,33 1,75
Recreation 95 8,04 2,08
Barriers to leisure time
Physical Education and Sports Teaching 72 50,04 7,25
,230 ,876
Coaching Training 114 49,89 7,18
Sports Management 36 48,80 6,99
Recreation 95 49,83 8,78
The analysis showed that students of Physical Education and Sports Teaching Department had higher scores on average for barriers to leisure time scale ( = 50,04) compared to
other departments ( = 49,89;
=48,80; = 49,83). However, the
differences between the scores are not statistically different for the subfactors and the scale in general (F(3-313)=,230; p=,876 >
,05). As a result, the factors seen important about barriers to leisure time are similar for the students at different departments of the university.
_____________________________________________________________________________________
________________________________________________________________________________________________________________________ 46
INTJORASS
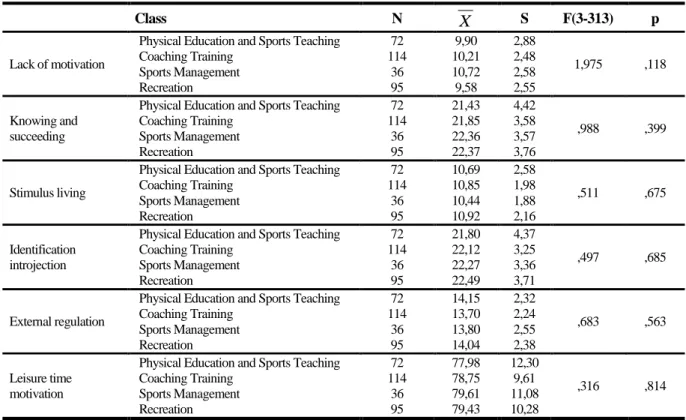
International Journal of Recreation and Sport Science 2018; 2(1);39-52 Table 7. Results of One-Way Analysis of Variance (ANOVA) for the comparison of participants' perceptions on leisure time motivations based on university departments
Class N X S F(3-313) p
Lack of motivation
Physical Education and Sports Teaching 72 9,90 2,88
1,975 ,118 Coaching Training 114 10,21 2,48 Sports Management 36 10,72 2,58 Recreation 95 9,58 2,55 Knowing and succeeding
Physical Education and Sports Teaching 72 21,43 4,42
,988 ,399
Coaching Training 114 21,85 3,58
Sports Management 36 22,36 3,57
Recreation 95 22,37 3,76
Stimulus living
Physical Education and Sports Teaching 72 10,69 2,58
,511 ,675 Coaching Training 114 10,85 1,98 Sports Management 36 10,44 1,88 Recreation 95 10,92 2,16 Identification introjection
Physical Education and Sports Teaching 72 21,80 4,37
,497 ,685
Coaching Training 114 22,12 3,25
Sports Management 36 22,27 3,36
Recreation 95 22,49 3,71
External regulation
Physical Education and Sports Teaching 72 14,15 2,32
,683 ,563 Coaching Training 114 13,70 2,24 Sports Management 36 13,80 2,55 Recreation 95 14,04 2,38 Leisure time motivation
Physical Education and Sports Teaching 72 77,98 12,30
,316 ,814
Coaching Training 114 78,75 9,61
Sports Management 36 79,61 11,08
Recreation 95 79,43 10,28
The findings showed that the differences between the scores are not statistically different for the subfactors and the scale in general (F(3-313)=,316; p=,814 > ,05). As a
result, the factors seen important about leisure time motivations are similar for the students at different departments of the university.
Table 8. Independent Sample T-Test Results for Participants’ Perceptions Regarding Barriers to Leisure Time based on engagement in active sports
Active sports N X S t sd p Individual psychology Yes 199 7,89 2,09 ,222 315 ,824 No 118 7,84 1,87
Lack of information Yes 199 8,47 2,03 1,412 315 ,159
No 118 8,13 2,07
Facility Yes 199 8,95 2,07 ,784 315 ,434
No 118 8,77 1,80
Lack of friends Yes 199 8,15 1,84 2,032 315 ,043
No 118 7,69 2,06
Time Yes 199 8,47 1,65 1,044 315 ,297
No 118 8,27 1,77
Lack of interest Yes 199 8,41 1,78 1,617 315 ,107
No 118 8,06 1,91 Barriers to leisure time Yes 199 50,37 7,75 1,774 315 ,077 No 118 48,79 7,45
_____________________________________________________________________________________
________________________________________________________________________________________________________________________ 47
INTJORASS
International Journal of Recreation and Sport Science 2018; 2(1);39-52 The findings showed that students who
engage in active sports are significantly different in only lack of friends subfactor (t315=2,032; p=,043 < ,05). Based on this
finding, it can be said that students who engage in active sports perceive lack of friends subfactor as a more important barrier to leisure time compared to the rest of the participants. In parallel to barriers to leisure
time scale in general; engagement in active sports doesn’t result in statistically difference perceptions about individual psychology (t315=,222; p=,824 > ,05), lack of information
(t315=1,412; p=,159 > ,05), facility (t315=,784;
p=,434 > ,05), time (t315=1,044; p=,297 > ,05)
and lack of interest (t315=1,617; p=,107 > ,05)
subfactors.
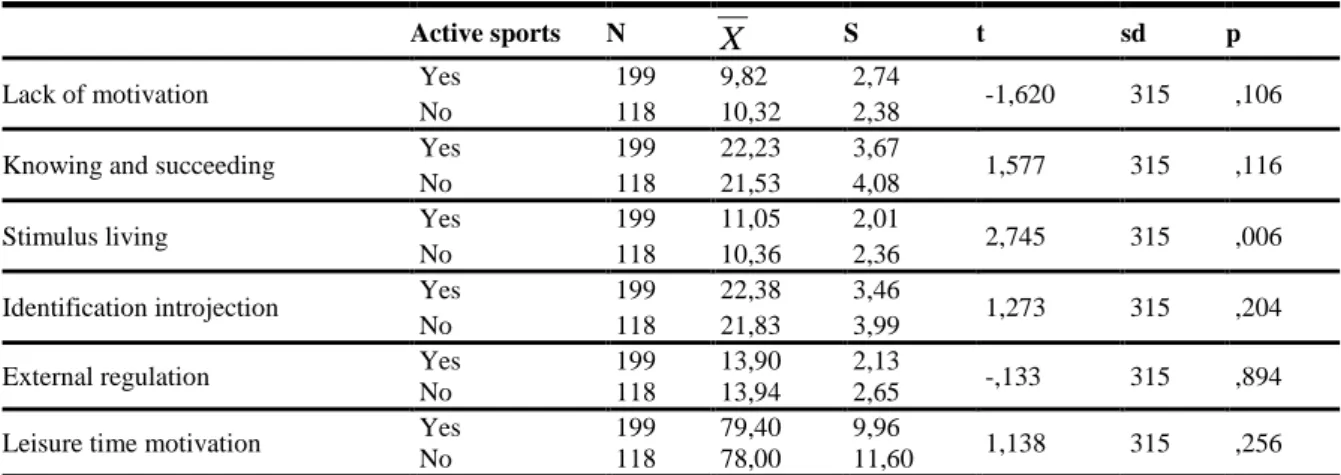
Table 9. Independent Sample T-Test Results for Participants’ Perceptions Regarding Leisure Time Motivations based on engagement in active sports
Active sports N X S t sd p
Lack of motivation Yes 199 9,82 2,74 -1,620 315 ,106
No 118 10,32 2,38
Knowing and succeeding Yes 199 22,23 3,67 1,577 315 ,116
No 118 21,53 4,08
Stimulus living Yes 199 11,05 2,01 2,745 315 ,006
No 118 10,36 2,36
Identification introjection Yes 199 22,38 3,46 1,273 315 ,204
No 118 21,83 3,99
External regulation Yes 199 13,90 2,13 -,133 315 ,894
No 118 13,94 2,65
Leisure time motivation Yes 199 79,40 9,96 1,138 315 ,256
No 118 78,00 11,60
*p<,05 Criteria: “Yes=1”; “No=2”
According to the findings, for stimulus living subfactor, motivation levels of the participants actively playing sports ( = 11,05) and who do not ( = 10,36) are statistically different in favor of active players (t315=2,745;
p=,028 < ,006). The average scores of the participants for the other subfactors are not statistically different depending on actively playing sports (F(3-313)=,316; p=,814 > ,05). As
a result, actively playing sports was not a significant variable on the subfactors of lack of motivation (t315=-1,620; p=,106 > ,05),
knowing and succeeding (t315=1,577;
p=,116>,05), identification introjection (t315=1,273; p=,204 > ,05) and external
regulation (t315=-,133; p=,894 > ,05).
DISCUSSION AND RESULT
Descriptive statistics of the scores for barriers to leisure time in general and sub-factors showed that there were factors preventing the participants’ leisure time according to their perceptions. In shaping this perception, lack of facilities to value their time ( =2,96), lack
of sufficient time ( =2,80), lack of information about leisure time ( = 2,78), similarly lack of interest for leisure time ( = 2,76), lack of friends to value leisure time ( = 2.66) and indivial psychology of the student ( =2.62) are the effective factors respectively.
Responses to leisure time motivation scale revealed the following results: “identification introjection” ( = 3,69), “knowing and succeeding” ( = 3,66), “stimulus living” ( =3,59), “leisure time motivation” ( =3,58).
Descriptive statistics of the barriers to leisure time scale and its sub-factors asserted that the highest score was the lack of facility. In many studies conducted in this field, lack of facilities was concluded to be an important factor. Lack of knowledge and time factors are also high rated factors. The results also revealed that students were not aware of potential recreational activities in their leisure
_____________________________________________________________________________________
________________________________________________________________________________________________________________________ INTJORASS
International Journal of Recreation and Sport Science 2018; 2(1);39-52 48
time or their time was not sufficient. Elective courses can be added to reduce the impact of the time factor, which is considered as an obstacle for students to value their free time. In a study conducted by Kaya (2011), 91.9% of the students said that university facilities were not sufficient and only 8.1% of the students thought the facilities were sufficient. In another study, Eroğlu (2001) asked similar questions in five universities and highest percentage of students said that their university lack the supportive environment and the facilities for valueing their leisure time (Muğla University % 46.5, Ege University % 34.4, Dokuz Eylül University % 40.6, Celal Bayar University % 35.3, Balıkesir University % 48.3) (Eroğlu, 2000). Zengin, Sertbaş ve Kolayiş (2006) concluded in their study that % 67,1 of the students are not able to participate in recreational activities (Zengin, vd., 2006). For the students who declared that they can’t participate in recreational activities to the desired level, lack of facilities and equipment got the highest rate among other reasons. Although the rates obtained in these studies are lower than the results of our study, similar results suggest that there is an important problem to be solved for university students in our country. In a study conducted by Süzer (1997) at four different departments of Pamukkale University, 54.8% of the students stated that “there are no facilities, equipment and material in this environment” and 3l.7% stated that “no one directs me how to participate in recreational activities” among the students who stated that they could not attend leisure time activities as much as they wanted, The findings about student perceptions for barriers to leisure time and leisure time motivation were investigated for possible gender differences. The ratings of the barriers to leisure time scale in general and the sub factors revealed that even though there is a difference fort he scale in general, the results were not statistically significant. ( = 50,74; = 49,11), (t315=1,86; p=,063 >
,05). For individual psychology sub factor, the average rating of the female participants was higher than ( = 8,16) male participants
( = 7,68) and this difference was statistically significant (t315=2,08; p=,038 <
,05). According to this, women are concluded to perceive individual psychology, sub factor of barriers to leisure time scale, as a more important factor.
Similarly, females ( = 8,63;
=8,14) have a higher average rating than males for “lack of information” sub-factor and this difference was statistically significant (t315=2,11; p=,035 < ,05).
Accordingly, among other sub factors of barriers to leisure time scale, women perceptions on “lack of information” were higher. Women also have higher average scores for the rest of the sub factors; lack of facility (t315=,97; p=,328 > ,05), lack of
friends (t315=,67; p=,501 > ,05), time (t315=,86;
p=,387 > ,05) and lack of interest (t315=,56;
p=,573 > ,05). However, the differences were not statistically significant. As a result, women and men seem to have similar perceptions about other sub factors of barriers to leisure time scale.
When the findings about student perceptions for leisure time motivation were investigated for possible gender differences, for the scale in general, ratings of female participants ( = 79,41) were higher than males ( = 78,50) but the differences were not statistically significant (t315=,749; p=,455 >
,05). For lack of motivation sub factor, there was a statistically significant difference between females ( = 10,40) and males ( = 9,74) (t315=2,20; p=,028 < ,05). In
line with this, motivation levels of women were higher than men for lack of motivation sub factor. There were no statistically significant gender differences for other sub-factors of the leisure time motivation scale; knowing and succeeding (t315=1,01; p=,309 >
,05) stimulus living (t315=,66; p=,507 > ,05),
identification introjection (t315=,17; p=,862 >
,05) and external regulation (t315=-1,63;
p=,103 > ,05).
Alexandris and Carroll (1997) reported that gender had a positive effect on recreational activities in their study. Culp (1998) stated
____________________________________________________________________________________
________________________________________________________________________________________________________________________ INTJORASS
International Journal of Recreation and Sport Science 2018; 2(1);39-52 49
that gender is an important component of social influence and an important element that limits the recreational activities of individuals. Akyüz and Türkmen (2016) found that, there were significant differences about affective area, cognitive area and total area between male and female students based on t test results in their study to determine the attitudes of university students towards recreational activities.
Many scientific studies have supported this phenomenon. Henderson et al. (1996) stated in their study that the issues faced by men and women are different and therefore the activities they perform in their leisure time are different. According to Moccia (2000) and Gümüş et. al (2017), gender plays an important role in choosing leisure time activities. In their study, Altergoot and McCreedy (1993) reached supportive results for Moccia (2000) and found that family structure and gender play an important role among the factors affecting the participation of individuals in recreational activities. Hudson (2000) found significant differences between men and women in participating in leisure activities in his study. Women are more likely to face barriers to participating in recreational activities than men (Henderson and Bialeschki 1993; Shaw 1994), and many women believe that they are not given enough opportunity to participate in recreational activities (Henderson and Bialeschki, 1993). In her study, Henderson (1995) found that women did not get enough support from their families to participate in leisure activities and that they did not have enough free time. The physical structure of women can also affect participation in leisure activities. James (1995) found that because of a variety of reasons, women's physical appearance can limit the activities that they participate in public facilities. Archer and McDonald (1990) determined that some adolescent girls do not participate in some sports activities because of gender. Stronger body structure of men compared to women is the main reason for men’s preference for physical activities (Kane, 1990).
There was no statistically significant difference between different departments about barriers to leisure time. Students of Physical Education and Sports Teaching Department had higher average scores for the scale ( = 50,04) compared to other departments ( = 49,89; = 48,80; = 49,83). These findings were not statistically significant (F(3-313)=,230; p=,876 >
,05). Accordingly, it is concluded that students at different departments have similar determinants of barriers to leisure time. Findings for “lack of information”, “time” and “lack of interest” sub-factors of the scale were also similar. “Lack of information” scores for Students of Physical Education and Sports Teaching Department were higher ( = 8,47) compared to other departments ( = 8,40; = 8,19 = 8,24) (Table 12). However, this difference was not statistically significant (F(3-313)=,264; p=,851 > ,05). In a
study of Demirel and Harmandar (2009), it is concluded that universities are different in lack of information sub-factor among possible barriers to attend leisure time activities for university students.
The analysis on leisure time motivation scale and its sub-factor scores for the possible differences between students at different departments revealed that average scores for the scale in general are not statistically significant (F(3-313)=,316; p=,814 > ,05).
Accordingly, it is concluded that students at different departments have similar determinants of leisure time motivations. For the lack of motivation sub-factor of the scale, average scores for students of sports management ( = 10,72) were higher than the scores of the other departments
( = 9,90; = 10,21 = 9,58).
However, these differences were not statistically significant (F(3-313)=1,975; p=,118
> ,05). For the other sub-factors, there were no significant differences between average scores of students at different departments: “knowing and succeeding” (F(3-313)=,988;
_____________________________________________________________________________________
________________________________________________________________________________________________________________________ INTJORASS
International Journal of Recreation and Sport Science 2018; 2(1);39-52 50
p=,675 > ,05), “identification introjection” (F(3-313)=,497; p=,685 > ,05) and external
regulation (F(3-313)=,683; p=,563 > ,05).
In the study conducted by Aydın (2012) comparing the students of the department of physical education and the other department students, a significant difference was found in favor of the students of other departments in the relationship between the levels of leisure time and social harmony.
Similar results were reached in the study conducted by Türkoğlu (2009). The study showed that physical education teachers and high school students taking physical education courses have positive attitudes towards the environment. Although both physical education teachers and students stated that they did not have much time to participate in environmental recreational activities, they could follow the developments in the media and pay attention to share this information with their friends.
When the students' perceptions about barriers to leisure time and their motivation for leisure time were analyzed for possible changes due to their active engagement in sports, no significant difference was found for the overall scale. However, when the sub-factors were examined, a significant difference was found in favor of students playing active sports for lack of friends and stimulus living sub-factors. Low motivation of individuals to play sports alone may be the cause of these differences. When the descriptive averages and sub-factors of the scales are examined, the participants are seen to exhibit similar characteristics.
According to the results of pearson moments correlation analysis of the relationship between barriers to leisure time and leisure time motivation levels of the university students, there is a low but significant relationship between the barriers to leisure time (scale in general) and leisure time motivations (scale in general) of the participants (r =, 26, p =, 000 <, 05). The barriers to leisure time of university students explains about 7% of the leisure time motivations (r2 = 0,26X0,26 = 0,07). Briefly,
there is a low level of relationship between
leisure time motivation and barriers to leisure time perceptions of physical education and sports college students.
According to the results of the research; leisure time activity scores are close to each other for males and females. Gender can be considered as one of the important factors affecting the participation of individuals in leisure time activities. In the study of Akyüz and Turkmen (2016), “The place and importance of sports activities for valueing the leisure time of candidate students of Physical Education and Sports School”, the candidate students were reported to benefit at a low level from the municipal facilities. In our study, it is found that facility sub-factor has the highest score among barriers to leisure time sub-factors, the facilities are limited in many departments, all of the students cannot completely benefit from them and the equipment and the materials are insufficient. Low scores for valuing leisure time for PE and Sports School students playing active sports are caused by limited recreational areas within the school.
In a study conducted by Barkın in 2016; statistically significant differences were found between gender, physiological characteristics, status of the facilities, side causes variables in the participation of recreational physical activity; in the comparison of faculty and college students, statistically significant differences were found between status of facilities, negative internal balance and economic status and finally statistically significant differences were found between the physiological characteristics, the status of the facilities, the economic situation and organizational elements for the class distribution (Barkın, 2016).
For this reason, it is recommended to give training seminars for the students within the university to develop skills in time management and to arrange the activities in accordance with the leisure time of the students. Also it is recommended to expand and to regulate the recreational areas in the university in line with the needs of the students.
____________________________________________________________________________________
________________________________________________________________________________________________________________________ INTJORASS
International Journal of Recreation and Sport Science 2018; 2(1);39-52 51
REFERENCES
Alexandris, K. & Carroll, B. (1997). Demographic differences in the perception of constraints on recreational sport participation: Results from a study in Greece. Leisure Studies, 16(2), 107-125. Altergott, K. & McCreedy, C. C. (1993). Gender
and family status across the life course: constraints on five types of leisure. Loisir et Société/Society and Leisure, 16(1), 151-179.
Akyüz, H. & Türkmen, M. (2016). The Place and Importance of Sport Activities in Treating their Leisure Time for Potential Students of Physical Education and Sports School. International Journal of Science Culture and Sport. December 4 (SI:3) Doi : 10.14486/IntJSCS613
Akyüz, H. & Türkmen, M. (2016). Examination of university students' attitudes towards recreational activities: Case of Bartın University. (Master's thesis, Bartın University, Faculty of Educational Sciences).
Archer, J. & McDonald, M. (1990). Gender roles and sports in adolescent girls. Leisure Studies, 9(3), 225-240.
Aydın, E. (2012). Examining the relationship between students' use of their leisure time and social adaptation and communication skills. Unpublished Master’s Thesis, Karadeniz Technical University, Faculty of Educational Sciences, Trabzon.
Balcı, V., Demirtaş, M., Gürbüz, P., İlhan, A. & Ersöz, V. (2003). A Research on Participation of University Students in Ankara to Recreational Activities., 158, 161-173.
Barkın, E. (2016). A Research on Barriers to Participation of University Students to Physical Recreational Activities. (Unpublished Master’s Thesis). Muğla Sıtkı Koçman University, Faculty of Social Sciences, Muğla.
Chen, J. G., Wadhwa, N., Cha, Y. J., Durand, F., Freeman, W. T. & Buyukozturk, O. (2014). Structural modal identification through high speed camera video: Motion magnification. In Topics in Modal Analysis I, 7, 191-197. Springer, Cham.
Culp, R. H. (1998). Adolescent girls and outdoor recreation: A case study examining constraints and effective programming. Journal of Leisure Research, 30(3), 356. Dülger T., Handan, et al.(2009). Measuring Life
Quality in İstanbul. İstanbul'da yaşam kalitesinin ölçülmesi. İtü Dergisi/A, 7.2. Deci, E. L., Vallerand, R. J., Pelletier, L. G. &
Ryan, R. M. (1991). Motivation and education: The self-determination perspective. Educational psychologist, 26(3-4), 325-346.
Demirel, M. & Harmandar, D. (2009). Determining the Potential Barriers to Participation of University Students to Recreational Activities, International Journal of Human Sciences.,6(1), 838-846.
Eroğlu, F. (2000). Behaviour Sciences., 5th Edition, İstanbul: Beta.
Gümüş, H., Özgül, S.A. & Karakılıç, M. (2017). Fiziksel Aktivite için Park ve Rekreasyon Alanlarına Gelen Kullanıcıların Mekân Seçimini ve Fiziksel Aktiviteye Katılımını Etkileyen Faktörler, Spormetre, 15(1), 31-38.
Gürbüz, M. & Aydın, A. H. (2012). The Concept
of Time and Its Management.
Kahramanmaraş Sütçü İmam University, Journal of Social Sciences, 9(2).
Henderson, K. A. (1995). Women's leisure: More truth than facts?. World Leisure Recreation, 37(1), 9-13.
Henderson, K. A., Bialeschki, M. D., Shaw, S. M., & Freysinger, V. J. (1996). Both gains and gaps: Feminist perspectives on women’s leisure. State College, PA: Venture.
Henderson, K. A. & Bialeschki, M. D. (1993). Negotiating constraints to women's physical recreation. Loisir et societe/Society and Leisure. 16(2), 389-411.
Kane, M. J. (1990). Female involvement in physical recreation—Gender role as a constraint. Journal of Physical Education, Recreation and Dance, 61(1), 52-56. Karaküçük, S. (2005). Recreation-Treating
_____________________________________________________________________________________
________________________________________________________________________________________________________________________ INTJORASS
International Journal of Recreation and Sport Science 2018; 2(1);39-52 52
Kaya, A. M. (2011). Investigation of University Students' Attitudes towards Recreational Activities and Leisure Time Motivations in Terms of Some Variables. Unpublished master’s thesis. Cumhuriyet University Institute of Health Sciences, Sivas
Mete, B. & Ağaoğlu, S. A. (2003). Studying participation and perspectives of academic and administrative staff of Ondokuz Mayıs University Kurupelit Campus. Physical Education and Sport in Social Fields Congress, Ankara, 421-426.
Moccia, F. D. (2000). Planning time: an emergent European practice. European Planning Studies, 8(3), 367-375.
Mutlu, İ. (2008). A Research on the Attitudes of People Doing Exercise toward Leisure Time (Case of Kayseri Province). (Unpublished master's thesis). Niğde University Institute of Social Sciences. Niğde.
Özkalp, E. (1997). Introduction to Behavioral Sciences, Publication Number: 1027, Eskişehir: Anadolu University
Soyer, F., Yıldız, N. O., Demirel, D. H., Serdar, E., Demirel, M., Ayhan, C. & Demirhan, O. (2017). Examining the relationship between the factors that hinder the participation of university students in recreational activities and the life satisfaction of the participants Journal of Human Sciences, 14(2), 2035-2046. Tel, F. D. & Sarı, T. (2016). Self-sensitivity and
life satisfaction of university students. University, Journal of Faculty of Education, 292-304.
Zengin, E., Sertbaş, K. & Kolayiş, H. (2006). Physical education and sports college students' leisure profiles and racket in Kocaeli University. Sports Management and Information Technologies, 1(1).s.17-28